Journal of RANGE
MANAGEMENT
Vozume~Z.,
comber
1Effects of Moisture Stress on Germination of Alkali Sacaton,
Galleta, and Blue Grama ___._______ __..._... ___._______________.-___---_-_.--___--- . . . . 0. D. Knipe 3
Chemical Composition and In Vitro Digestibility of Forbs Consumed by Cattle
Grazing Native Range ___.._..______ 0. E. Hoehne, D. C. Clanton, and C. L. Streeter 5 Factors Influencing Halogeton Invasion of Crested Wheatgrass
Range ____________________-_--____________-_--_________-_---__----______________---_--__.._--- Neil C. Frischknecht 8 Soil Moisture Response to Spraying Big Sagebrush with 24-D ______ Ronald D. Tabler 12
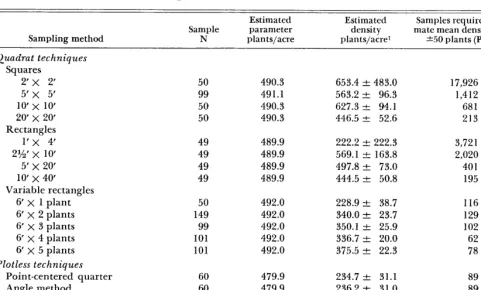
An Evaluation of Density Sampling Methods in a Shrub Community _... L. Jack Lyon 16 Effect of Nitrogen Fertilization on Certain Factors -of a Western Nebraska
Range Ecosystem _______________.____ D. F. Burzlaff, G. W. Fick, and L. R. Rittenhouse 21
Productivity of a Soil Biosequence of the Fescue Prairie-Aspen
Transition _____________.______________----_---________---___-____ L. E. Lutwick and J. F. Dormaar 24
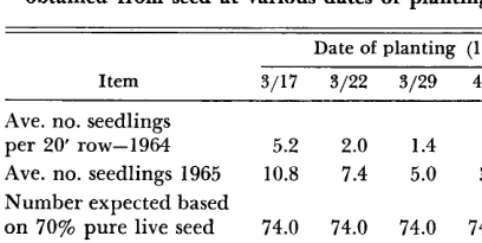
Establishment of Eastern Gamagrass from Seed and Vegetative
Propagation ______________________________...__-__________._ Robert M. Ahring and Harry Frank 27
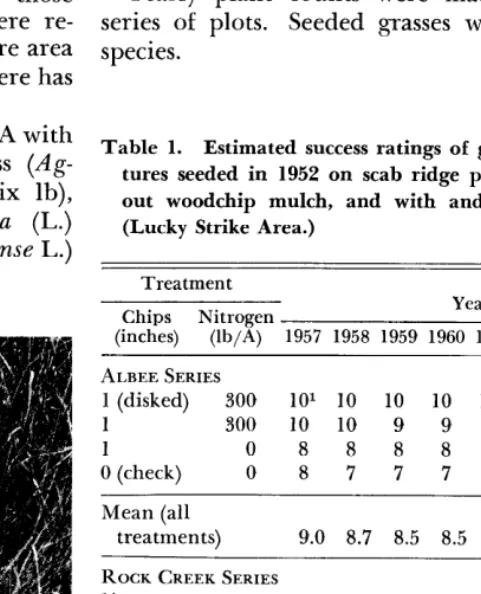
The Use of Woodchips and Nitrogen Fertilizer in Seeding Scab
Ridges ____________________-________________---_--.____________________----______.__________________.____ Gerard J. Klomp 3 1 Prediction by Nonlinear Programming of Relative Chemical Composition
of Dietary Botanical Components ________________________-.________________ George M. Van Dyne 37 Grazing Studies on Native Range, Crested Wheatgrass, and Russian
Wildrye Pastures _____________________---___..___-_______-__.----_---_--.________---._....________---_.--_ S. Smoliak 47 Technical Notes:
Comparison of Vegetation on Grazed and Ungrazed Pinyon-Juniper
Grassland Sites in Southcentral New Mexico .____________...____-___ Rex D. Pieper 51
Comparative Mineral Composition of Longstalk and
Alsike Clovers ____________________---...._.-_--___.- John W. Hamilton and Carl S. Gilbert 53 Book Reviews:
Empleo de Animales en las Investigaciones Sobre Pasturas (Mariano Segura B.) ; The Future Environments of North America (James K. Lewis) ______..____________ 55
News and Notes ____________________.___----_---_________________.__----_---________---__-__---_-__-_---___.--_---_--_ 57 Letters to the Editor ___________________________.________--_______---__--_____---_-_--________----______-_----_---____---_--- 60
cover
Photo-Measuring
Winter Soil Moisture
Effects of Moisture Stress on
Germination of Alkali Sacaton,
Galleta, and Blue Grama
10. D. KNIPE Associate Plant Ecologist,
Rocky Mountain Forest and Range Exp. Sta.,z U.S.D.A., Forest Service, Albuquerque, New Mexico.
Highlight
Seeds of alkali sacaton, galleta, and blue grama were germinated in media representing moisture tensions of 0, 1, 4, 7, 10, 13, and 16 atm. Alkali sacaton germination was most severely affected by moisture stress, which helps to explain, at least in part, why alkali sacaton plants are confined mainly to areas that are frequently flooded. In contrast, galleta and blue grama are less affected by moisture stress and, therefore, can become established and survive on the drier upland sites.
Natural regeneration of the principal grass spe- cies in most parts of the Rio Puerto watershed area of west-central New Mexico is virtually nonexistent. The principal species of the area, alkali sacaton (Spore bolus airoides Torr.), galleta (Hilaria jamesii Torr.), and blue grama (Bouteloua gra- cilis [H.B.K.] Lag.) occur mainly as widely spaced vegetal islands. Observations over a period of several years have shown that seed production by these species is not lacking, yet large spots devoid of perennial plants remain intermixed with the islands of vegetation.
The ecology of alkali sacaton, galleta, and blue grama is being studied in an effort to determine what can be done to promote soil stabilization of the area. The present study is one phase of the overall ecological study. Its objective was to de- termine the effect of moisture stress on seed ger- mination.
Several workers have used aqueous solutions of mannitol to limit moisture availability while studying the germination response of grasses to various levels of moisture tension. Helmerick and Pfeifer (1954), in tests with winter wheat, found that limiting moisture by use of aqueous mannitol- moistened blotters in petri dishes produced results similar to those obtained by use of the pressure membrane method. Powell and Pfeifer (1956), Dotzenko and Dean (1959), and Younis et al.
l Research reported here was conducted in cooperation with the Bureau of Land Management, U.S. Department of the Interior.
2 Central headquarters maintained at Fort Collins in co- operation with Colorado State University; author stationed at Albuquerque in cooperation with the University of New Mexico.
(1963) have effectively tested drought hardiness by use of aqueous mannitol solutions. McGinnies (1960) and Knipe and Herbel (1960) used aqueous mannitol solutions to determine the effect of mois- ture stress on germination of several grass species. The effect of different levels of moisture tension on the germination of alkali sacaton, galleta, and blue grama apparently has not been investigated.
Methods and Materials
Seeds used in the study were collected within the Rio Puerto watershed near the village of San Luis, 58 miles northwest of Albuquerque, New Mexico. The alkali sacaton seeds were collected in 1962, the galleta and blue grama seeds in 1965. Three-year-old alkali sacaton seeds were used, be- cause recent tests have shown that this species requires an after-ripening period before appreci- able germination can be expected.3 The seeds were stored in cloth bags at room temperature.
The seeds were selected without regard to size or color, but only fully developed, undamaged seeds were used. The seeds were germinated in 4-inch-diameter petri dishes in a Stultz germinator programmed for 8 hr light at 86F and 16 hr dark- ness at 68F daily. The germination substrate was two thicknesses of standard blue germination blotter paper. Each species was replicated four times at moisture tension levels of 0, 1, 4, 7, 10, 13, and 16 atm. There were 100 seeds per repli- cation. Levels of moisture tension were attained by saturating the blotters with aqueous mannitol solution prepared in accordance with the formula given by Helmerick and Pfeifer (1954). Since the osmotic tension of a solution varies with tempera- ture, and since an alternating temperature regime was used, the concentration of mannitol was ad- justed to give the desired tension at the interme- diate temperature of 77F. Tap water was used for the 0 atm treatment.
Seedlings were counted daily from the second through the tenth day and at three-day intervals thereafter. The test was terminated after 32 days. Seeds that produced seedlings whose radicles and plumules exceeded 5 mm in length were counted as germinated. Molded and softened seeds were re- moved from the dishes as they occurred during the study. The final germination percentages were transformed by arcsin of square root of percentages for analysis of variance.
Seedling vigor was evaluated qualitatively on the fifth day after the start of the study. These evalu-
3 Germination percentages in the neighborhood of 20 to 30 the first year, 40 to 60 the second, and 70 to 85 the third year are characteristic of alkali sacaton. Germination per- centages of galleta and blue grama range from 80 to 95 without benefit of after-ripening.
4 KNIPE
Table 1. Percent germination of three grass species at Table 2. seven levels of moisture tension (am) after 32 days. Each
Time (days) required for alkali sacation, galleta, and blue grama to reach 90 percent of the total germina- value is the mean of four replications of 100 seeds each. lion attained after 32 days at each of seven levels of
moisture tension (am).
Moisture tension ~ Spccier
Alkali SacaL”,, Gallera llhe gram
MOiSlllL1 tension
Species
0.0 76.75
A,l\ali sIIL*t”II
81.25ZI 96.75a ta,eta HIIIL. grama
1.0 69.25 83.00.x 95.25a 0 3 2 2
4.0 50.25 81.OOa 93.25a 1 6 2 2
7.0 39.00
10.0 18.50
13.0 7.5Oa’
16.0 3.00a
77.OOab 72.25b 7125bc 65.50~
92.5o.a 74.5Ob 72.75b 42.25 ‘Any two means within species not followed by the same letter
are significantly different (I5 level, Duncan’s new multiple range procedure, Steel and Torrie, 1960).
ations were based on obvious size differences be- tween controls and seedlings subjected to moisture tension treatment.
Results and Discussion
+ 5 4 7
7 6 4 13
10 16 6 Ifi
I3 12 5 18
16 22 8 24
Moisture tension affected seedlingvigormarkedly. Moisture tensions in excess of 1 atm noticeably reduced vigor of alkali sacatm and blue grama seedlings (Fig. 1); tensions in excess of 4 am noticeably reduced vigor of galleta seedlings.
LITERATURE CITED
Of the species tested, alkali sacatm was affected DOTZENKO, A. D., AND J. G. DEAN. 1959. Germination of
most by increases in moisture tension. Percent Am-on. 1. 51:308-309. six alfalfa varieties at three levels of osmotic pressure. germination was significantly reduced by 1 atm HELMERICK, R. H., AND R. P. PFEIFEK. 1954. Differential y _I
moisture tension, and was further reduced by each 3 atm increase with the exception of 13 to 16 atm
responses of winter wheat germination and early growth
to controlled limited moisture conditions. Agron. J. 46:
/I-able \ 1\ 560-562.
^-I-_ -i’
Percent germination of galleta and blue grama KNIPE, 0. D., AND C. H. HERBEL. 1960. The eiiects of was not significantly reduced until a moisture limited moisture on germination and initial growth of tension of 10 am was reached. Both galleta and six grass species. J. Range Manage. 13:297-302.
blue grama germinated as well at moisture tensions MCGINNIES, W. J. 1960. Effects of moisture stress and of 13 as at 10 atm, and galleta germinated equally temperature on germination of six range grasses. Agron. I. 52:159-162. as well at 16 as at 13 at& _ Po”vmm., L. M., xrvo R. P. PFEIFER. 1956. The effect of
The rapidity of germination of galleta and blue controlled limited moisture on seedling growth of Chey- grama was delayed by a moisture tension of 4 atm, rnne winter wheat selections. Agron. J. 48:555-557. and the rapidity of germination of alkali sacatm STEEL., R. G. D., AND J. H. Tonnt~. 1960. Principles and
was delayed by a moisture tension of 1 atm. Delays procedures of ,o, Ino statistics. McGraw~Hill Book Co., Inc., p.
in germination due to moisture tension were not ‘“‘-IYa’
analyzed statistically, but it is obvious that such YOUNIS, M. A., F. C. STICKER, AND E. I.. DOREWEN. 1963. Reactions of seven alfalfa varieties under simulated
Chemical Composition and In Vitro
Digestibility of Forbs Consumed by
Cattle Grazing Native Range
10. E. HOEHNE,2 D. C. CLANTON, AND C. L. STREETER3
Former Instructor and Graduate Student, Professor and former Graduate Student, respectively,
in Animal Science, University of Nebraska, Lincoln.
Highlight
Forbs consumed by cattle grazing native range had higher dry matter digestion coefficients and contained greater quantities of ash, calcium, phosphorus, crude protein, and total sugars, but contained less dry matter than grasses con- sumed at the same time. Forbs constituted as much as 50% of the dry matter of samples collected from esophageal fis- tulated cattle grazing native range. Based on their dry mat- ter digestion coefficients and chemical composition, forbs did supply a significant amount of nutrients to grazing cattle while being consumed.
Use competition between plants, climate, and soils influence the vegetation growing on native range. Rangeland along the edge of farmland is often characterized by a large amount of forbs in the total vegetation. In some years rangelands con- tain a large amount of forbs as a result of ideal moisture and temperature conditions. The value of these forbs as a desirable source of nutrients is relatively unknown.
The purpose of the research reported was to evaluate the nutritive value of several forbs actually consumed by grazing cattle at the Scotts Bluff Ex- perimental Range in western Nebraska. Chemical composition and in vitro dry matter digestibility of the forbs were used to indicate their nutritive value. Samples from cattle fitted with esophageal fistulae were used to indicate the amount of forbs con- sumed by the cattle.
Procedure
Vegetation cover of the range area was determined by the method of Burzlaff (1966).
The major forbs present on the sands range site studied were bracted spiderwort (Tradescantia bracheata), stickseed (Lappula redowski), prairie sunflower (Helian thus petio- laris), skeletonplant (Lygodesmia rostrata), yucca (Yucca glauca), lambsquarters (Chenopodium album), and sand sage (Artemisia filifolia). Dominant grasses present on the range during the grazing trials were needleandthread (Stipa
1 Published with the approval of the Director as Paper No. 2074, Journal Series, Nebraska Agricultural Experiment Station.
2 Present address: University of Arizona, Animal Science Department, Tucson.
3Present address: Armed Forces Institute of Pathology, Bio- chemistry Branch, Washington, D. C.
comata), prairie sandreed (Calamovilfu Zongifolia), and blue grama (Bouteloua gracilis).
Forage samples were obtained from Hereford cattle fitted with esophageal fistulae. Four yearling steers were used for collection in 1964 and four ovariectomized yearling heifers handled in the same manner were used in 1965.
Fifteen- to 20-minute collections were made at 5:00 AM on 20 different days during the summer grazing season of 1964 and on 11 different days during the same season in 1965. No previous grazing occurred on any of the study plots during the year they were used.
Forage samples from the esophageal fistulae were hand separated into individual grass and forb species. While the cattle were grazing, hand-clipped samples, simulating graz- ing of the plant species, were collected. An attempt was made to hand-clip samples at a similar height and to contain similar plant parts as the vegetation consumed by the cattle. The hand-clipped samples were dried and chemically ana- lyzed for dry matter, acid-detergent fiber and lignin, ash, calcium, phosphorus, chloride, total sugars, soluble carbo- hydrates, and crude protein using methods described by Hoehne (1966).
In vitro digestibility in the artificial rumen was obtained by the method of Tilley and Terry (1963). Rumen liquor for the artificial rumen was obtained by gravity flow from a tube via the esophageal fistula from four two-year-old Hereford heifers grazing native grasses in eastern Nebraska. The heifers were the same as those used for esophageal fis- tula sample collection in 1965. The heifers were removed from feed and water overnight and the rumen liquor from all animals was combined to reduce animal variation in microbial population in the inocula. Four replicate fer- mentation flasks were used on each hand-clipped forb sam- ple in the artificial rumen; alfalfa stems were used as a standard.
Results and Discussion
The following discussion was based on esopha- geal samples collected from cattle grazing for 20 min on previously ungrazed native range for that year. Although the cattle preferred some forbs over grasses in the first 20 min, the diet for the entire day could not be composed of the forbs if the amount of forbs in the pastures was not a large part of the total vegetation on the range.
Forbs comprised from 1.0 to 9.0% of the vegeta- tion cover with an average of 4.8% in 1964 (Table 1) a dry year with less than 1.0 inch of precipita- tion from June 12 to September 15. In 1965, a year with more than average precipitation, forbs com- prised from 6.5 to 50.0% of the vegetation with an average of 3 1.4y0 (Table 2).
Forage samples collected from the esophageal fistulated cattle were comprised of 0.7 to 53.3% forbs in 1964 with an average of 14.0% (Table 1). In 1965, forbs comprised from 1.6 to 82.6% of the grazed samples with an average of 43.6% (Table 2). These data indicate that forbs comprised an impor- tant part of forage samples collected from esopha- geal fistulated cattle at certain times during the summer in 1964 and the entire summer grazing season in 1965.
6 CHEMICAL COMPOSITION
Table 1. Percent forbs and grasses in vegetation cover on the grazing area and in esophageal samples, 1964.
Date 6/6 619 6/12
6115 6118 6/21 6124 6127 6130 713 719 7118 7124 7130 815 S/11 S/17 S/26 9/l 917 Average
Vegetation cover Forbs Grasses
9.0 91.0 6.5 93.5
5.0 95.0 4.0 96.0 3.0 97.0 2.0 98.0 3.0 95.0 4.5 95.5 4.0 96.0 2.0 98.0 7.0 93.0 6.3 93.5 8.5 91.5 9.0 91.0 7.0 93.0 2.0 98.0 1.0 99.0 7.5 92.5 2.5 97.5 2.0 98.0 4.8 95.2
Esophageal sample Forbs Grasses
2.0 98.0 0.8 99.2
9.3 90.7 6.2 93.8 29.2 70.8 17.6 82.4 20.7 79.3 26.3 73.7 53.3 46.7 50.8 49.2 14.1 85.9 9.3 90.7 7.7 92.3 7.6 92.4 14.6 85.4 1.1 98.9 2.0 98.0 5.7 94.3 0.7 99.3 1.9 98.1 14.0 86.0
In vitro dry matter digestion coefficients of hand- clipped samples of forbs were high, and ranged from 56% to 88% (Tables 3 and 4). The in vitro values would not be expected to be greatly differ- ent from in vivo digestion coefficients (Tilley and Terry, 1963). Bracted spiderwort had the highest digestion coefficient of forbs consumed in 1964 and lambsquarters and bracted spiderwort had the high- est digestion coefficients of the forbs eaten in 1965.
Table 2. Percent forbs and grasses in vegetation cover on the grazing area and in esophageal samples, 1965.
Date 6/4
6/14 6/21 6128 715 7/15 7/19 7126 812 819 S/16
Average
Vegetation cover Forbs Grasses
37.0 63.0 26.1 73.9 36.4 63.6 38.6 61.4 32.8 67.2 50.0 50.0 24.7 75.3 6.5 93.5 22.4 77.6 24.6 75.4 45.8 54.2
31.4 68.6
Esophageal sample Forbs Grasses
19.6 80.4 70.8 29.2 70.8 29.2 82.6 17.4 47.7 52.3 42.8 57.2 30.4 69.6 1.6 98.4 1.8 98.2 45.9 54.1 65.4 34.6
43.6 56.4
In vitro values for lambsquarters and prairie sun- flower in 1965 were reported by Streeter (1966).
Previous research has shown that changes in cal- cium, phosphorus, ash, chlorides, crude protein, water soluble carbohydrates, total sugars, and fruc- tose occurred due to salivary contamination of esophageal forage samples (Hoehne et al., 1967). The amount of these constituents present in the esophageal samples was, therefore, assumed to be equal to the sum of the products of the chemical composition of each constituent in the hand-clipped vegetative species and the botanical composition of these species in the esophageal samples (Fig. 1).
In 1965, the forbs provided from 0.7 to 90.8% of the ash, 0.4 to 86.6% of the crude protein, 0.2 to 92.1% of the total sugars (sucrose, glucose, fruc- tose), 0.4 to 91.3% of the soluble carbohydrate, and
Table 3. Dry matter digestion coefficients and chemical composition of forbs consumed in 1964. Analyses were made on hand-clipped samples.
Dig. Cal- Phos- Chlo- Dry Crude Crude Water Total
Coef. Ash ride matter Prot.
Species Date (%> (%> cium (%> phorus (%> ratio C/P (%) (%> (%> Lignin (%‘o> fiber (%) Sol. CHO sugars (%> (%)
Bracted spiderwort 6/15 88 14.5 - .32 - - - 15.8 2.5 - 9.9 3.5 6127 82 15.4 2.87 .36 8:l - 13.6 14.6 - - 9.4 3.4
6130 82 - - - - - 18.2 11.3 - - 10.5 3.6
713 80 - - - - - 14.3 - - - 11.0 3.2
Beggars lice 6/18 58 23.1 4.39 .22 19.9 : 1 - - 10.2 - - - -
6127 59 22.5 3.75 .20 18.7 : 1 - 26.8 6.6 8.1 - 13.1 3.8
6/30 61 19.0 4.19 .19 22:l - 32.3 7.0 8.1 42.7 12.2 3.6
Skeletonplant 6124 69 9.9 1.54 .22 7:l - 27.6 13.3 7.4 - 8.0 3.0 713 66 8.6 1.23 .18 6.8 : 1 - 27.7 12.5 6.1 34.7 7.1 2.4
719 62 - - - - - 30.4 - - - 7.0 2.2
7/15 62 - - - - - 32.0 - - - 6.4 2.0
S/11 58 7.2 1.67 .I5 11.1 : 1 .35 35.4 10.0 10.8 - 7.2 2.5
Yucca heads S/11 60 - - - - - 29.1 13.7 4.0 38.7 9.4 2.7
Sand sage S/11 61 6.0 1.00 .24 4.2 : 1 .33 - 10.5 - - 9.8 1.8 Alfalfa standard 53
HOEHNE, CLANTON, AND STREETER 7
Table 4. Dry matter digestion coefficients and chemical composition of forbs consumed in 1965. Analyses were made on hand-clipped samples.
Species
Dig. Coef. Date (%)
Cal- Phos- Chlo- Dry Crude Crude Water Total
Ash cium phorus C/P ride matter Prot. 1,ignin fiber Sol. CHO sugars (%> (%‘o> (%) ratio (%> (%> (%) (%> (%‘o> (%> (%> Bracted spiderwort
Skeletonplant Lambsquarters
Sunflower heads
Alfalfa standard
615
6/15 6/21 6129 716 7/15 7/20 7127 615 6/15 6/21 6129 716 7115 7120 7127 813 s/10 8117 7/15 7120 72 71 77 74 75 72 68 70 67 86 84 79 74 64 63 62 50 56 60 64 66 53 21.9 22.2 16.5 19.0 15.0 13.4 18.1 14.9 - 20.9 20.7 18.4 15.6 13.8 12.4 15.9 14.1 12.9 13.4 - - 2.63 2.46 2.35 2.48 2.52 2.48 2.66 3.08 1.42 2.43 2.24 2.05 1.75 1.49 1.14 1.45 1.57 1.02 1.26 1.95 - .52 .55 .43 .49 .50 .44 .37 .26 .38 .53 .48 .36 .37 .39 .32 .29 .30 .20 .31 .53 -5.1 : 1 4.5 : 1 5.5 : 1 5.1 : 1 5.0 : 1 5.6 : 1 7.2 : 1 11.8 : 1 3.7 : 1 4.6 : 1 4.7 : 1 5.7 : 1 4.7 : 1 3.8 : 1 3.6 : 1 5.0: 1 5.2 : 1 5.1 : 1 4.1 : 1 3.7 : 1
- .54 .45 .59 .38 .41 .27 .32 .45 .53 .29 .21 .I6 .18 .I3 .lO .15 .12 .I7 .17 .44 - 15.4 15.1 11.9 12.9 12.9 16.6 17.1 13.7 17.2 15.0 16.8 22.2 23.7 31.1 35.0 34.9 43.5 52.3 57.8 21.0 18.6 18.9 15.1 14.8 12.4 11.6 9.6 5.8 5.8 17.3 22.6 19.7 18.1 15.6 10.0 8.9 6.1 10.1 8.2 9.8 11.3 - 1.8 1.6 1.7 2.9 3.9 4.5 5.0 4.2 27.5 30.4 27.4 31.5 29.6 32.1 40.0 30.2 - - 8.5 6.0 3.7 7.4 10.7 20.7 17.1 23.7 23.5 17.2 14.1 13.2 16.8 22.2 25.9 32.2 31.2 35.1 36.6 28.5 - -
6.0 31.2
7.0 6.3 8.8 4.2 8.0 6.0 6.2 - - 8.8 7.9 14.4 11.2 12.5 7.7 7.1 7.4 8.8 12.6 11.8 14.4 1.4 1.1 2.4 2.4 2.4 1.1 1.2 - 1.1 1.2 1.1 1.8 2.0 2.5 1.2 1.1 1.3 3.4 4.8 4.4 5.8
- Indicates no analysis on the sample.
615 O/15 6121 6129 716 7115 7120 7127 812 8110 8117
FIG. 1. Percent of chemical constituents supplied by forbs in forage samples, 1965.
1.6 to 82.6yo of the dry matter during the summer grazing season (Fig. 1).
The principal forbs eaten during 1965 were lambsquarters and bracted spiderwort. Lambsquar- ters provided the major part of the chemical con- stituents provided by forbs in August.
Forbs supplied from 0.7 to 95.7oi’, of the calcium in the total esophageal forage samples with an average of 58.8% for the 1965 grazing season. Forbs also supplied from 0.6 to 95.4yo of the phosphorus in the esophageal forage samples with an average of 55.9% of the phosphorus for the grazing season. Fewer forbs were present in 1964 and fewer were eaten by the cattle.
LITERATURE CITED
BURZLAFF, D. 1966. The focal-point technique of vegeta- tion inventory. J. Range Manage. 19:222-223.
HOEHNE, 0. E. 1966. Cattle preference as related to chemical components of native range plants. Ph.D. The- sis, University of Nebraska. 137 p.
HOEHNE, 0. E., D. C. CLANTON, AND C. L. STREETER. 1967. Chemical changes in esophageal fistula samples caused by salivary contamination and sample preparation. J. Anim. Sci. 26: 628-63 1.
STREETER, C. L. 1966. Methods of estimating the digesti- bility and voluntary intake of range forage consumed by grazing cattle. Ph.D. Thesis, University of Nebraska. 150 p.
Factors Influencing
Halogeton Invasion of
Crested Wheatgrass Range
NEIL C. FRISCHKNECHT
Range Scientist, Forest Service, U.S.D.A.,
Intermountain Forest and Range Experiment Station, Ogden, Utah,
headquartered at Provo.
Highlight
Halogeton first infested the Benmore Experimental Area on heavily grazed “slick spots,” where soils contain more total soluble salts and greater amounts of exchangeable sodium than adjacent areas. Subsequently, halogeton pro- fusely invaded units heavily grazed (8OoJo utilization) in spring as well as other heavily grazed slick spots in lightly grazed (50 % ) and moderately grazed (65%) units. Heavy precipitation in the preceding July-September period and in May-June of the current year increases both abundance and vigor of halogeton. Occasional deferment from spring grazing or rest-rotation grazing is required to prevent inva- sion or to reduce abundance of halogeton, especially in slick-spot areas.
The poisonous weed halogeton (Halogeton glo- merutus) has been given more attention in recent years than most other range plants. Within about 15 years after its discovery near Wells, Nevada, in 1934 (Dayton, 195 l), this introduced annual had spread over vast areas of the salt-desert shrub and adjacent range types of the Intermountain region (Tisdale and Zappettini, 1953). It is found in at least eight western States (Robocker, 1959), and its spread continues in these States although much has been done toward curbing it.
Complete control of halogeton was considered impractical rather early by Stoddard, Holmgren, and Cook (1949). These and other writers (Stew- art, 1951; Stoddart et al., 195 1; Erickson et al., 195 1) stressed the importance of good range man- agement to reduce the spread of halogeton and prevent livestock losses. The wisdom of this philos- ophy has been confirmed by research on various phases of the problem, including chemical control. No chemical agent yet tested has been found to be 100% effective, mainly because of inherent quali- ties of the plant and its seeds (Robocker, 1959; Cronin, 1965).
One helpful practice is to seed adapted grasses such as fairway and crested wheatgrasses (Agro- pyron cristatum and A. desertorum) on depleted ranges that might otherwise be invaded by halo- geton (Hull and Holmgren, 1964; Cook, 1965). The present paper reports results of 12 years’ obser- vations on the invasion and spread of halogeton on
range seeded to these grasses at the Benmore Ex- perimental Area near Vernon, Utah. Intensity of grazing, season of grazing, soils, and precipitation were all studied. Although fairway and crested wheatgrasses are not adapted for seeding the driest areas where halogeton grows, the observations made at Benmore lead to conclusions that may be ap- plied to both seeded and native ranges.
Study Area and Methods
The Benmore Experimental Area lies in the higher, southern end of Rush Valley, Tooele County, Utah, at an elevation of 5,600 to 5,900 ft. Average annual precipitation is approximately 12 in. Halogeton probably entered this valley from the west in the middle or late 1940’s. Seed may have been carried to the area along roadways and livestock driveways that traverse the Onaqui Mountain Range from the west over Lookout and Johnston Passes about 10 and 25 mi, respectively, northwest of Benmore.
Halogeton was first found on the northern (lower) end of the experimental area in 1952. An attempt to eradicate the halogeton was at first con- sidered, but the decision was made to observe the plant’s spread under varied grazing conditions. The crested wheatg-rass stands were then 10 to 14 years old. When the halogeton observations were begun, grazing studies were in progress in the ex- perimental area; three intensities of spring grazing were underway on twenty-four loo-acre units. Four additional units were used for holding cattle. The experimental units were grazed from about April 20 to June 20 each year from 1948 to 1958 inclusive. In 1959, all units were rested from spring grazing, but they were grazed moderately that fall and again in the spring of 1960 in preparation for a new graz- ing study. In the new study, which began in 1961 and continued through 1964, the different units were grazed in one of six periods from April to December, except that in one treatment certain units were grazed in both early spring and early fall. Thus, the observations on halogeton reported here cover the period of two separate grazing studies.
Each year in early September, from 1952 through 1958, the distribution of halogeton in the experi- mental area was plotted on a map. Halogeton is most conspicuous at that time of year, and could be easily seen wherever spring grazing had removed much of the grass herbage. Mapping of halogeton was discontinued after 1958 because of difficulty in charting the areas in the ungrazed crested wheat- grass. When halogeton had become fairly abundant in 1956, plants were counted on 40 permanent lOO-ft2 plots in each of the 24 experimental units. Counts were repeated on the same plots in alternate years until and including 1964.
HALOGETON INVASION 9
Soil from areas supporting halogeton and from
nearby areas that had no halogeton was analyzed to changeable sodium were determined by standard determine salt content. Analysis for total soluble methods. Precipitation records were obtained from salts was by the bridge method; amounts of ex- storage gages on the experimental from recording gages during the summer periods area and also of high-intensity storms, July through September. Visual observations and photographs provided sup- plementary information.
FIc. 1. Benmore Experimental Area. Maximum overall distribution Of halogeton was probably reached in 1957 (unshaded areas). A reduction in
the total extent
is
noticeable in 1958 (shaded areas). Letters following unit numbers indicatewhether “nits were grazed lightly (L=5,yo,,
moderately (M = a%), or heavily (H = 80~o).
Intensity of grazing.--Intensity of spring grazing strongly influenced halogeton invasion of crested wheatgrass. Initially, in 1952, three plants of halo- geton were found on heavily grazed spots on the northwest corner of the experimental area in unit 28 (Fig. 1). The overall utilization of this unit was moderate, averaging about 65y0 of grass by weight. No halogeton was found in any of the other units. The following year a few plants were observed on other heavily grazed spots in two adjacent units -24, which was lightly grazed (50%), and 27, which was moderately grazed (650/,). By 1954, halogeton was growing in eight units on the north- ern end of the experimental range. An explosive increase in 1955 spread hatogeton to 20 units. When initial counts were made on permanent plots in 1956, 83% of all plants were in heavily grazed units, compared to 15% and 2% in mod- erately and lightly grazed units, respectively. Halo- geton was widespread over heavily grazed units, but was confined to heavily grazed spots in units grazed lightly and moderately (Fig. 2).
The general movement of halogeton from north to south was opposite to the direction of prevailing winds but was in the direction of intermittent winds. Undoubtedly animals and vehicles helped to spread seeds. Maximum spread of halogeton on the experimental area was reached in 1957, when plants appeared in 21 units (Fig. 1). Heaviest infes- tations were on the north portion of the experimen-
::.:. :.., ?.(
10 FRISCHKNECHT
Table 1. Frequency and density of halogeton on perma- nent plots1 in 1962 and 1964 according to season of grazing.
Unit Grazing no. season
Frequency2 1962 1964
Density3
1962 1964
19
22 28 26 23
Early spring 4/20-5120 + early fall
g/15-10/31 Late spring 5/20-6/20 All spring
4/20-6/20 Late summer
8/3-g/15 Early fall g/15-10/31
30.0 35.0 96 47
17.5 22.5 57 28
20.0 30.0 167 50
10.5 7.5 121 5
20.0 2.5 34 1
IForty permanent plots, each covering 100 ft2, were located in each of the 24 units, a total of 960 plots.
2 Frequency = Plots infested in percent of total. 3 Density = Plants per plot.
tal area-in heavily grazed units 19, 22, 23, and 26, and in moderately grazed unit 28. A few plants grew in heavily grazed unit 3 and in the moderately grazed unit 6 on the south end of the experimental area, but no plants have been found there since
1957.
Season of grazing.- Following 196 1, halogeton declined on units where spring grazing was changed to summer or fall grazing. In 1964, most halogeton was found in units where spring grazing had been continued. Thus, of the five units in which infesta- tion of halogeton had been heaviest until 1962, the two units (26 and 23) that were grazed in late summer and early fall under the new study con- tained relatively little halogeton in 1964 (Table 1). On the other hand, frequency of halogeton in- creased and the number of plants remained fairly high on three units (19, 22, and 28) grazed in spring. Field observations showed that most of the decline of halogeton under summer and fall graz- ing (units 23 and 26) occurred in 1963, but, of course, a plant count was not made until 1964. Since all units were grazed in the spring of 1960, this suggests that at least 2 years of deferment from heavy spring grazing were required for effective control of halogeton.
Soils and topography .-In the experimental area, halogeton invasion is related to topography and soils. Soils toward the south end, where halogeton is absent, consist of alluvial overburden on top of the older soils. The long, narrow areas occupied by halogeton (Fig. 1) on the older soils generally parallel channels in the drainage system. Except for patches near intermittent stream channels, most of the halogeton infestation is on the slightly higher ridge areas, which were more subject to sheet ero-
Table 2. Range in total soluble salts (in percent) by soil depth in absence or presence of halogeton.
Grass1 Soil depth
(inches) Min. Max.
0- 6 0.04 0.08
6-12 0.04 0.05
12-18 0.04 0.07
18-36 0.03 0.38
l Grass present, halogeton absent. 2Grass and halogeton present.
Grass and halogetong Min. Max.
0.08 0.65 0.23 0.71 0.82 1.50 0.44 1.50
sion and loss of topsoil prior to seeding than were the swale areas. Also, the ridges receive less mois- ture than most areas because wind blows some snow away from them.
Salt content of soil is important to halogeton oc- currence, as evident from data in Table 2. Soil samples from four heavily grazed areas in lightly grazed units where halogeton invaded contained much higher salt concentration for all depths sam- pled than did the soil on four adjacent areas (within 20 ft) where halogeton was absent. These areas appear similar to the so-called slick spots that can be found in cultivated fields throughout the West. This higher concentration of total soluble salts, but particularly the presence of sodium, cre- ates a soil structure that is unfavorable to growth of grass. Analysis of selected soil samples from the overall group showed up to 2.6 milliequivalents of exchangeable sodium in the O-6 inch depth and up to 7.9 me of exchangeable sodium in the 6-12 inch depth. In these areas a heavy clay subsoil begins near the 6-inch depth.
The slick spots invaded by halogeton show char- acteristically poor growth of perennials. Due to soil moisture retention, frost-heaving of grass plants is often pronounced on these patches in early spring, so that plants are more pedestaled than on sur- rounding areas. Wooden stakes driven 6 inches or more into the ground may be completely heaved out of the soil in some years. In early spring when soil moisture is abundant, cow tracks are deeper on the slick spots than on surrounding areas.
Although crested wheatgrass grows on slick areas, it was slow to become established. The plants are shorter lived, spaced farther apart, and grow less rank than on surrounding areas. Also, grass tends to dry earlier and regrowth is often very limited after early spring grazing. The grass herbage on these areas is usually grazed heavily by cattle at any period from April to December. Rabbits also pre- fer grass on these areas as observed in 1959 and at other times when cattle did not graze in the spring.
HALOGETON INVASION 11
Table 3. Relation of halogeton infestation of permanent plots to precipitation.
Plots Ave. no. Precipitation1 Year infested plants/plot (inches)
1956 54 51 5.09
1958 26 14 1.88
1960 42 55 2.79
1962 59 101 7.98
1964 53 72 5.66
IRecorded precipitation for July-September of preceding year plus precipitation for May-June of current year.
pepperweed (Lepidium perfoliatum). Of these, pepperweed has been the most consistent occupant. Within the last few years, bur buttercup (Ranun- culus testiculutus) is a newcomer on some of these areas. Like pepperweed, this plant utilizes early spring moisture and completes growth before the summer period of main halogeton growth.
Big sagebrush (Artemisia tridentutu) and rubber rabbitbrush (C hryso t humnus nuuseosus) invade slick areas in wet years, but growth is usually slow and plants are stunted and often short-lived. On these areas sagebrush roots are confined to shallow depths above the clayey subsoil, whereas rabbit- brush roots will penetrate it. On similar unseeded range outside the pastures, the most prominent plants on the slick spots are bud sagebrush (A. spinescens), which has a shallow root system, and gray molly (Kochiu americana).
Precipitation.-The abundance of halogeton
from year to year is highly dependent upon precipi- tation. Data in Table 3 were best correlated with precipitation for July through September of the preceding year plus May-June precipitation of the current year. The correlation coefficient was .91 for this precipitation with numbers of permanent plots that were infested by halogeton. The coeffi- cient for the same precipitation with numbers of halogeton plants per 100 ft2 of area was .92. Pre- cipitation during July through September would greatly influence the amount and quality of seed produced, whereas precipitation during the follow- ing May and June would influence seed germina- tion and seedling establishment. Cronin (1965) indicated that dry weather in the spring months is of critical importance for halogeton establishment.
The great increase of halogeton shown by the reconnaissance survey in 1955 is attributable to above-average July-through-September precipita- tion in 1954 (3.09 in.) followed by above-average May-June precipitation in 1955 (2.99 in.). Long- term averages for these periods are 2.59 and 1.99 in., respectively. High precipitation in one of these periods can compensate to some extent for relatively low precipitation in the other period. Thus, the abundant precipitation in May and June of 1957 (3.64 in.) tended to compensate for below-
average precipitation (0.91 in.) for the July- through-September period in 1956, so that halo- geton showed increased spread in 1957.
Reconnaissance surveys in 1958 showed a great decline from 1957 in the area occupied and the number of plants of halogeton (Fig. 1). The de- cline was reflected also in plant numbers between
1956 and 1958 (Table 3). Only 0.78 in. of precipi- tation was recorded for the three months July through September 1957, and only 1.10 in. fell during May and June 1958. Plant counts for the even years from 1956 to 1964 were highest in 1962, when there was an average of 110 plants per 100 ft2 on 59 of the 960 permanent plots (Table 3). Rela- tively high precipitation of 4.23 inches in July through September 1961, followed by 3.75 inches in May and June 1962, was the contributing factor.
Summary and Conclusions
Halogeton was first discovered on the experimen- tal crested wheatgrass range at Benmore, Utah, in
1952. By 1955, it had spread to 20 of the twenty- eight loo-acre experimental units, beyond which it has since spread very little. Although initial infes- tation of halogeton occurred on heavily grazed spots in moderately grazed units-the so-called slick spots-subsequent invasion, abundance, and per- sistence on crested wheatgrass range was influenced by four interrelated factors: (1) intensity of spring grazing, (2) season of grazing, (3) salts in soil, and (4) total precipitation during July-September of the previous year plus May-June precipitation in the current year. This total precipitation gave highest positive correlation with frequency and numbers of plants. Halogeton became most abun- dant and widespread on ranges grazed heavily (80%) in spring. On these areas where halogeton was abundant, at least 2 years’ deferred grazing (late summer or early fall) was required to effect substantial reduction of the weed. Halogeton per- sists on spring grazed ranges.
Even under seeding and light stocking, certain slick-spot areas are heavily grazed. These ecological niches are vulnerable to invasion by halogeton; their soils contain larger amounts of total soluble salts and more exchangeable sodium than sur- rounding areas. Such areas require occasional de- ferment from spring grazing to prevent halogeton invasion or to keep it light. Large populations of rabbits may hinder control of halogeton because they, too, often overgraze the competing plants on slick spots.
LITERATURE CITED
COOK, C. WAYNE. 1965. Grass seedling response to halo- geton competition. J. Range Manage. 18:317-321. CRONIN, EUGENE C. 1965. Ecological and physiological
factors influencing chemical control of Halogeton glom- eratus. U.S. Dep. Agr. Tech. Bull. 1325. 65 p.
12 FRISCHKNECHT
ERICKSON, L. C., E. W. TISDALE, H. L. MORTON, AND GEORGE ZAPPET~INI. 195 1. Halogeton, Intermountain range men- ace. Univ. of Idaho, Agr. Exp. Sta. Circ. 117. 3 p. HULL, A. C., JR., AND RALPH C. HOLMGREN. 1964. Seeding
southern Idaho rangelands. U.S. Forest Serv. Res. Pap. INT-10. 31 p.
ROBOCKER, W. C. 1959. Halogeton. In: Handbook of Chemical Control of Range Weeds. U.S. Dep. Agr., Dep. of Interior, Range Seeding Equip. Comm. (Revised Jan.
1959).
STEWART, GEORGE. 1951. Healthy ranges resist halogeton. Utah Farmer 71(1):3.
STODDART, L. A., A. H. HOLMGREN, AND C. W. COOK. 1949. Important poisonous plants of Utah. Utah Agr. Exp. Sta. Spec. Rep. 2. 21 p.
STODDART, L. A., HOWARD CLEGG, BEN S. MARKHAM, AND GEORGE STEWART. 1951. The halogeton problem on Utah’s ranges. J. Range Manage. 4:223-227.
TISDALE, E. W., AND GEORGE ZAPPE~TINI. 1953. Halogeton studies on Idaho ranges. J. Range Manage. 6:225-236.
Soil Moisture Response to
Spraying Big Sagebrush with 2,4-D
RONALD D. TABLER Hydrologist,
Rocky Mountain Forest and Range Experiment Station, Forest Service, U.S.D.A.,
Laramie, Wy0ming.l
Highlight
Spraying big sagebrush with 2,4-D reduced the rate of soil moisture withdrawal. About 75% of the difference in total moisture depletion occurred within the 3- to 6-ft soil depth; an opposite effect in the second foot indicated that the increase in grass herbage production is most strongly reflected in that zone. Total evapotranspiration losses from the 0- to 6-ft soil profile were reduced about 14% over the 4-month growing period the second year after spraying.
Much research has been oriented toward perfect- ing methods of sagebrush control and analyzing the effect of such treatment on forage production. Effects of sagebrush conversion on such factors as the soil moisture regime, snowpack, and microcli- mate, however, have not been given attention com- mensurate with their probable significance. Hy- drologic features of the big sagebrush (Artemisia tridentata Nutt.) community are for the most part unknown.
The primary objective of this study was to deter- mine the response of the soil moisture regime to spraying big sagebrush. Measurements were made over a period of 3 years following treatment as <grass production increased and subsequently dimin- ished. In this manner some insight was gained into the hydrologic significance of chemical control of big sagebrush.
Review of Previous Work
A study of herbage response to sagebrush spraying in Oregon indicated the greatest grass yield the first year after
lIn cooperation with the University of Wyoming; central headquarters maintained at Fort Collins in cooperation with Colorado State University.
spraying, with yields decreasing slightly the second and third years (Hyder and Sneva, 1956). Vegetative response was thought to result from a release from competition for both soil nitrogen and soil moisture. Competition changed at different soil moisture levels the first year after treat- ment, and depletion was more rapid on treated than on untreated areas.
Sonder (1959) studied effects of chemical control of big sagebrush on soil moisture retention and snow holding capacity in Wyoming. He concluded that 80% to 100% kill of big sagebrush in the Red Desert (elevation 7,000 ft, average annual precipitation 10 inches) significantly in- creased soil moisture one year after initial chemical control at the depths sampled (6-7, 12-13, and IS-19 in.). He implied that grass production had increased 100% after spraying. A second study area in the Big Horn Mountains (elevation 8,200 ft, average annual precipitation 20 in.) showed that, 6 years after 100% chemical sagebrush control, soil moisture was significantly higher in late July in the treated area. Native grass production was said to have increased over 400% as a result of spraying. Fall soil mois- ture levels were the same on treated as on unsprayed areas at both study sites. Spring snow depth on the unsprayed area in the Big Horn Mountains was less than on the treated area; in addition, snow disappeared more rapidly from the unsprayed area. No differences were observed between treatments in the Red Desert with regard to snow accumulation or disappearance.
Cook and Lewis (1963), in a study of competition between big sagebrush and seeded grasses in Utah, took paired soil moisture samples in sprayed and unsprayed areas at 12 sample locations during three consecutive summers follow- ing spraying. Depths of 1, 2, and 3 ft were sampled. They concluded that soil moisture content generally was signifi- cantly greater on sprayed plots at the 2- and 3-ft depths the first two growing seasons after spraying; in only one case was the difference significantly greater in the surface foot. In general, soil moisture differences between treatments increased with soil depth. No significant differences in soil moisture due to treatment were detected during the third year after spraying.
Methods
12 FRISCHKNECHT
ERICKSON, L. C., E. W. TISDALE, H. L. MORTON, AND GEORGE ZAPPET~INI. 195 1. Halogeton, Intermountain range men- ace. Univ. of Idaho, Agr. Exp. Sta. Circ. 117. 3 p. HULL, A. C., JR., AND RALPH C. HOLMGREN. 1964. Seeding
southern Idaho rangelands. U.S. Forest Serv. Res. Pap. INT-10. 31 p.
Ro~OoxEa, W. C. 1959. Halogeton. In: Handbook of Chemical Control of Range Weeds. U.S. Dep. Agr., Dep. of Interior, Range Seeding Equip. Comm. (Revised Jan.
1959).
STEWART, GEORGE. 1951. Healthy ranges resist halogeton. Utah Farmer 71(1):3.
STODDART, L. A., A. H. HOLMGREN, AND C. W. COOK. 1949. Important poisonous plants of Utah. Utah Agr. Exp. Sta. Spec. Rep. 2. 21 p.
STODDART, L. A., HOWARD CLEGG, BEN S. MARKHAM, AND GEORGE STEWART. 1951. The halogeton problem on Utah’s ranges. J. Range Manage. 4:223-227.
TISDALE, E. W., AND GEORGE ZAPPE~TINI. 1953. Halogeton studies on Idaho ranges. J. Range Manage. 6:225-236.
Soil Moisture Response to
Spraying Big Sagebrush with 2,4-D
RONALD D. TABLER
Hydrologist,
Rocky Mountain Forest and Range Experiment Station, Forest Service, U.S.D.A.,
Laramie, Wy0ming.l
Highlight
Spraying big sagebrush with 2,4-D reduced the rate of soil moisture withdrawal. About 75% of the difference in total moisture depletion occurred within the 3- to 6-ft soil
dt=nthr -vr”-, sn nnnnaite --_ ‘TT’““w pffm-t __^_ ws a__ ..a_ .,lI1-^ - _--_ in thP nmmnd fnnt indicated --- - t_hbt
the increase in grass herbage production is most strongly reflected in that zone. Total evapotranspiration losses from the 0- to 6-ft soil profile were reduced about 14% over the 4-month growing period the second year after spraying.
Much research has been oriented toward perfect- .
1-m -,eLc.cl, #xc “.-.e..-.Lv-3.c.L. K.r\n+rr\l
1115 ll1cLlluu3 UL 3a~clJlu311 LUllLlUl and amkfzmg
the effect of such treatment on forage production. Effects of sagebrush conversion on such factors
as
the soil moisture regime, snowpack, and microcli- mate, however, have not been given attention com- mensurate with their probable significance. Hy- drolo~ir fyL FPatllrPc LLcaLULL.3 “1 nf the birr Sacwhrllch LLIL /ArtPmiGn.bLU’ -uL* \“’ ““‘sY”“Y- tridentata Nutt.) commun?ty are for the most part unknown.
The primary objective of this study was to deter- mine the response of the soil moisture regime to spraying big sagebrush. Measurements were made over a period of 3 years following treatment as <grass production increased and subsequently dimin- ished. In this manner some insight was gained into the hydrologic significance of chemical control of big sagebrush.
Review of Previous Work
A study of herbage response to sagebrush spraying in Oregon indicated the greatest grass yield the first year after
lIn cooperation with the University of Wyoming; central headquarters maintained at Fort Collins in cooperation with Colorado State University.
spraying, with yields decreasing slightly the second and third years (Hyder and Sneva, 1956). Vegetative response was thought to result from a release from competition for both soil nitrogen and soil moisture. Competition changed at different soil moisture levels the first year after treat- -^-L ,-_^1 _1_._1_.:_._
menu, dnu ueprerion was more rapid on treated than on untreated areas.
Sonder (1959) studied effects of chemical control of big sagebrush on soil moisture retention and snow holding capacity in Wyoming. He concluded that 80% to 100% kill of big sagebrush in the Red Desert (elevation 7,000 ft, average annual precipitation 10 inches) significantly in- creased soil moisture one year after initial chemical control at the depths sampled (6-7, 12-13, and IS-19 in.). He implied that grass production had increased 100% after spraying. A second study area in the Big Horn Mountains (elevation 8,200 ft, average annual precipitation 20 in.) -L?._..,_l LL_L c __^--- _ rL -__ 1 #l*fl _l-.--1--l _,__I---_l_ ____,--1 buuwcu uki~, v year-s dner IUU/O cnemicar sdgeurusn COIILI-01,
soil moisture was significantly higher in late July in the treated area. Native grass production was said to have increased over 400% as a result of spraying. Fall soil mois- ture levels were the same on treated as on unsprayed areas at both study sites. Spring snow depth on the unsprayed area in the Big Horn Mountains was less than on the treated area; in addition, snow disappeared more rapidly from the unsprayed area. No differences were observed between treatments in the Red Desert with regard to snow accumulation or disappearance.
Cook and Lewis (1963), in a study of competition between big sagebrush and seeded grasses in Utah, took paired soil moisture samples in sprayed and unsprayed areas at 12 sample locations during three consecutive summers follow- ing spraying. Depths of 1, 2, and 3 ft were sampled. They concluded that soil moisture content generally was signifi- cantly greater on sprayed plots at the 2- and 3-ft depths the first two growing seasons after spraying; in only one case was the difference significantly greater in the surface foot. In general, soil moisture differences between treatments increased with soil depth. No significant differences in soil moisture due to treatment were detected during the third year after spraying.
Methods
SOIL MOISTURE
RESPONSE
13
FIG. 1. Winter equipment.
soil moisture measurements with neutron-probe
The sagebrush stand in the vicinity of the study has a density of about 10,000 mature plants/acre, and a dominant age class of 25-35 years. Average height of the sagebrush plants is about 20 inches, and average crown area is about 1.4 ft2. Idaho fescue (Festuca iduhoensis Elmer), the domi- nant grass species, accounts for nearly 25% of total herbage production. Major forbs include Lupinus cericeus Pursh, Geum triflorum Pursh, and Agoseris glaucu (Pursh) D. Dietr.
Plot Layout.-Four contiguous 0.4-acre plots, each 2 chains on a side, were laid out in a single row on each side of a gentle ridge (slope about 10%). East and west exposures were represented in the study to permit evaluation of a treatment-exposure interaction, since prevailing westerly winds favor snow accumulation on east-facing slopes.
Boundary effect was minimized by confining the sampling area to a O.l-acre area in the center of each plot, thus pro- viding a perimeter buffer strip 33 ft wide around each sam- pling area.
The plots were established in June 1960, and pretreat- ment data were collected until July 1961, at which time half the plots were selected at random and hand-sprayed with 2,4-D (Esteron 76-E, Dow Chemical Corporation) 2 in water at a rate of about 3 lb acid equivalent/acre. Posttreatment measurements were continued until September 1964. Sig-
2Trade names and company names are used for the benefit of the reader and do not imply endorsement or preferential treatment by the U.S. Department of Agriculture.
; 800-
iLl 3
z n 600- oz z
4 w 400- 7
5 a 200-
I5 I
0
FIG. 2.
m OTHER FORBS
LUPINE m OTHER GRASSES m BLUEGRASSES 0 IDAHO FESCUE
-1000
-800
-600
1960 1961 1962 1963 1964
+---AFTER SPRAYING ---+I
Herbage production on control and sprayed plots.
nificant mortality of sagebrush attributable to stem girdling by rodents during the 1963-64 winter forced the close of the study.
Measurements.-Gravimetric soil moisture samples were taken initially at six locations selected at random on each sampling area at Z- to S-week intervals during the growing season (June 1 to September 30). King (Veihmeyer) tubes were used to obtain these samples, which were taken to depths of 6 ft where possible. In 1961, sampling intensity was increased to 9 samples/plot. Bulk density samples from three locations permitted estimation of soil moisture content by volume.
In June 1962, six aluminum access tubes for neutron probe measurements were installed at locations selected at random on each of the eight plots. All tubes were installed to 8 ft on the west exposure, but stony soil on the east- facing plots restricted some depths to 6 ft. Back-fill around tubes was allowed to settle and equilibrate for 2 months prior to the first probe measurements.
In addition to growing-season measurements, soil moisture content was determined throughout the 1963-64 winter and the following spring (Fig. 1).
Summer precipitation was measured by a standard rain gage with the orifice at ground level, and snowfall was measured by an accumulation gage near the study plots. Snow depth and water equivalent were determined with a Mount Rose snow sampler on about three dates each spring.


![5 (1,3 Dithiolo[4,5 d][1,3]dithiol 2 ylidene) 1,3 dithiolo[4,5 c][1,2,5]thiadiazole: an unsymmetrical tetrathiafulvalene with fused 1,2,5 thiadiazole and 1,3 dithiole rings](data:image/gif;base64,R0lGODlhAQABAIAAAP///wAAACH5BAEAAAAALAAAAAABAAEAAAICRAEAOw==)