The NA62 experiment at CERN
Mauro Piccini1,a
1INFN - Sezione di Perugia
Abstract. The rare decaysK→πνν¯are excellent processes to make tests of new physics at the highest scale complementary to LHC thanks to their theoretically cleanness. The NA62 experiment at CERN SPS aims to collect of the order of 100 events in two years of data taking for the decayK+→π+νν¯, keeping the background at the level of 10%. Part of the experimental apparatus has been commissioned during a technical run in 2012. The diverse and innovative experimental techniques will be explained and some preliminary results obtained during the 2014 pilot run will be reviewed.
1 Introduction
NA62 is the last generation kaon experiment at CERN SPS aiming to study the decayK+ → π+νν¯. The goal of the experiment is to measure the decay branching ratio (O(10−10)) with 10% accuracy,
collecting about 100 events in two years of data taking and assuming a 10% signal acceptance. The proton beam extracted from the SPS in the north area at CERN fulfills such demanding request in
aOn behalf of the NA62 Collaboration: G. Aglieri Rinella, R. Aliberti, F. Ambrosino, B. Angelucci, A. Antonelli,
terms of intensity. The NA62 detector must be able to reject background events from decay channels with branching ratios up to 10 orders of magnitude higher than the signal and with similar experimen-tal signature, such asK+ → μ+ν. To this purpose, good kinematic rejection, particle identification (PID) and veto systems are required. The required resolution on the measurement of kinematic pa-rameters (momenta, missing mass) is obtained tracking both the decaying kaon with a silicon pixel detector (GTK) and the parent charged particles with a straw spectrometer. The key elements of the PID in NA62 are: a differential Cherenkov detector (KTAG) to identify kaons in the charged beam, a Ring Imaging Cherenkov detector (RICH) to identifyπ+andμ+in the momentum range between 15 and 35 GeV/c and three scintillators detector acting as hadron calorimeters and muon counters at the end of the detector region. Veto systems working at different angles with respect to the beam direction, especially to suppress background coming from kaon decays with photons in the final state, complete the experimental setup: Large Photon Vetos (LAV) made by lead glass ad large angle, a Liquid Krypton calorimeter (LKr) at intermediate angles and two shashlik detectors at small angles. The detectors have to stand a rate of about 10 MHz of events, high performances read-out and trigger systems have been developed for this purpose. High resolution on time measurement is also required in order to reduce background produced by event overlaps. In the following sections, after a short theoretical introduction, a review of the detectors and of the results obtained during the 2014 pilot run will be presented.
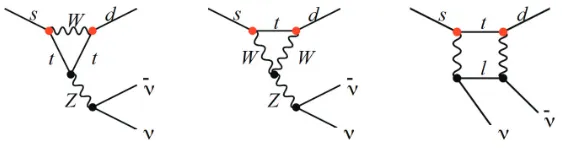
Figure 1.Z-penguin diagrams and box diagram contributing to the processK→πνν¯.
2 Theoretical framework and experimental status of the art
The decayK → νν¯ are flavor-changing neutral current (FCNC) processes that probe thes→ dnuν¯ transition via the Z-penguin and the box diagram shown in Figure 1. They are highly GIM suppressed and their Standard Model (SM) rates are very small. For the reasons listed below the SM calculation for their branching ratios (BRs) is particularly clean [2]:
- The loop amplitudes are dominated by the top-quark contributions. The neutral decay violates CP; its amplitude involves the top-quark contribution only. Small corrections to the amplitudes from the lighter quarks come into play for the charged channel.
- The hadronic matrix element for these decays can be factorized and obtained from the precise experimental measurement of theK→πeν(Ke3) rate.
- There are no long-distance contributions from processes with intermediate photons.
In the SM, BR(KL→π0νν¯)=(2.43±0.39±0.06)×10−11and BR(K+→π+νν¯)=(7.81±0.75±0.29)×
the SM rates are small and predicted very precisely, the BRs for these decays are sensitive probes for new physics. In evaluating the rates for the FCNC kaon decays, the different terms of the operator product expansion are differently sensitive to modifications from a given new-physics scenario. If BR(KL→π0νν¯) and BR(K+→π+νν¯) are ultimately both measured, and one or both BRs is found to
differ from its SM value, it may be possible to characterize the physical mechanism involved [3], e.g., a mechanism with minimal flavor violation [4], manifestations of supersymmetry [5], a fourth gener-ation of fermions [6], Higgs compositeness as in the littlest Higgs model [7], or an extra-dimensional mechanism such as in the Randall-Sundrum model [8]. The most precise experimental result for the BR(K+→π+νν¯) has been obtained by the dedicated experiments E787 and E949 at the Brookhaven National Laboratory [9] and is based on a total of 7 events using a decay-at-rest technique; the com-bined measurement is BR(K+→π+νν¯)=(17.3±11.5)×10−11. For the neutral channel only an upper
limit for the BR has been measured [10], BR(K0 →π0νν¯)<2.6×10⁻⁸at 90% confidence level.
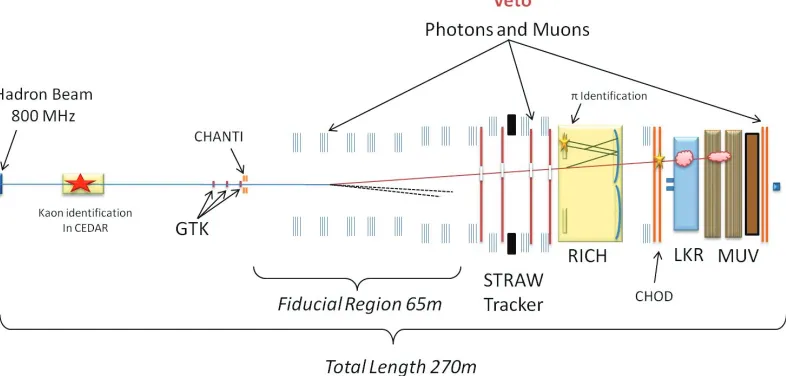
Figure 2. Schematic view of the NA62 experiment showing the main sub-detectors (not to scale). The main elements for the det ection of theK+decay products are located along a 170 m long region starting about∼100 m downstream of the beryllium target. UsefulK+decays will be detected within a 65 m long fiducial decay region.
3 The NA62 detector
NA62 uses a decay-in-flight technique, differently from the kaon decay at rest approach which was at the basis of the previous experiments.
• High intensity and good timing: a high intensity kaon beam is essential in order to reach sensitivity to a branching ratio of∼10−10. The incoming secondary beam from the SPS provides a particle rate of 750 MHz, containing about 6% of kaons delivering roughly 45·106decays in the fiducial region per spill. Precise timing (in the range 100 - 150 ps) of theK+and theπ+allows precise matching of the particles in the decay. The time resolution is essential to keep wrong associations below 1%.
• Low-mass tracking: track position and momenta have to be measured with high accuracy in low mass detectors. They are essential because inelastic scattering of beam particles in the detector material can produced an isolatedπ+appearing like a signal event and hence contributing to the background.
• Hermetic vetoing for photons and muons: the kinematic rejection must be accompanied by direct vetoing for photons (in particular for theK+ → π+π0background) requiring a typical inefficiency
of 10−4for high energetic photons. About two third ofK+decays contain muons in the final state, therefore a muon veto system is mandatory both in the trigger and off-line.
• Particle ID: several detectors must complement the event information with direct evidence on the particle species.
The experimental setup, shown in Figure 2, consists of a 100 m long beam line to select the appropriate secondary beam component produced by protons from the SPS CERN accelerator, followed by a 80 m long evacuated volume which defines the decay region. Along the beam line, different detectors are distributed as listed below.
3.1 Differential Cherenkov counter (KTAG)
The KTAG identifies theK+component in the beam with respect to the other beam particles by em-ploying an upgraded differential Cherenkov counter (CEDAR). The CEDAR filled with nitrogen gas is placed in the incoming beam to positively identify the kaon component in the high rate environment. It is designed to identify particles of a specific mass by making the detector blind to the Cherenkov light produced by particles of different mass. The KTAG upgrade of NA62 acts in the Cherenkov light detection stage: to cope with the expected 45 MHz kaon rate, 384 photomultipliers (PMTs) grouped in 8 light boxes are placed behind the 8 annular slits. A preliminary analysis of 2014 data shows a kaon-identification efficiency better than 95% and a time resolution below 100 ps.
3.2 Beam tracker (GTK)
The GigaTracker (GTK) comprises three stations measuring time, direction and momentum of the beam particles before entering the decay region. The three stations are placed along the beam line just before the fiducial region. Each GTK station is a hybrid silicon micro-pixel detector with a total number of 18000 300×300μm2pixels grouped in 10 read-out chips. The expected performances on
the track measurement are a 0.4% resolution for the momentum, 16 mrad for the direction and 200 ps for the timing. One chip per station has been commissioned during the 2014 run.
3.3 Guard-Ring detector (CHANTI)
3.4 Pion spectrometer (STRAW)
The STRAW Tracker measures the coordinates and momentum of secondary charged particles orig-inating from the decay region. To minimise multiple scattering the chambers are built of ultra-light material and are installed inside the vacuum tank. Two straw chambers are located on each side of a large aperture dipole magnet, providing a vertical B-field of 0.36 T. Each chamber is equipped with 1792 straw tubes which are arranged in four “views” providing measurements of four coordinates x, y,u, v. The requirements for the detector performances are a relative momentum resolution of 1%, a spatial resolution of 130μm per coordinate and a very low track reconstruction inefficiency. The detector has been fully commissioned during the 2014 run.
3.5 Pion Timing (CHOD)
The CHOD is a Charged-particle HODoscope (inherited from NA48) to detect tracks with precise measurements of the arrival time and impact point, able to provide a fast signal used to drive the trigger. It is composed of two planes made of 64 plastic scintillators, one with vertical and one with horizontal slabs. The CHOD can provide the timing of charged decay products with a resolution of about 220 ps.
3.6 Ring image Cherenkov detector (RICH)
The RICH detector is placed downstream of the last straw chamber. It consists of a 17.5 m long cylindrical vessel with a diameter varying from 3.4 to 4 m filled with neon at atmospheric pressure and room temperature. An aluminum beam pipe spanning the length of the RICH keeps non-decayed beam particles in vacuum. The Cherenkov light is reflected by a mosaic of 18 hexagonal and 2 semi-hexagonal (close to the beam pipe) mirrors with 17 m focal length, made of 2.5 cm thick glass. They are placed at the downstream end of the vessel and they cover a total surface of about 3 m diameter. The reflected light is collected by 2×960 photomultiplier tubes (PMTs) with 18 mm diameter size and suitable quantum efficiency and timing performances. The PMTs are assembled in a compact hexagonal packing into two aluminum disks placed at the entrance window. Winston cones carved into the disks and covered with aluminized mylar are used to convey the light onto the active PMT area, thus increasing light collection. Quartz windows are used to separate the PMTs from the neon in order to avoid electrical discharges at the working voltage (900 V). The mirror segments are individually hanged on a light aluminum honeycomb structure and moved by means of two piezo-motors each, in order to align the light toward the two PMTs disks. The RICH allows an additional rejection of the muon background. The requestedμsuppression factor is 10−2 between 15 and 35 GeV/c (the momentum range of interest), and a time resolution of 70 ps has been already measured during the 2014 run.
3.7 Large-Angle Photon Vetoes (LAV)
3.8 Small-Angle Photon Vetoes (IRC and SAC)
A Small Angle Calorimeter (SAC) and an Intermediate Ring Calorimeter (IRC) give photon cover-age below 1 mrad. Both detectors are made of consecutive lead and plastic scintillator plates. The inefficiency for 1 GeV photons is below 10−4. A time resolution of 3 ns was measured in the 2014
run.
3.9 Quasi-homogeneous liquid kripton calorimeter (LKr)
The LKr Calorimeter (inherited from NA48) measures precisely the electro-magnetic energy with the possibility to discriminate between positrons and pions using their shower properties. It covers intermediate angle between 1 and 8.5 mrad. It is divided in 13248 cells and the electromagnetic showers are fully detected through ionisation of low energy charged particles. The reconstructed shower time resolution is 500 ps, and the space resolution of the order of 1 mm; the total inefficiency for 10 GeV photons is below 10−5. The new readout has been validated during the 2014 run.
3.10 Hadron and muon detectors (MUV)
NA62 uses a fast scintillator (MUV3) for direct muon vetoing and 2 sampling hadron calorimeters (MUV1+2) which measure the deposited hadron energy in the event, distinguishing hadron showers from muons. MUV1 and MUV2 modules are iron-scintillator sandwich calorimeters with scintillator strips alternately oriented in the horizontal and vertical directions. This system supplements and provides redundancy with respect to the RICH in the detection and rejection of muons. Only one of these was installed in 2014. The MUV3 is a vertical array of fast scintillator tiles placed after an iron wall and is used to detect non-showering muons. Each tile is read by 2 PMTs to avoid the effect of Cherenkov photons on time resolution. Data from the 2014 run show a time resolution below 500 ps.
3.11 Trigger and data acquisition
The experiment makes use of an integrated trigger and data acquisition system with three trigger levels. The lowest level, level 0, is implemented directly in the digital readout card for each detector subsystem. The detector hits are resolved into quantities that are used in trigger logic to decide which events will be read out for level 1. Level 0 will process about 10 MHz of detector hits; about 1 MHz of events will be sent to level 1. The level 1 trigger is implemented in software. It is the first asynchronous trigger level and will reduce the rate of events seen by level 2 by an order of magnitude applying specific requests on the data collected by each detector. The level 2 trigger is implemented in the event builder running on the acquisition PC farm; it is the first trigger level which makes use of the full event information. The O(100 kHz) of events input to level 2 are reduced to a few kHz of events ultimately written to disk.
4 Analysis strategy
NA62 detectors are designed to measure theK+and the secondary particles from kaon decays occur-ring in the decay volume. The signature of the signal is one track in the final state matched with one K+track in the beam. The measurable quantities arepK+(the kaon momentum-vector),pπ+(the pion
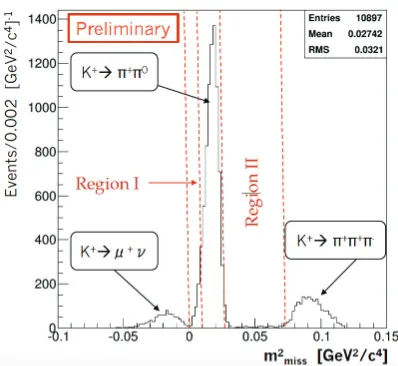
Figure 3.Left: Distribution ofm2
missfor the main kaon decays and the signal, with the hypothesis that the charged decay product is a pion. The two signal regions, [0,0.01]GeV2/c4 and [0.026,0.068]GeV2/c4, are indicated.
Right: Distribution ofm2
missfor the signal and the main background sources after kinematic cuts.
The main kinematic variable to discriminate the signal from the overwhelming background is the squared missing massm2
miss. It is defined for the events, when only one charged track from Kaon
decay is detected assuming the track belongs to a charged pion:
m2
miss=(pK+−pπ+). (1)
Figure 3 (left) shows them2
missdistribution in log scale for the main decay channels and theK+→ π+νν¯decay (red curve). The signal decay differential width is magnified by 1010. Two signal regions
(I and II), on each side of theK+ → π+π0 peak, are chosen, where more than 90% of the mainK+
decays do not contribute. The kinematics background suppression is of the order of 105. The further
suppression of background at the order of 107is done by means of the detector related cuts (timing,
particle identification, muon and photon veto).
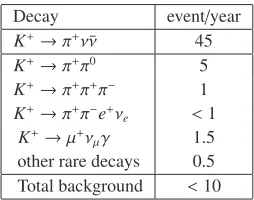
Decay event/year
K+→π+νν¯ 45
K+→π+π0 5
K+→π+π+π− 1
K+→π+π−e+νe <1
K+→μ+νμγ 1.5 other rare decays 0.5 Total background <10
Table 1 shows the expected number of signal and background events per year of data taking es-timated from MC simulation. Given this expectation, NA62 will be able to reach a 10% precision in a measurement ofBR(K+ → π+νν¯). The main background remains theK+ → π+π0(γ) decay,
where two photons fromπ0 decay are not detected and the signal event topology is mimicked. To
is 108. The second important background comes from theK+→μ+νμ(γ) decay. The designed overall suppression factor for muons is of the order of 105.
In the analysis, theπ+ momentum will be required to be less than 35 GeV/c. In this way, the momentum of theπ0amounts to at least 40 GeV/c. Such a large energy deposit can hardly be missed in the calorimeters. In addition only events with theK+vertex reconstructed in the fiducial volume are selected. Them2
missdistribution for signal and the three main background sources after the kinematic
cuts is shown in Figure 3 (right).
5 2014 pilot run
Data recorded during the pilot run in 2014 are very successfully used to understand the performance of the NA62 sub-detectors. However, only a small part of it was recorded with stable run conditions and is useful for preliminary physics studies. The beam intensity was 5% of the nominal one and two triggers have been used to collect a minimum bias sample and aπνν¯-like without photon rejection sample. Only about 1% of the available data have been studied. The experiment was at a preliminary stage: data were not yet readout from GTK and the analysis used the mean nominal direction and momentum of the kaon beam; LAV information was not yet used for photon veto; only preliminary detector time alignment and energy calibration were used.
Figure 4. Angle between the reconstructed track and the nominal kaon direction as a function of particle mo-mentum [GeV/c] in 2014 data (left) and as expected from pure kinematics (right).
The distribution of the angle between the kaon and the secondary track as a function of the track momentum is shown in Figure 4 (left), for events with only 1 track in the spectrometer and after requiring the presence of a kaon in the KTAG. A reasonable agreement can be observed if compared with the expectations for the main kaon decays (right): the suppression of theK+→μ+νcomponent is due to the muon rejection at trigger level. The intersection between the track and the nominal beam direction is used to reconstruct the vertex and suppresses the background from kaon interactions.
Figure 5.them2
missdistribution after the signal event selection. Two regions for the final selection of signal events are indicated by the vertical red-dashed lines. The kaon decays contributing to the distribution are indicated.
system. The muon background suppression is expected to be improved during the 2015 physics run with the help of MUV1. The three-track background, mainly coming from theK+→ π+π+π−decay is also well suppressed and does not contribute to the signal selected region. The main background contribution comes from theK+ → π+π0decay. This particular background dominates in the signal
region after the final selection, especially in region I. LAV information is not yet exploited both at trigger level and analysis level, preventing an additional suppression ofK+ →π+π0while the use of
mean beam momentum and direction, instead of event by event GTK information, worsens them2 miss
resolution.
References
[1] na62.web.cern.ch/na62/Documents/TechnicalDesign.html, 2010. [2] J. Brod, M. Gorbahn and E. Stamou, Phys. Rev. D 83, 034030 (2011). [3] D. M. Straub, arXiv:1012.3893 [hep-ph].
[4] T. Hurth, G. Isidori, J. F. Kamenik and F. Mescia, Nucl. Phys. B 808, 326 (2009). [5] G. Isidori, F. Mescia, P. Paradisi, C. Smith and S. Trine, JHEP 0608, 064 (2006).
[6] A. J. Buras, B. Duling, T. Feldmann, T. Heidsieck and C. Promberger, JHEP 1009, 104 (2010). [7] M. Blanke, A. J. Buras, B. Duling, S. Recksiegel and C. Tarantino, Acta Phys. Polon. B 41, 657
(2010) [arXiv:0906.5454 [hep-ph]].
[8] M. Blanke, A. J. Buras, B. Duling, K. Gemmler and S. Gori, JHEP 0903, 108 (2009) [arXiv:0812.3803 [hep-ph]].
![Figure 4. Angle between the reconstructed track and the nominal kaon direction as a function of particle mo-mentum [GeV /c] in 2014 data (left) and as expected from pure kinematics (right).](https://thumb-us.123doks.com/thumbv2/123dok_us/8154751.1360149/8.482.46.440.319.490/figure-reconstructed-nominal-direction-function-particle-expected-kinematics.webp)