Available Online atwww.ijcsmc.com
International Journal of Computer Science and Mobile Computing
A Monthly Journal of Computer Science and Information Technology
ISSN 2320–088X
IMPACT FACTOR: 5.258
IJCSMC, Vol. 5, Issue. 6, June 2016, pg.589 – 600
Emotion Classification Using Machine
Learning and Data Preprocessing
Approach on Tulu Speech Data
Ronnie Merin George
1, Dr. Jose Alex Mathew
2¹Computer Science and Engineering, SCEM, Mangaluru, VTU, India
²Professor & Head, Electronics and Communication Engineering, SCEM, Mangaluru, VTU, India
1
[email protected]; 2 [email protected]
Abstract— Automatic speech emotion detection is an important concern as computers have become an
integral part of our lives. There is an increasing need to develop machines with enhanced natural
human-machine interactions. To achieve this goal, a computer would have to be able to perceive human's present
situation and respond differently depending on that perception. The human-computer interaction will become more natural, if the computers have the ability to recognize emotional situations in the same way as
human does. This project proposes a system which classifies speech emotion using a Machine Learning
techniques. The data set used for training and classification is a set of voice samples recorded in the Tulu
language. The emotions used for classification are happy, anger, neutral and sad. A comparative study of
classifiers like Perceptron, Logistic Regression, Decision Tree Classifier, Random Forest Classifier,
K-neighbors Classifier is also performed.
Keywords— Speech Processing, MFCC, SVM, Machine Learning
I. INTRODUCTION
Speech provides human beings with a way to express their ideas and emotions among themselves. As far as the
present situations and technologies are concerned, the humans have to interact with even machine to get their
work done. The main problem arises when a human interact with a computer is that the computer is unable to
do not have the capabilities for determining the emotions in input voice samples. Emotions are influencing the
actual meaning of speech signals. Most of the times, the meaning of the sentence will be changed based on the
emotions. If the machines or computers can detect the emotion of the speaker, then the interactions will become
more natural. Human beings acquire speaking skills in their early childhood only. It is a quite natural process.
But the complexities involved in speaking is much. The speech is affected by various factors. The biological
organs which helps humans in speaking are vocal tract and articulatory organs. The nonlinear properties of
these organs affect speech to a great extent. The gender also affect speech. The meaning of same speech can
vary based on the emotional state of a person. Upbringing can also affect speech to an extent. The quality of
speech received by the receiver will get affected by many factors like background noise and echoes. In order to
transmit speech , telephones or other electrical equipment are required. These equipments can introduce some
noise into the speech which in turn result in misrepresentation of the speech signal. As there are many factors
which can misrepresent the speech signal, speech processing becomes a difficult task.
But analysis of speech is very essential in many application areas especially in the computer applications in
which the humans are interacting with computers or machines through speech. The computers have to recognise
the speech signals and have to understand the instructions or content in the speech and has to process the input
accordingly. In those applications the computers should be able to understand the content of speech and also it
should be able to capture the emotions of speech. The emotion of human beings can be easily recognized
through facial expressions or through speech. By detecting the emotions in speech samples the emotional state
of a person can be identified optimally. Emotions are a crucial part of human interaction and play a major role in
day to day communication. The need to develop machines with improved understanding of the user and his state
that is, to develop a more natural human-machine interaction is gaining more importance nowadays.
Speech emotion detection is the most fast growing research area .The computers are capable of identifying the
speaker and also the content of his speech. If the system can detect also the emotion of user ,then the system will
become more interactive. The understanding of the user and his state helps in developing a more natural
interactive human-machine systems. The recognition of human emotions can be utilized to provide a better and more natural reaction to the user‟s problems. The classified emotions can be used to study the mental conditions
of human beings and to develop gadgets and toys which requires human interactions. Highly efficient lie
detectors can be implemented by incorporating the emotion classification technique into it. The setting up of
Smart Customer Care Centres is also possible by identifying the emotion of customer.
In this project, an emotion classification system is implemented using a SVM classifier .The SVM is a
supervised machine learning system. The SVM gives more accurate outputs than other classifiers. SVM
performs both classification and regression. The data set used for training and classification is a set of voice
samples recorded in the Tulu language. The system performs classification of emotions like happy, angry, sad.
In the first step the voice samples are taken for the purpose of training where the features like MFCC, short-term
energy, mid-term energy, pitch, zero crossing rate etc are extracted from the voice samples. It is very easy to
calculate mel frequency scale. Because of the simple methods involved in calculating mel frequency scale, this
emotion. Then the system will be trained using the labelled voice samples. After this is done, the system will be
tested using samples which are used for testing purposes .The classifier outputs classification model and using
the data in classification model it is possible to calculate accuracy and precision of the classifier. Based on the
values of accuracy and precision ,the reliability of the classification model can be estimated.
In this project, a comparative study of different classifier has been done to identify the classifier which suits best
for classifying the emotions in Tulu Language. A comparative study of six different classifiers namely,
Perceptron, Logistic Regression, Decision Tree Classifier, Random Forest Classifier, SVM, K-Neighbors
Classifier has been performed.
II. PREVIOUSWORK
The following works were carried out by specific persons in the field of emotion classification of speech signal:
Lijiang Chen et al., [1] have published a paper on speaker independent speech emotion recognition. They have
used a three-level approach to classify six basic speech emotions including happiness, sadness, anger, surprise,
fear and neutral. In their method they have extracted features from 288 candidates for each level by using Fisher
rate. These extracted features were also regarded as input parameter for SVM. For evaluating the proposed
system, dimension reduction is performed using PCA and classification is performed using artificial neural
network. The PCA and ANN has been selected to conduct four comparative experiments. In the first case a
Fisher was used and was followed by SVM, in the second case a PCA was used and was followed by SVM, in
the third case Fisher followed by ANN and in the last case PCA followed by ANN. From the experiments they
have concluded that for dimension reduction Fisher approach is better than PCA and SVM is more accurate
than ANN for speaker independent speech emotion detection.
Vaishali M. Chavan et al., [2] proposed a paper on the design of a speech emotion recognition system using
SVM classifier. They have taken speech samples from the Berlin database as the input. The features such as
MFCC, fluctuation and periodicity histogram were extracted and these features were stored in the database with
assigned labels. Those labels are then taken for training SVM classifier. The trained SVM classifier classifies
the emotions as per the user request. The accuracy was more in multi-class SVM than in simple SVM. This
project has minimum testability i.e., it requires a more time for testing. The testability issue is the disadvantage
of the method mentioned in this paper.
Bhoomika Panda et al., [3] presented a paper on speech emotion detection. In this paper the data input is
transformed fully into high dimensional features by using kernel function and classifies the transformed
samples. In their paper, SVM classifier is used for classification and for regression purpose. The classifier labels
the margin from all the possible hyper planes. Many functions were used to classify the SVM such as linear,
Radial Basis Function, polynomial, Fourier etc. The variations were shown whenever the emotion changed.
M. JayaLakshmi et al .,[4] proposed a paper in which they have takensimulated emotional expressions as the
input. Multiple emotions were represented in the multidimensional space. Extra features like ZCR, and Short
SVM classifier the samples efficiency should be higher. Negative and positive emotions can be easily detected.
Increasing the features can decrease recognition efficiency.
III.SYSTEM ARCHITECTURE
III.I Architecture diagram
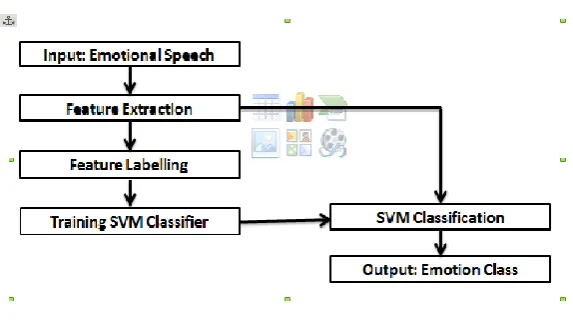
Fig 1 Architectural Diagram
The architectural diagram consists of two separate work flows. One work flow is for training the classifier and
the other one for prediction. In the case of training, the first step is to read the speech signal from the input file.
The input file is saved in .arff format. After reading the input speech signal, the analog input signal will be
converted to digital signal. Then the digitized input is given to the feature extraction block. In that block the
speech signal is segmented into overlapping short-term frames of equal size and the analysis is carried out on a
frame basis. After segmenting the speech signal into equally sized frames windowing has to be performed. The
time-domain audio features like energy and zero-crossing rate will be extracted. The time-domain signal will be
transformed to frequency-domain signal by performing DFT .After transforming the signal to frequency domain,
the frequency-domain features will be extracted. The features of interest are spectral centroid, spectral entropy,
spectral flux, spectral rolloff and MFCC. These extracted features along with the label will be used to train the
machine learning algorithm. A supervised learning is performed. The machine learning algorithm will detect the
pattern in the extracted features and map these pattern to each labels. The classifier used is a SVM.
In the case of testing, first the input speech signal will be read from the file .The input speech signal will be
given to preprocessing stages and the features of interest will be extracted and will be given to the classifier. The
classifier detects the pattern in the extracted features and classify the input into the correct label or class. In the
case of misclassification, the system outputs a confusion matrix which shows the number of inputs got
III.II Modular diagram
Fig 2 Modular Diagram
The whole functionality of the system can be divided into four different modules based on the functionality .
Feature extraction
As a first step, the features of speech which carries significant informations which helps to detect emotion has to
be identified. Any significant changes in these parameters indicate variations in the emotions.
Speech features can be grouped either into phonetic features or prosodic features. The vowels, consonants and
their pronunciation are the different types of sounds involved in speech. These features are known as phonetic
features. The musical aspects of speech, such as rising or falling tones and accents or stresses, energy, pitch,
formants frequencies, etc can be considered as phonetic features. In general prosodic features are primary indicator of speaker‟s emotional state.
Before classifying any speech emotion under a given class, the relevant features in that speech signal have to be
separated. By analysing separated features the classifier, classify the emotion into a particular class to which the
emotion belongs. Feature extraction involves the analysis of the input speech signal.
In this project, twenty different features have to be extracted. The features of interest are short-time energy,
zero-crossing rate, spectral flux and entropy ,spectral centroid and MFCC. The MFCC contains thirteen features.
The different processes involved in the feature extraction are described below:
Noise Removal or Pre-processing : In the first stage, noise will be removed from each signal by using
noise-removal filters. The silent portions of the signals normally carries no useful information. So those
parts along with the leading and trailing edges of the signals are filtered by keeping a threshold level
for the signal energy. After that the signals are divided into frames using a Hamming window of length
Segmenting the signal into Frames: In this stage the output of analog to digital converter is divided or
segmented. The speech signals in the digital form will be segmented into frames with a time period
less than 20 ms. The speech signals have to be divided into frames of short time periods as they exhibit
quasi-stationary behavior within that range. So the process of framing or segmenting converts the non
stationary speech signal into quasi-stationary frames, which in turn enables Fourier Transformation of
the speech signal.
Applying window function on the frames: The signal which makes a frame may not be continuous.
There will be discontinuities at the beginning end of the frame as well as at the trailing edge of the
same. In order to decrease these discontinuities, windowing is performed to each individual frame.
After performing windowing two features are to be extracted. The features which are extracted are zero crossing
rate and short term energy. Both these features are two widely used parameters to detect emotions in speech.
Zero-crossing rate is defined as the number of times the signal crosses the zero or number of times the speech
signal changes sign within a given time window.
The short term energy is a basic feature of speech signal. And also it is one of the most important speech feature.
The short-time energy of speech signals reflects the amplitude variation. The intensity of the speech is known as
its energy. The energy can be considered as a parameter to extract features related to recognize emotion. Some
of the emotions are having higher energy levels. But that is not the case with all the emotions. The energy level
of some of the emotions are really very low. The emotions with higher energy levels are fear, joy, and anger
whereas sadness has very low energy level. Energy contains data that can be utilized to identify emotions, but
energy signal alone is not adequate to identify basic emotions.
FFT: Fast Fourier Transformation is applied to each frame. FFT is used to transform each frame in
time domain to frequency domain. Performing FFT on signals helps for analysis the frequency
spectrum of speech.
After finding the fast Fourier transform, different features are extracted. They are spectral flux, spectral entropy,
spectral centroid and spread, MFCC.
Spectral flux is a term related to the power spectrum of a signal .It provides a count of how quickly the power
spectrum changes. It can be easily calculated by comparing the power spectrum for one frame with that from the
previous one.
Mel-Frequency Cepstral Coefficients (MFCC): The MFCC can be calculated easily using calculations which
involves simple steps. It is one of well-known features and widely used one to feature to detect emotions. It has
many advantages involving anti-noise. MFCC are parameters which are similar to the characteristics of the
Performing Frequency wrapping using Mel Filter bank: Mel filter bank with overlapping triangular
filters with the cutoff frequencies determined by the center frequencies of the two adjacent filters have
to be used. The filters have linearly spaced centre frequencies and fixed bandwidth on the mel scale. Find Logarithm: Then find logarithm of the output signal obtained from filter bank. By finding
logarithm the multiplication of the magnitude in the Fourier transform will be converted into addition. Find Discrete Cosine Transform: It is used to orthogonalize the filter energy vectors. Because of this
orthogonalization step, the information of the filter energy vector is compacted into the first number of
components and shortens the vector to number of components.
The Fourier transform representation of the log magnitude spectrum called as the cepstrum coefficients. This
high frequency coefficient with high efficiency are most robust and more reliable and useful set of feature for
speech emotion recognition .Therefore the equation below shown using Fourier transform defined cepstrum of
the signal y(n).
CC(n)=FT-1{log|FT{y(n)}|}
The Mel frequency is
Fmel=3233log10(1+Fhz/1000)
While calculating MFCC firstly pre-emphasize of speech signal from constructed emotional database has been
done after this windowing is performed over pre-emphasize signal to make
frames of 20 sec then the Fourier transform is calculated to obtain spectrum of speech signal and this spectrum
is filtered by a filter bank in the Mel domain. After that the logs of the powers at each of the Mel frequencies is
calculated. Then cosines transform in order to simplify the computation and are used to obtain the MFCCs.
Feature labeling
In feature labelling, extracted features of the speech signal is saved in a file. The format of the file is ARFF
(Attribute-Relation File Format).In that file the extracted features and its corresponding class labels are written.
SVM is a binary classifier but it can be used for classifying multiple classes also.
SVM Training
The third stage in the project is to train the svm classifier. A supervised learning is performed with the voice
sample labelled with features.
The human emotion recognition is essentially a pattern detection scenario. The training phase of a supervised
machine learning algorithm have to detect patterns in the features extracted from a labelled dataset and then it
has to compute models to map input data to corresponding class label so that it can be used for classification.
Parameters
(v i , y i ) Classifier‟s Model
(i=1,....,M)
Figure 3 Generic diagram of the classifier training stage.
To perform the supervised training ,extracted feature vectors, vi , i =1, . . . , M, of the training dataset and the
corresponding class labels, yi , have to be available so that to start the training procedure.. The output of the
training stage depends on the SVM classifier.
SVM Classification
After training the SVM classifier with labelled features, the classifier will be capable of classifying speech
signals according to the emotions. Based on the features extracted from the input speech signal, the classifier
will assign the input speech signal to a class.
The class label has to be determined accurately by the classifier and the predicted outcome of the classifier has
to be compared with the actual class of the signal labelled during feature labelling module. Overlapping of
datasets categorised for training and testing should be avoided. By avoiding such overlapping, classifier
becomes more reliable.
IV.IMPLEMENTATION
The application is implemented using Python language and Machine learning techniques. The minimum hardware and software requirements are as listed below:
Hardware Requirements
1. 10GB Hard disk or more
2. 2GB RAM or more
3. 1.8GHz Speed
Software Requirements
1. Operating System : Ubuntu 14.04 or above.
2. Language : Python.
3. Software Packages : Python 2.7 or above.
4. Python Modules : scikit-learn, sklearn, numpy and scipy.
5. Basic Text editor
V. RESULTS
V.i Classification Model
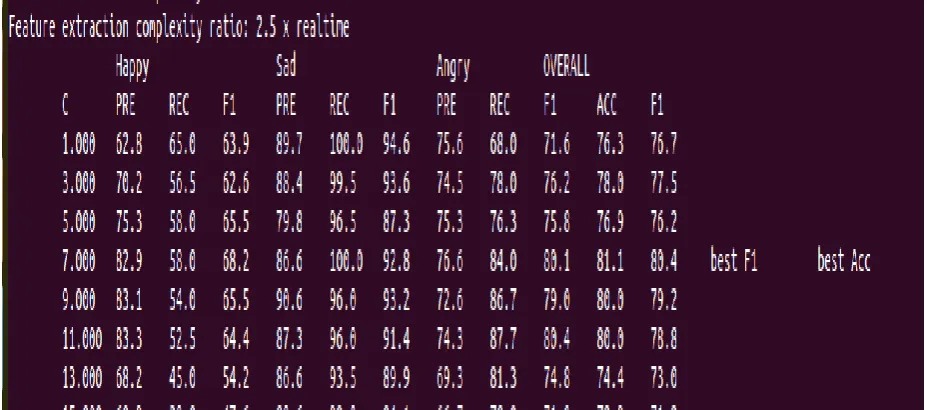
The performance measures which are calculated to find the efficiency of the SVM classifier are as given below.
The SVM classifier has a cost function. It is known as Constraint parameter, C because over-fitting of SVM
depends upon this value. The over-fitting increases as the value of C increases. When over-fitting exists the
number of misclassified samples will also increase. So constraint parameter value has to selected properly in
such a way to avoid over-fitting.
Precisionis fraction of predicted positive cases that were correct. It is defined as retrieved instances that have
relevance and is also known as positive predictive value. It can be calculated using equation Precision = d/(b+d).
where
b is the number of incorrect prediction telling that an instance is positive,
d is the number of correct prediction telling that an instance is positive.
Recall is the fraction of positive instances that are correctly retrieved and is also known as
sensitivity. Both precision and recall are therefore based on an understanding and measure of
relevance. Recall is calculated using the below equation
Recall = d/c+d
where
c is the number of incorrect prediction telling that an instance is negative,
d is the number of correct prediction telling that an instance is positive.
The above mentioned performance parameter values are calculated for each emotions using the mentioned
equations. It can be readily observed that in the above result the class-specific performance parameter value may
vary based on the C value. The performance measures are calculated for different C values and will select the C
value which gives the maximum accuracy and F1 ,as the cost function of the SVM.
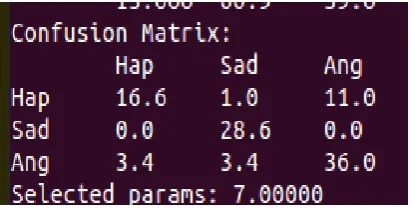
V.ii Confusion Matrix
A confusion matrix or an error matrix is used to describe the efficiency of a classifier. In the confusion matrix,
each column contains values which represents the instances in a predicted class while each row contains values
which represents the instances in an actual class. The name comes from the fact that it makes it easy to see if the
system is confusing two classes.
The confusion matrix is very much essential in the field of machine learning, especially for supervised learning. It is a specific table that describes the capability of a classifier on a set of data used for testing for which the true
values are already known. It contain details about actual classifications and predicted classifications done by a
classification system. The capability of classifiers are commonly evaluated using the data in the confusion
matrix.
In the confusion matrix, each column contains values which represents the instances in a predicted class while
each row contains values which represents the instances in an actual class. The name comes from the fact that it
makes it very simple to verify if the system is confusing two classes.
The confusion matrix obtained for the proposed classification model has three column and three rows. The
performance of the classification model in classifying three emotions are represented in the matrix.
The confusion matrix obtained as the output of the SVM classifier is as shown below:
Figure 4 Obtained confusion matrix
The instances in actual classes corresponding to happy, sad and angry are shown in first, second and third rows
respectively. The instances in predicted classes corresponding to happy, sad and angry are shown in first ,second
and third columns respectively.
16.6 percentage of actual happy signals are predicted as happy signal,1.0 percentage of happy signals are
misclassified as sad signal,11.0 percentage of happy signals are wrongly predicated as angry signal.
The total number of actual sad signals are predicted correctly without any misclassified signals.
36.0 percentage of actual angry signals are predicted correctly as angry signal,3.4 percentage of angry signals
The intensity of confusion between two classes can be better understood by observing the confusion matrix. Let
m and n be any row and column respectively and CM is the row-wise normalized version of the confusion
matrix.
CM (m, n) is the percentage of data of class m that are misclassified to class n and CM (n, m) is vice versa. For
the row-wise normalized confusion matrix The average of CM(m,n) and CM (n, m) can be interpreted as the joint „confusion‟ between the two classes.
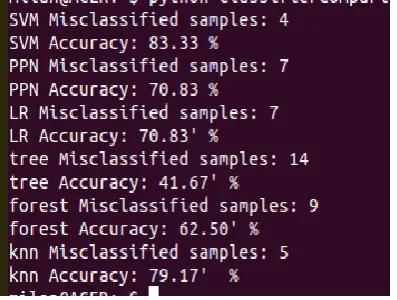
V.iii Classifier Comparison
A comparative study of six different classifiers namely, Perceptron, Logistic Regression, Decision Tree
Classifier, Random Forest Classifier, SVM, K-Neighbors Classifier has been performed. The number of
misclassified samples and accuracy of each classifier is obtained. The SVM classifier is giving maximum
accuracy. The number of misclassified sample is less in SVM compared to other classifiers.
Figure 5 Obtained classifier comparison
The accuracy is calculated using the equation accuracy =(a+b)/(a+b+c+d)
where a is the number of correct prediction telling that an instance is negative,
b is the number of incorrect prediction telling that an instance is positive,
c is the number of incorrect prediction telling that an instance is negative,
d is the number of correct prediction telling that an instance is positive.
VI.CONCLUSION
A classification model to detect the emotions in Tulu Language dataset has been implemented. The
implemented classification model has a high accuracy. The accuracy of different classifiers have been
compared. The different classifiers are SVM, Perceptron, Logistic Regression, Decision Tree Classifier,
Random Forest Classifier, K-nearest-neighbors Classifier. SVM have found to be more accurate to classify Tulu
Language dataset. Using this classification model an efficient emotion detection system can be developed. The
system can be designed in such a way that it will be able to detect emotions of speech in real time scenario. An
interactive user interface can be given. And in the interface provision to give real time voice samples as input
REFERENCES
[1] Lijiang Chen, Xia Mao, Yuli Xue, Lee Lung Cheng, “Speech emotion recognition Features and classification models,“ Elsevier, Digital Signal Processing 22 (2012) 1154– 1160.
[2] Vaishali M. Chavan, and V.V. Gohokar, “Speech Emotion Recognition by using SVM- Classifier,
International Journal of Engineering Advanced Technology(IJEAT),Vol.1,Issue 5,June 2012.
[3] Bhoomika Panda, DebanandaPadhi, Kshamamayee Dash and Prof. Sanghamitra,“Use of SVM Classifier and MFCC in Speech Emotion Recognition System,“International Journal of Advanced Research in Computer
Science and Software Engineering, Vol 2, Issue 3, March 2012.
[4] M.JayaLakshmi, K.Maharajan, and Dr.B.Paramasivan, “Instantaneous Emotion Detection System using Vocalizations, “ IOSR Journal of Engineering (IOSRJEN), Vol 2, Issue 7,PP. 11- 14,July 2012.
[5] Yi-Lin Lin and Gang Wei,“Speech Emotion Recognition Based on HMM and SVM,"Proceedings of the
Fourth International Conference on Machine Learning and Cybernetics”,Vol. 8, PP. 18-21, August 2005. [6] Schuller B, Rigoll,and Lang M.,“Hidden Markov model-based speech emotion recognition,” Proceedings of
the IEEE ICASSP Conference,Vol. 2, PP.1-4, April 2003.
[7] Yixiong Pan, PeipeiShen and LipingShen, “Speech Emotion Recognition Using Support Vector Machine,"
International Journal of Smart Home, Vol. 6, No. 2, April 2012.
[8] Ashish B.Inagale, D.S.Chaudhari, “ Speech Emotion Recognition ," International Journal of Soft
Computing and Engineering (IJSCE), Vol. 2, Issue 1,March 2012.
[9] Bhagyashree Kale, Anand Kakade,“ Speech Emotion Recognition through ANN,” International Journal of
Research in Management,Science and Technology (E-ISSN: 2321-3264), Vol. 2, No. 1, April 2014.
[10] Norhaslinda Kamaruddin and Abdul Wahab, “ Speech Emotion Verification System (SEVS) based on MFCC for real time applications,“ Conference Paper, August 2008.