108 |
P a g e
www.ijarse.com
A NEW APPROACH FOR IMAGE FEATURE VECTOR
CLASSIFICATION USING UNSUPERVISED
CLUSTERING METHOD
Mr.Sreedhar Kumar.S
1, Mrs.Shilpa.S
21
Associate Professor,
2M. Tech. Student, Department of CSE,
Don Bosco Institute of Technology, Bangalore, (India)
ABSTRACT
In this paper, we introduce a new approach for image feature vector classification using unsupervised clustering technique. The proposed approach is aimed to partition the trained image feature vector set into highly relative clusters. The proposed approach consists of two stages viz. (1) Image preprocessing stage (2) Classification stage. The image preprocessing stage aims to train the limited image feature vector set from the set of gray scale images through the feature extraction and feature selection. In the feature extraction stage, applied three spatial statistical operators such that mean, standard deviation and variance over the each individual block in the digital image and extracted three features from each block respectively. In the feature selection stage, the size of the image feature vector set is limited. In the classification stage, the trained image feature vector set is partitioned into ‘m’ highly relative clusters through the k-means technique. The experimental result shows that the proposed approach is very suitable for partitioning the image feature vector set into highly relative clusters.
Keywords: Statistical
Operators Supervised Clustering, Unsupervised Clustering.I INTRODUCTION
Classification of images can be done in supervised and unsupervised way. Supervised classification starts by
specifying an information class on the image. An algorithm is then used to summarize multispectral information
from the specified areas on the image to form class signatures. This process is called supervised training. For the
unsupervised classification, however an algorithm is first applied to the image and some spectral classes (also
called clusters) are formed. The image analyst then tries to assign a spectral class to the desirable information
class An efficient method to identify and classify the exudates as hard and soft exudates was introduced in [1].
Candidate exudates were detected using k-means clustering technique in this system.
A hybrid clustering which is combination of k-means and PSO clustering was introduced by [2] for
classification of multispectral images. Here k-means clustering was done initially and the result was used to see
the initial swarm. In [3], proposed a new unsupervised classification approach for automatic analysis of
polarmetric synthetic aperture radar (SAR) image. Here the classification of multidimensional SAR data space
by dynamic clustering was addressed as an optimization problem. A different approach was proposed by [4],
they used supervised features in the context of image classification and retrieval yielding excellent results and
109 |
P a g e
www.ijarse.com
is for grouping semantically similar images. In [5], they have proposed a new multistage method for
unsupervised image classification using hierarchical clustering. In the first phase, the multistage method
performs segmentation using a hierarchical clustering procedure which confines merging to spatially
adjacent clusters and generates an image partition. In the second phase, the segments resulting from the first
stage are classified into a small number of distinct states by a sequential merging operation.
In [6], have proposed a New Fuzzy Cluster Centroid (NFCC) for unsupervised classification algorithm to
improve the traditional FCM and fuzzy weighted c means (FWCM) algorithm. They reported that the inclusion
of the fuzzy centroid for each cluster has increased the stability of the algorithm and the inclusion of the new
term reduces the number of iterations for image classification. Frank Y. Shih et.al. [7] Have proposed a new
two-pass unsupervised clustering algorithm incorporated the fuzzy theory for classification of land sat remote
sensing images. In the first pass they derived the mean vectors of different land cover types representing their
geographic attributes and in the second pass the membership grade of a pixel belonging to different land cover
types is computed based on the distance between its gray-value vector and the mean vector of each type.
Beaulieu J.M. et.al.[8] have proposed a method which includes segmentation and classification of image. They
applied clustering over segment mean values and considered only large segments. They reported the method
was very efficient in simplifying the image. In [9] have proposed unsupervised image classification algorithms
using a hierarchical model. In this approach the only parameter supposed to be known is the number of regions,
all the other parameters are estimated. The algorithms they presented was implemented on a Connection
Machine CM200. They reported comparative tests were done on noisy synthetic and real images (remote
sensing). Another approach was proposed in [10], they derived an EM algorithm on the hybrid structure which
mixes an exact EM algorithm on each subtree and a low cost Gibbs EM algorithm on the coarse spatial grid.
Experiments on a synthetic image and multispectral satellite images are reported.
In this paper we have focused on a new approach for image feature vector classification using unsupervised
k-means clustering. Proposed approach partitions the trained image feature vector into highly relative „m‟ clusters.
The major goal of the proposed technique is to partition and classify image feature vector with good accuracy.
II THE PROPOSED SYSTEM
In this section, the detail of the proposed system is presented. The proposed system consists of two stages viz. 1)
Image preprocessing stage, and 2) Classification stage. Image enhancement can be done in two approaches,
Spatial and frequency domain. In the spatial domain method, the pixel composing of image details are
considered and the various procedures are directly applied on these pixels. The spatial technique methods are
simple and easy to implement and also the speed of operation is high.
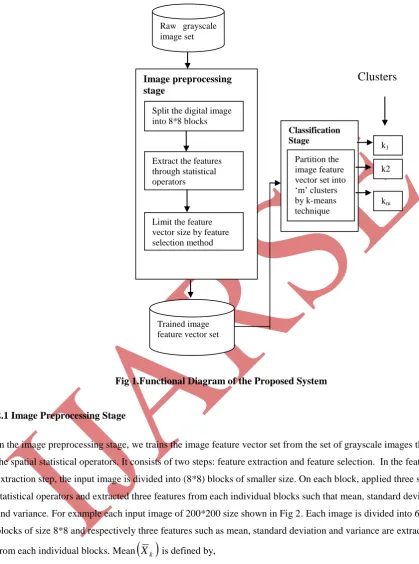
Fig 1 shows that the steps involving in the proposed system. The above two stages are described in the below
110 |
P a g e
www.ijarse.com
Fig 1.Functional Diagram of the Proposed System
2.1Image Preprocessing Stage
In the image preprocessing stage, we trains the image feature vector set from the set of grayscale images through
the spatial statistical operators. It consists of two steps: feature extraction and feature selection. In the feature
extraction step, the input image is divided into (8*8) blocks of smaller size. On each block, applied three spatial
statistical operators and extracted three features from each individual blocks such that mean, standard deviation
and variance. For example each input image of 200*200 size shown in Fig 2. Each image is divided into 625
blocks of size 8*8 and respectively three features such as mean, standard deviation and variance are extracted
from each individual blocks. Mean
X
k is defined by,
I I and I IC R
I
X kij k k
N k R i C j kij k
0 0 0 (1)
where
I
kij is denoting thei
th row andj
th column pixel value that belongs to thek
th block in the imageRaw grayscale image set
Image preprocessing stage
Split the digital image into 8*8 blocks
Extract the features through statistical operators
Limit the feature vector size by feature selection method
Trained image feature vector set Classification Stage k1 k2 km Partition the image feature vector set into „m‟ clusters by k-means technique
111 |
P a g e
www.ijarse.com
I
fork
0
,
1
,..,
N
,I
k represents thek
th block in the imageI
,R
andC
are denoting the row and column size respectively, andN
is the number of blocks in the image. Next, the standard deviation
SD
k
is definedas:
120 0 2 0
C
R
X
I
SD
N k R i C j k kijk (2)
where
X
kis representing the mean value of
thk
block in the imageI
fork
0
,
1
,..,
N
and finally the Variance
V
k is defined as:
2 20 0 0
1 2 1
N k R i C j k kijk
I
X
V
(3)where
X
k represents the mean ofk
th block that belong to image andI
kij is denoting thei
th row andj
thcolumn pixel value that belongs to the
k
th block in the imageI
fork
0
,
1
,..,
N
. Next, the feature selection step, the feature vector size is limited. Among all the features only means values of all input images are taken.The classification stage is described in the below subsection.
2.2. Classification Stage
In the classification stage, the trained image feature vector set is partitioned into „m‟ highly relative clusters
through the k-means technique. K-means is explained as follows: First randomly select K = {K1, K2…Km} where
K1, K2..Km are the candidate representative representing initial cluster center values that belongs to the actual
feature vector set and here „m‟ denotes the number of clusters or partitions. In the second step, measure the
similarity between the feature vector set and the cluster centers using Euclidean distance measure and is defined
as,
d (
X
i ,K
j) =
2 1 1 2 1
n i m j j iK
X
(4)
where
X
idenotes trained image feature vector set, i.e mean of all the imagesI
and n denotes the number ofinput images.
K
j denotes the initial cluster centers for j=1,2.... m and d(X
i,K
j) denotes the distance betweendata in
X
i and all the cluster centers values inK.
At last, when all the feature vector set data are included in some clusters an initial grouping is done. New
clusters centers C = {C1, C2..Cm} are then calculated by taking average of feature data in the present cluster
112 |
P a g e
www.ijarse.com
C
=
N
q q
S
N
01
(5)
where
N
q q
S
0
is the sum of all the values in the cluster whose center is
K
j for j=1,2.. m and N is the number ofvalues in that cluster.
This cluster updating is done because inclusion of new feature data may lead to changes in the existing cluster
centers. This process of center updation is iterated until a situation where centers do not update anymore or
criterion function becomes minimums. Square error criterion is used for this purpose and is defined as,
E= j
n
i m
j
i
C
X
1 1
and
X
i
C
j(6)
where
X
i denotes trained image feature vector set, i.e mean of all the imagesI
,C
jis the center for clusterwhose initial center was
K
j.
Algorithm
Input: Trained Image feature vector set of n images
X
i (i=1 to n)Number of clusters „m‟
Output: „n‟ images clustered into „m‟ Clusters.
Begin
1. Randomly select K= {K1, K2 ...Km} from image feature vector set
X
as candidate representativerepresenting initial clusters.
2. Repeat
3. Calculate the distance between
X
i (i=1 to n) and all „m‟ cluster centersK
j(j=1 to m) usingEuclidean distance Eq.(4) and assign
X
i to nearest cluster.4. For each cluster, recalculate the cluster center using average mean function using Eq(5).
5. Until no changing of cluster centers or criterion function becomes minimum using Eq.(5).
End
III EXPERIMENTS AND RESULTS
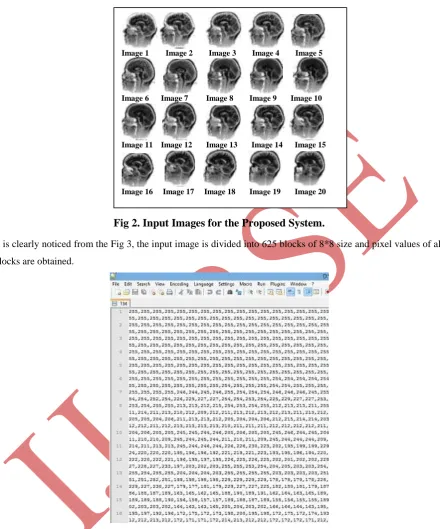
In this section, we tested the proposed system over 20 sample images that are shown in Fig 2 obtained from
[11]. These sample images are grayscale images of size 200*200. Each pixel in the image corresponds to some
characteristic at that point in space, for example protein density in MRI or X-ray absorption in CT scans. These
113 |
P a g e
www.ijarse.com
Fig 2. Input Images for the Proposed System.
It is clearly noticed from the Fig 3, the input image is divided into 625 blocks of 8*8 size and pixel values of all
blocks are obtained.
Fig 3.Result of sample digital image is divided into 625 blocks of size is (8*8) that the sample
images in Fig 2
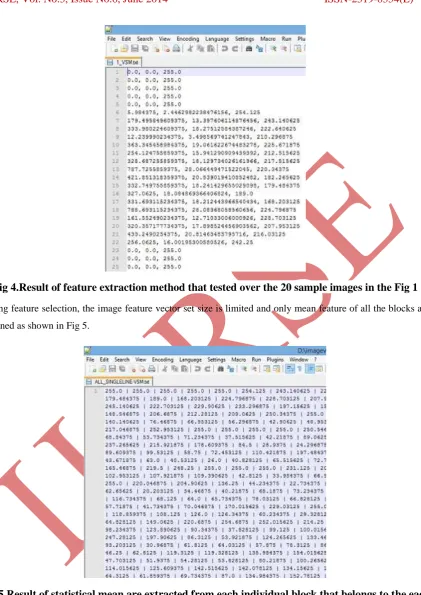
It feature extraction stage, applied statistical operators and features such as mean, standard deviation and
variance are obtained from all the 625 blocks as shown in Fig 4.
Image 1 Image 2 Image 3 Image 4 Image 5
Image 6 Image 7 Image 8 Image 9 Image 10
Image 11 Image 12 Image 13 Image 14 Image 15
114 |
P a g e
www.ijarse.com
Fig 4.Result of feature extraction method that tested over the 20 sample images in the Fig 1
During feature selection, the image feature vector set size is limited and only mean feature of all the blocks are
obtained as shown in Fig 5.
Fig 5.Result of statistical mean are extracted from each individual block that belongs to the each
image in the Fig 2
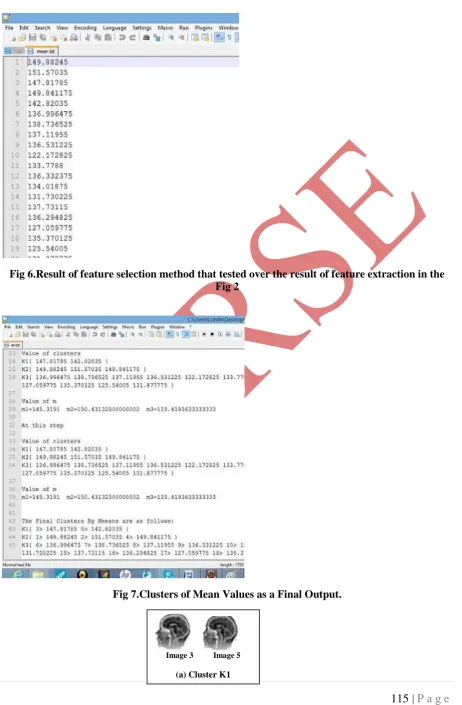
Finally the trained image feature vector set consisting of average mean value of all the input images obtained in
Fig 6 are given as an input to k-means technique and highly relative „3‟ clusters K1,K2,K3 are obtained as
115 |
P a g e
www.ijarse.com
Fig 6.Result of feature selection method that tested over the result of feature extraction in the
Fig 2
Fig 7.Clusters of Mean Values as a Final Output.
Image 3 Image 5
116 |
P a g e
www.ijarse.com
Fig 8.Clusters of images.(a) Cluster k1(b) Cluster k2 (c) Cluster k3.
IV CONCLUSION AND FUTURE WORK
In this paper, we introduced a new approach for image feature vector set classification using unsupervised
clustering technique. The proposed approach is aimed to partition the trained image feature vector set into
highly relative clusters. The proposed approach consists of two stages viz. (1) Image preprocessing stage (2)
Classification stage. The image preprocessing stage aims to train the limited image feature vector set from the
set of gray scale images through the feature extraction and feature selection. In the feature extraction stage,
applied three spatial statistical operators such that mean, standard deviation and variance over the each
individual block in the digital image and extracted three features from each block respectively. In the feature
selection stage, the size of the image feature vector set is limited.
In the classification stage, the trained image feature vector set is partitioned into „m‟ highly relative clusters
through the k-means technique. We tested our proposed system over the 20 sample medical images and
partitioned into three highly relative clusters or classes with high accuracy. According to the experiment results,
our proposed system is better suitable for partitioned the images into highly relative classes for the image
classification. In the feature work we will improve our system for classifying the new sample images that belong
to which class or cluster in the existing classes.
REFERENCES
[1] Rajput G.G, Patil and Preethi “Detection and classification of exudates using k-means clustering in color
retinal images” Signal and Image Processing (ICSIP), 2014 Fifth International Conference 2014,pp126 –
130,2014.
[2] Venkatalakshmi.k Dept of I.T “Classification of multispectral images using vector machines based on PSO
and K-means clustering”- Intelligent sensing and information processing, proceeding of 2005 International
Conference on Date 4-7Jan 2005,pp 127-133, 2005.
Image 6 Image 7 Image 8 Image 9 Image 10
Image 11 Image 12 Image 13 Image 14 Image 15
Image 16 Image 17 Image 18 Image 19 Image 20
(c)Cluster K3
Image 1 Image 2 Image 4
117 |
P a g e
www.ijarse.com
[3] Turker ince “Unsupervised classification of polarimetric SAR image with dynamic clustering: An image
processing approach Advances in Engineering Software”, Science Direct Volume 41, Issue 4, pp
636-646,2009.
[4] Gianluigi Ciocca, Claudio Cusano, Simone Santini, Raimondo Schettini “On the use of supervised features
for unsupervised image categorization: An evaluation Computer Vision and Image Understanding”,Volume122, Issue null,pp155-171 (science digest ) 2013.
[5] Sanghoon Lee,Kyunggi-Do,Crawford,M.M “Unsupervised multistage image classification using hierarchical
clustering with a bayesian similarity measure” Image Processing, IEEE Transactions Volume:14 , Issue:
3 ,pp 312-320,2005.
[6] Genitha,C.H, Vani,K “Classification of satellite images using new Fuzzy cluster centroid for unsupervised
classification algorithm” Information & Communication Technologies (ICT), 2013 IEEE Conference on
11-12 April 2013, pp 203 – 207,2013.
[7] Frank Y. Shih, Gwotsong P. Chen “Classification of landsat remote sensing images by a fuzzy unsupervised
clustering algorithm”Information Sciences - Applications, Volume 1, Issue 2, pp 97-116,2013.
[8] Beaulieu, J.M.;Touzi,R.“Mean-shift and hierarchical clustering for textured polarimetric SAR image
segmentation/classification” Geoscience and Remote Sensing Symposium (IGARSS), 2010 IEEE International Publication Year: 2010 , pp 2519 – 2522,2010.
[9]Kato, Z.Zerubia, J. Berthod, M “Unsupervised parallel image classification using a hierarchical Markovian
model”Computer Vision Proceedings, Fifth International Conference on 20-23 Jun 1995, pp169 – 174,
1995.
[10] Chardin, A. , Perez, P. “Unsupervised image classification with a hierarchical EM algorithm” Computer
Vision, 1999. The Proceedings of the Seventh IEEE International Conference on image processing Volume:
2 , pp 969 - 974 ,1999.
[11]http://www.google.co.in/imgres?imgrefurl=http%3A%2F%2Fpaulbourke.net%2Fmiscellaneous%2Fcortex
%2F&tbnid=PTPNHg1rb9OTlM:&docid=iN4bz-VS7JKb0M&h=388&w=600.
[12] Dr.M.P.S Bhatia and Deepika Khurana “Experimental study of Data clustering using K-means and modified algorithms” International Journal of Data Mining and Knowledge Management Process(IJDKM)