Clinical Epidemiology 2018:10 1773–1786
Clinical Epidemiology
Dove
press
submit your manuscript | www.dovepress.com 1773
O r i g i n a l r E s E a r C h open access to scientific and medical research
Open Access Full Text Article
Combining distributed regression and propensity
scores: a doubly privacy-protecting analytic
method for multicenter research
sengwee Toh1
robert Wellman2
r Yates Coley2
Casie horgan1
Jessica sturtevant1
Erick Moyneur3
Cheri Janning4
roy Pardee2
Karen J Coleman5
David arterburn2
Kathleen McTigue6
Jane anau2
andrea J Cook2
On behalf of the PCOrnet Bariatric study Collaborative
1Department of Population
Medicine, harvard Medical school and harvard Pilgrim health Care institute, Boston, Ma, Usa; 2Kaiser
Permanente Washington health research institute, seattle, Wa, Usa; 3statlog Econometrics, inc.,
Montreal, QC, Canada; 4Duke
Clinical and Translational science institute, Durham, nC, Usa; 5Kaiser
Permanente southern California, Pasadena, Ca, Usa; 6Department of
Medicine, University of Pittsburgh, Pittsburgh, Pa, Usa
Purpose: Sharing of detailed individual-level data continues to pose challenges in multi-center studies. This issue can be addressed in part by using analytic methods that require only summary-level information to perform the desired multivariable-adjusted analysis. We examined the feasibility and empirical validity of 1) conducting multivariable-adjusted distributed linear regression and 2) combining distributed linear regression with propensity scores, in a large distributed data network.
Patients and methods: We compared percent total weight loss 1-year postsurgery between Roux-en-Y gastric bypass and sleeve gastrectomy procedure among 43,110 patients from 36 health systems in the National Patient-Centered Clinical Research Network. We adjusted for baseline demographic and clinical variables as individual covariates, deciles of propensity scores, or both, in three separate outcome regression models. We used distributed linear regression, a method that requires only summary-level information (specifically, sums of squares and cross products matrix) from sites, to fit the three ordinary least squares linear regression models. A comparison set of analyses that used pooled deidentified individual-level data from sites served as the reference.
Results: Distributed linear regression produced results identical to those from the correspond-ing pooled individual-level data analysis for all variables in all three models. The maximum numerical difference in the parameter estimate or standard error for all the variables was 3×10⁻¹¹
across three models.
Conclusion: Distributed linear regression analysis is a feasible and valid analytic method in multicenter studies for one-time continuous outcomes. Combining distributed regression with propensity scores via modeling offers more privacy protection and analytic flexibility. Keywords: distributed regression, propensity score, distributed data networks, privacy-protecting methods
Introduction
It is increasingly common and necessary to conduct multicenter, population-based studies with data from a large number of geographically and demographically diverse individuals.1–6 However, it is not always possible or desirable to share deidentified
individual-level data sets in multicenter studies. For example, some data partners may be concerned about potential breaches of patient privacy, while others may be wor-ried about unauthorized uses of their data, incorrect analysis or interpretation of the data, or inadvertent disclosures of sensitive corporate or institutional information.7–10
Certain health plans or delivery systems, which collect electronic health data as part of clinical care, have contractual agreements with their patients that restrict sharing
Correspondence: sengwee Toh Department of Population Medicine, harvard Medical school and harvard Pilgrim health Care institute, 401 Park Drive, suite 401 East, Boston, Ma 02215, Usa
Tel +1 617 867 4818 Fax +1 617 867 4276
Email [email protected]
Journal name: Clinical Epidemiology Article Designation: Original Research Year: 2018
Volume: 10
Running head verso: Toh et al
Running head recto: Combining distributed regression with propensity scores DOI: http://dx.doi.org/10.2147/CLEP.S178163
Clinical Epidemiology downloaded from https://www.dovepress.com/ by 118.70.13.36 on 20-Aug-2020
For personal use only.
Dovepress Toh et al
of individual-level data for purposes other than patient care. Even when patients, health plans, and delivery systems are amenable to sharing individual-level data, sometimes the time and resources required to formalize data-sharing agreements can significantly delay a research project or make it infeasible.
There have been ongoing efforts to develop and apply more privacy-protecting analytic and data-sharing methods that do not require transferring of individual-level data sets in multicenter studies. For example, methods that leverage sum-mary scores (eg, propensity scores and disease risk scores) are appealing because they allow researchers to adjust for a large number of covariates without having to share highly granular information.11–13 Prior studies have demonstrated the
feasibility and validity of using only summary-level informa-tion from participating sites to perform matched or stratified analysis with summary scores for fixed exposures and one-time binary and one-time-to-event outcomes.12–14 Meta-analysis
of site-specific effect estimates has also been shown to be a viable analytic option in certain multicenter studies.13–15
Distributed regression, which has theoretical advantages of being computationally equivalent to pooled individual-level data regression,16,17 has also been used in some multicenter
studies.18–21
There is a continued need for more methodological development and empirical assessment of these more privacy-protecting analytic methods in real-world multicenter studies. We performed a study to empirically assess the feasibility and validity of 1) conducting distributed linear regression analysis in a large national distributed data network; and 2) combining distributed regression with propensity scores, a data dimension reduction technique, to achieve more privacy protection and analytic flexibility.
Materials and methods
setting
The National Patient-Centered Clinical Research Network (PCORnet) is a distributed data network designed to support studies that address questions important to patients and other stakeholders.22 It includes 13 Clinical Data Research
Net-works (CDRNs), 20 People-Powered Research NetNet-works, two Health Plan Research Networks, and a coordinating center. The CDRNs, each of which includes multiple participating health systems, provide access to electronic health record (EHR) or administrative claims data from more than 100 million individuals and over 40 million patients who could be recruited into pragmatic clinical trials. PCORnet employs a common data model to standardize the data extracted from the EHRs or administrative claims of the participating
health systems.23 The data domains extracted from the EHRs
included patient demographics, diagnoses and procedures, vital signs, and laboratory test results.
study cohort
The PCORnet Bariatric Study was initiated in 2016 to evalu-ate the comparative effectiveness and safety of three com-monly performed bariatric procedures – adjustable gastric band, Roux-en-Y gastric bypass, and sleeve gastrectomy.24
The study identified patients who underwent a primary bar-iatric procedure in participating health systems from Janu-ary 1, 2005, to September 30, 2015. Patients must meet the following criteria to be eligible for the study: 1) aged 21–79 years at the index procedure; 2) body mass index ≥35 kg/m2
in the year before their procedure; 3) no multiple conflicting bariatric procedure codes on the same day; 4) no revision bariatric procedure code, gastrointestinal cancer diagnosis code, or fundoplasty procedure in the year before the index procedure; 5) no emergency room encounter on the day of index procedure; and 6) a weight measurement 6–18 months after the index procedure. A full description of the design and findings from the weight loss study are available elsewhere.25
Exposure
We restricted the analysis to the comparison of Roux-en-Y gastric bypass and sleeve gastrectomy.
Outcome
The outcome of interest was percent total weight loss at 1 year after surgery in comparison with presurgery weight, cal-culated as [(postsurgery weight at 1 year − baseline weight)/ baseline weight] and modeled as a continuous variable.
Confounders
We included the same potential confounders identified a priori by the study investigators in the main weight loss analysis based on their subject matter knowledge and input from stakeholders. These confounders included age; sex; race; Hispanic ethnicity; year of procedure; site; combined comorbidity score;26 baseline weight; the number of days
between baseline weight measurement and the index proce-dure; baseline smoking status; total days of hospitalization in the year prior to surgery; and diagnosis of anxiety, deep vein thrombosis, depression, diabetes, dyslipidemia, eating disorder, gastroesophageal reflux disease, hypertension, infertility, kidney disease, nonalcoholic fatty liver disease, osteoarthritis, polycystic ovarian syndrome, psychosis, pul-monary embolism, sleep apnea, and substance use disorder,
Clinical Epidemiology downloaded from https://www.dovepress.com/ by 118.70.13.36 on 20-Aug-2020
Dovepress Combining distributed regression with propensity scores
recorded in the year prior to surgery. As described in more detail below, these confounders were accounted for in the outcome regression model as individual covariates, propen-sity scores, or both.
Pooled individual-level data analysis
We used the pooled deidentified individual-level ordinary least squares regression analysis as the reference analysis. For this analysis, we wrote distributed programs to run at each site to pull individual-level data and then combined all site-specific individual-level data sets together to form a standard pooled deidentified analysis data set, which included exposure status, all confounders, site indicators, and the outcome. To estimate propensity scores within the combined data set, we fit a logistic regression model, separately for each site, which predicted the probability of receiving Roux-en-Y gastric bypass procedure (vs sleeve gastrectomy) using all the confounders described above as predictors.
We fit three ordinary least squares linear regression models to examine the difference in percent total weight loss at 1 year compared with baseline, comparing the Roux-en-Y gastric bypass procedure with the sleeve gastrectomy procedure. Model 1 included an exposure indicator variable, indicator variables for sites, and potential confounders as individual variables. The purpose of this analysis was to demonstrate the feasibility and empirical validity of conduct-ing multivariable-adjusted distributed linear regression in
large real-world distributed data networks such as PCORnet. Model 2 included the exposure and site indicator variables and propensity scores (in deciles, defined within each site). The purpose of this analysis was to examine the feasibility and empirical validity of combining distributed regression with propensity scores via modeling. Model 3 included the exposure and site indicator variables, potential confounders as individual variables, and propensity scores (in deciles). This model is an example of a “doubly robust” regression model – the results would be valid if either the propensity score model or the outcome model was correctly specified.27,28
Distributed linear regression
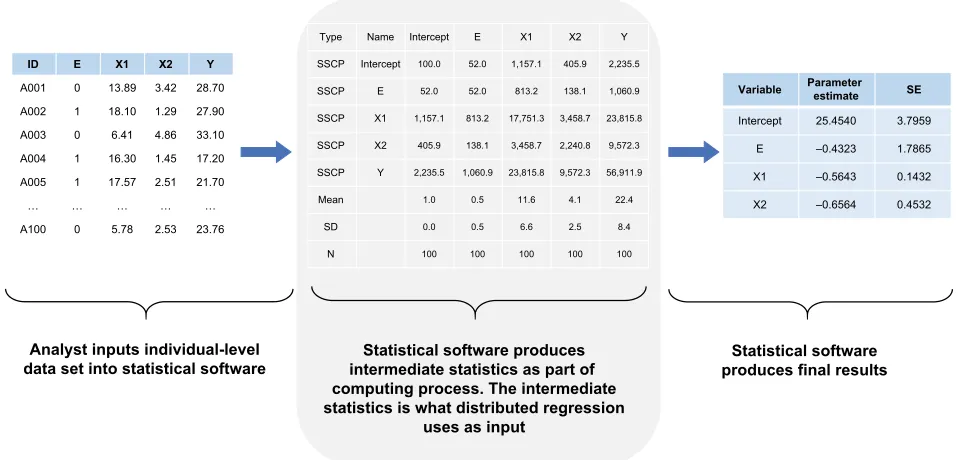
Distributed regression is a suite of methods that enable researchers to conduct multidatabase regression analysis without the need to centrally combine all individual-level data from participating sites.16,17 As shown in Figure 1, it
performs the same numeric algorithm as standard regression that is based on individual-level data but uses only summary statistics for computation. By following the same computa-tion process, distributed regression and pooled individual-level data analysis should theoretically produce statistically equivalent results.
For distributed linear regression, the total sums of squares and cross products (SSCP) matrix for the intercept, dependent variable, and independent variables across all databases is sufficient to obtain the overall parameter
esti-Analyst inputs individual-level
data set into statistical software intermediate statistics as part of Statistical software produces produces final results Statistical software computing process. The intermediate
statistics is what distributed regression uses as input
ID E X1 X2 Y
A001 0 13.89 3.42 28.70
A002 1 18.10 1.29 27.90
A003 0 6.41 4.86 33.10
A004 1 16.30 1.45 17.20
A005 1 17.57 2.51 21.70
… … … … …
A100 0 5.78 2.53 23.76
Type Name Intercept E X1 X2 Y
SSCP Intercept 100.0 52.0 1,157.1 405.9 2,235.5
SSCP E 52.0 52.0 813.2 138.1 1,060.9
SSCP X1 1,157.1 813.2 17,751.3 3,458.7 23,815.8
SSCP X2 405.9 138.1 3,458.7 2,240.8 9,572.3
SSCP Y 2,235.5 1,060.9 23,815.8 9,572.3 56,911.9
Mean 1.0 0.5 11.6 4.1 22.4
SD 0.0 0.5 6.6 2.5 8.4
N 100 100 100 100 100
Variable Parameter estimate SE
Intercept 25.4540 3.7959
E –0.4323 1.7865
X1 –0.5643 0.1432
X2 –0.6564 0.4532
Figure 1 Computation process of a typical regression analysis.
Note: numbers are hypothetical and for demonstrative purposes only.
Abbreviations: ssCP, sums of squares and cross products; sE, standard error.
Clinical Epidemiology downloaded from https://www.dovepress.com/ by 118.70.13.36 on 20-Aug-2020
Dovepress Toh et al
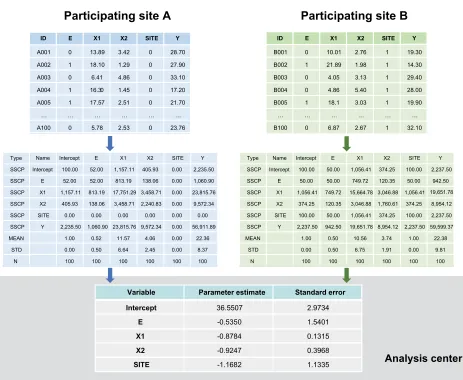
mates and associated covariance matrix. Because of its sta-tistical properties, the total SSCP matrix can be obtained by simply summing up the site-specific SSCP matrices across all databases. In other words, we can request the summary-level SSCP matrix from each participating site and combine these matrices centrally to produce the parameter estimates and SEs (or 95% CIs), as shown in Figure 2. Although stan-dard statistical software packages cannot readily perform distributed linear regression, they can produce the SSCP matrix. For example, SAS software has the procedure PROC REG, which performs linear regression analysis, and it read-ily inputs and outputs SSCP matrix.
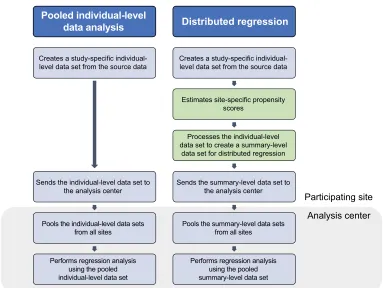
To perform distributed linear regression, we followed a process similar to the one described in the pooled indi-vidual-level data analysis, but with more computation done at the site. Figure 3 describes the steps involved in each analysis. Specifically, we modified the distributed program used to pull individual-level data by including additional
code that 1) fit a site-specific propensity score model and 2) decomposed the individual-level data into three sets of SSCP matrices, one for each regression model described above. We distributed the modified program to the partici-pating sites for local execution. We then combined these individual site-specific SSCP matrices to produce parameter estimates and SEs.
The distributed SAS packages used to create the site-spe-cific deidentified individual-level data sets (for the reference analysis) and SSCP matrices (for the distributed regression analysis) as well as the SAS programs used by the analysis center to produce the final results are publicly available on GitHub at https://github.com/pcornet-analytics/bariatric.
Comparison
We compared the parameter estimate and standard error (SE) of each variable in each model (Models 1–3) from the pooled indi-vidual-level data analysis and distributed regression approach.
Participating site A
ID E X1 X2 SITE Y
A001 0 13.89 3.42 0 28.70
A002 1 18.10 1.29 0 27.90
A003 0 6.41 4.86 0 33.10
A004 1 16.30 1.45 0 17.20
A005 1 17.57 2.51 0 21.70
… … … …
A100 0 5.78 2.53 0 23.76
Participating site B
ID E X1 X2 SITE Y
B001 0 10.01 2.76 1 19.30
B002 1 21.89 1.98 1 14.30
B003 0 4.05 3.13 1 29.40
B004 0 4.86 5.40 1 28.00
B005 1 18.1 3.03 1 19.90
… … … …
B100 0 6.87 2.67 1 32.10
Type Name Intercept E X1 X2 SITE Y SSCP Intercept 100.00 52.00 1,157.11 405.93 0.00 2,235.50 SSCP E 52.00 52.00 813.19 138.06 0.00 1,060.90 SSCP X1 1,157.11 813.19 17,751.29 3,458.71 0.00 23,815.76 SSCP X2 405.93 138.06 3,458.71 2,240.83 0.00 9,572.34 SSCP SITE 0.00 0.00 0.00 0.00 0.00 0.00 SSCP Y 2,235.50 1,060.90 23,815.76 9,572.34 0.00 56,911.89 MEAN 1.00 0.52 11.57 4.06 0.00 22.36
STD 0.00 0.50 6.64 2.45 0.00 8.37
N 100 100 100 100 100 100
Type Name Intercept E X1 X2 SITE Y SSCP Intercept 100.00 50.00 1,056.41 374.25 100.00 2,237.50 SSCP E 50.00 50.00 749.72 120.35 50.00 942.50 SSCP X1 1,056.41 749.72 15,664.78 3,046.88 1,056.41 19,651.78 SSCP X2 374.25 120.35 3,046.88 1,760.61 374.25 8,954.12 SSCP SITE 100.00 50.00 1,056.41 374.25 100.00 2,237.50 SSCP Y 2,237.50 942.50 19,651.78 8,954.12 2,237.50 59,599.37 MEAN 1.00 0.50 10.56 3.74 1.00 22.38
STD 0.00 0.50 6.75 1.91 0.00 9.81
N 100 100 100 100 100 100
Analysis center
Variable Parameter estimate Standard error
Intercept 36.5507 2.9734
E -0.5350 1.5401
X1 -0.8784 0.1315
X2 -0.9247 0.3968
SITE -1.1682 1.1335
Figure 2 Distributed regression in a multicenter study.
Note: numbers are hypothetical and for demonstrative purposes only.
Abbreviation: ssCP, sums of squares and cross products.
Clinical Epidemiology downloaded from https://www.dovepress.com/ by 118.70.13.36 on 20-Aug-2020
Dovepress Combining distributed regression with propensity scores
secondary analysis
Due to small sample sizes, we expected some sites to have issues fitting their site-specific propensity score models. Therefore, we reran the analyses excluding sites that had any warnings or errors in their returned SAS logs.
Results
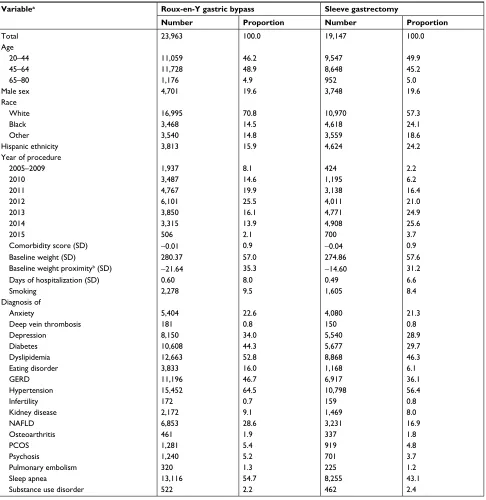
We identified 43,110 eligible patients – 23,963 underwent the Roux-en-Y gastric bypass procedure, and 19,147 patients had the sleeve gastrectomy procedure – from 36 participating data marts. The sample size ranged from 5 to 16,257 across sites. Table 1 summarizes the baseline characteristics of the study cohort by treatment group.
analyses that included all sites, regardless
of warnings or errors when fitting the
site-specific propensity score models
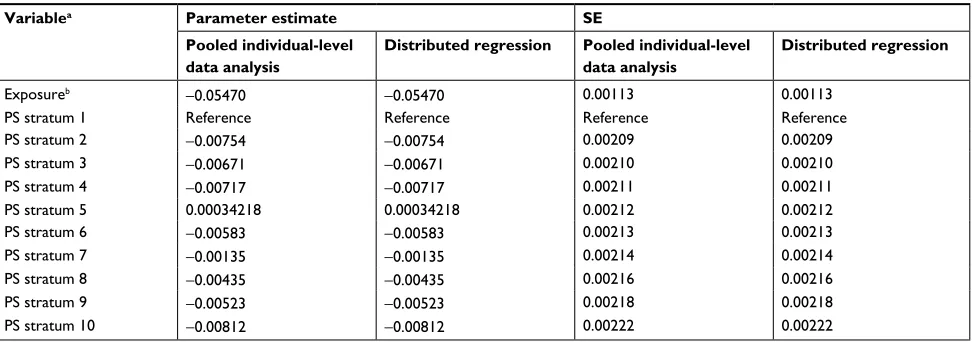
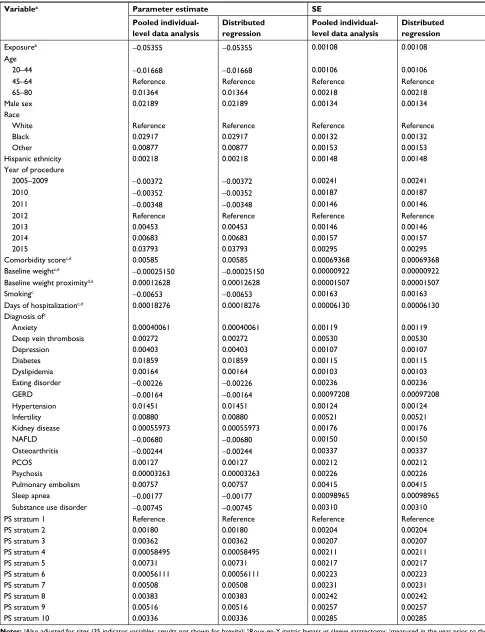
For each of the three regression models, the results were identical between the distributed regression analysis and the corresponding pooled individual-level data analysis, as shown in Tables 2–4. Overall, the results showed that Roux-en-Y gastric bypass was associated with greater percent total weight loss than sleeve gastrectomy at 1-year follow-up
– approximately 5 percentage points greater in all the three regression models examined. The maximum difference in numerical value was 3.28×10⁻¹¹ for the parameter estimate
and SE across all the variables in Model 1, 3.24×10⁻¹¹ in
Model 2, and 3.29×10⁻¹¹ in Model 3. Across regression
models, adjusting for potential confounders as individual covariates, propensity scores, or both in the models produced similar effect estimates for the comparison of interest.
analyses that included only sites without
any warnings or errors when fitting the
site-specific propensity score models
In total, 17 sites successfully executed the SAS package without any warnings or errors in the site-specific propensity score model. There were 36,476 patients – 20,260 Roux-en-Y gastric bypass patients and 16,216 sleeve gastrectomy patients in these 17 sites. The sample size ranged from 242 to 16,257 across these sites. Table S1 summarizes the baseline characteristics of these patients by treatment group. For each of the three regression models, the results were identical between the pooled individual-level data analysis and the distributed regression analysis, as shown in Tables S2–S4. The maximum difference in numerical value was 3.91×10⁻¹¹
Pooled individual-level data analysis
Creates a study-specific individual-level data set from the source data
Sends the individual-level data set to the analysis center
Pools the individual-level data sets from all sites
Performs regression analysis using the pooled individual-level data set
Distributed regression
Creates a study-specific individual-level data set from the source data
Estimates site-specific propensity scores
Processes the individual-level data set to create a summary-level
data set for distributed regression
Sends the summary-level data set to the analysis center
Pools the summary-level data sets from all sites
Performs regression analysis using the pooled summary-level data set
Participating site Analysis center
Figure 3 Workflow to perform pooled individual-level data analysis and distributed regression analysis.
Clinical Epidemiology downloaded from https://www.dovepress.com/ by 118.70.13.36 on 20-Aug-2020
Dovepress Toh et al
for the parameter estimate and SE across all the variables in Model 1, 3.35×10⁻¹¹ in Model 2, and 3.67×10⁻¹¹ in Model
3. Across the regression models, adjusting for potential confounders as individual covariates, propensity scores, or both in the models produced similar effect estimates for the comparison of interest. Not surprisingly, the results from the 17 error-free sites, which comprised 85% (36,476 of 43,110)
of the data, were similar to the results obtained from the cor-responding analyses that included all data.
Discussion
In this study, we demonstrated the feasibility of implement-ing distributed linear regression in an active, real-world, national distributed data network and the validity of this
Table 1 Baseline characteristics of patients who underwent roux-en-Y gastric bypass or sleeve gastrectomy procedure from 36 health systems participating in the PCOrnet Bariatric study
Variablea Roux-en-Y gastric bypass Sleeve gastrectomy
Number Proportion Number Proportion
Total 23,963 100.0 19,147 100.0
age
20–44 11,059 46.2 9,547 49.9
45–64 11,728 48.9 8,648 45.2
65–80 1,176 4.9 952 5.0
Male sex 4,701 19.6 3,748 19.6
race
White 16,995 70.8 10,970 57.3
Black 3,468 14.5 4,618 24.1
Other 3,540 14.8 3,559 18.6
hispanic ethnicity 3,813 15.9 4,624 24.2
Year of procedure
2005–2009 1,937 8.1 424 2.2
2010 3,487 14.6 1,195 6.2
2011 4,767 19.9 3,138 16.4
2012 6,101 25.5 4,011 21.0
2013 3,850 16.1 4,771 24.9
2014 3,315 13.9 4,908 25.6
2015 506 2.1 700 3.7
Comorbidity score (sD) −0.01 0.9 −0.04 0.9
Baseline weight (sD) 280.37 57.0 274.86 57.6
Baseline weight proximityb (sD) −21.64 35.3 −14.60 31.2
Days of hospitalization (sD) 0.60 8.0 0.49 6.6
smoking 2,278 9.5 1,605 8.4
Diagnosis of
anxiety 5,404 22.6 4,080 21.3
Deep vein thrombosis 181 0.8 150 0.8
Depression 8,150 34.0 5,540 28.9
Diabetes 10,608 44.3 5,677 29.7
Dyslipidemia 12,663 52.8 8,868 46.3
Eating disorder 3,833 16.0 1,168 6.1
gErD 11,196 46.7 6,917 36.1
hypertension 15,452 64.5 10,798 56.4
infertility 172 0.7 159 0.8
Kidney disease 2,172 9.1 1,469 8.0
naFlD 6,853 28.6 3,231 16.9
Osteoarthritis 461 1.9 337 1.8
PCOs 1,281 5.4 919 4.8
Psychosis 1,240 5.2 701 3.7
Pulmonary embolism 320 1.3 225 1.2
sleep apnea 13,116 54.7 8,255 43.1
substance use disorder 522 2.2 462 2.4
Notes: aMeasured in the year prior to the surgery unless otherwise specified; bnumber of days between baseline weight measurement and index procedure.
Abbreviations: GERD, gastroesophageal reflux disease; NAFLD, nonalcoholic fatty liver disease; PCORnet, National Patient-Centered Clinical Research Network; PCOS,
polycystic ovarian syndrome.
Clinical Epidemiology downloaded from https://www.dovepress.com/ by 118.70.13.36 on 20-Aug-2020
Dovepress Combining distributed regression with propensity scores
analytic method in producing results identical to those obtained from conventional pooled individual-level data analysis for a single continuous outcome. Although some of the prior studies have compared the results from distrib-uted regression with those obtained from the correspond-ing pooled individual-level data analysis,18–20 they were
conducted within smaller distributed data networks or more controlled environments (ie, virtual or simulated distributed data networks). The current study is the largest study that demonstrated the feasibility and empirical validity of dis-tributed regression. As these more privacy-protecting meth-ods may be less well understood by researchers, empirical
Table 2 results from a linear regression model that adjusted for sites and confounders as individual covariates (Model 1) from 36 health systems participating in the PCOrnet Bariatric study
Variablea Parameter estimate SE
Pooled individual-level data analysis
Distributed regression
Pooled individual-level data analysis
Distributed regression
Exposureb −0.05312 −0.05312 0.00105 0.00105
age
20–44 −0.01662 −0.01662 0.00106 0.00106
45–64 reference reference reference reference
65–80 0.01339 0.01339 0.00218 0.00218
Male sex 0.02162 0.02162 0.00133 0.00133
race
White reference reference reference reference
Black 0.02873 0.02873 0.00130 0.00130
Other 0.00883 0.00883 0.00153 0.00153
hispanic ethnicity 0.00227 0.00227 0.00147 0.00147
Year of procedure
2005–2009 −0.00319 −0.00319 0.00218 0.00218
2010 −0.00301 −0.00301 0.00169 0.00169
2011 −0.00326 −0.00326 0.00144 0.00144
2012 reference reference reference reference
2013 0.00384 0.00384 0.00141 0.00141
2014 0.00569 0.00569 0.00145 0.00145
2015 0.03664 0.03664 0.00288 0.00288
Comorbidity scorec,d 0.00576 0.00576 0.00069243 0.00069243
Baseline weightc,d −0.00025096 −0.00025096 0.00000921 0.00000921
Baseline weight proximityd,e 0.00012330 0.00012330 0.00001430 0.00001430
smokingc −0.00657 −0.00657 0.00163 0.00163
Days of hospitalizationc,d 0.00017944 0.00017944 0.00006129 0.00006129
Diagnosis ofc
anxiety 0.00036721 0.00036721 0.00119 0.00119
Deep vein thrombosis 0.00245 0.00245 0.00530 0.00530
Depression 0.00412 0.00412 0.00107 0.00107
Diabetes 0.01914 0.01914 0.00107 0.00107
Dyslipidemia 0.00169 0.00169 0.00103 0.00103
Eating disorder −0.00247 −0.00247 0.00236 0.00236
gErD −0.00132 −0.00132 0.00095329 0.00095329
hypertension 0.01454 0.01454 0.00124 0.00124
infertility 0.00842 0.00842 0.00521 0.00521
Kidney disease 0.00059350 0.00059350 0.00176 0.00176
naFlD −0.00652 −0.00652 0.00150 0.00150
Osteoarthritis −0.00253 −0.00253 0.00337 0.00337
PCOs 0.00118 0.00118 0.00212 0.00212
Psychosis 0.00006296 0.00006296 0.00226 0.00226
Pulmonary embolism 0.00722 0.00722 0.00414 0.00414
sleep apnea −0.00153 −0.00153 0.00098117 0.00098117
substance use disorder −0.00729 −0.00729 0.00310 0.00310
Notes:aalso adjusted for sites (35 indicator variables; results not shown for brevity); broux-en-Y gastric bypass vs sleeve gastrectomy; cmeasured in the year prior to the surgery; dmodeled as a continuous variable; enumber of days between baseline weight measurement and index procedure.
Abbreviations: GERD, gastroesophageal reflux disease; NAFLD, nonalcoholic fatty liver disease; PCORnet, National Patient-Centered Clinical Research Network; PCOS,
polycystic ovarian syndrome; sE, standard error.
Clinical Epidemiology downloaded from https://www.dovepress.com/ by 118.70.13.36 on 20-Aug-2020
Dovepress Toh et al
demonstration of their validity is essential for encouraging their adoption in practice.
To our knowledge, this is also the first study that combined distributed regression with propensity scores to provide even more privacy protection and analytic flexibility than either approach alone. Specifically, the approach first condenses information from a large number of covariates into a single measure and then further processes the condensed individual-level information into highly summarized information.
Propensity scores are a data dimension reduction technique that can summarize a large number of individual covariates into a single, less identifiable scalar. Methods that leverage the property of propensity scores have been shown to produce results identical or highly comparable to those obtained from pooled individual-level data analysis.12–14 However, existing
propensity score-based approaches only support matched or stratified analysis when sharing summary-level information. In this study, we demonstrated the feasibility of adjusting for propensity scores via regression modeling using only summary-level information in a multicenter study. Existing distributed regression requires all participating sites to fit the same multivariable-adjusted regression model.18–20 By
combin-ing distributed regression with propensity scores, researchers now have the ability to adjust for different sets of covariates via site-specific propensity score models (more below).
Transparency and reproducibility in
distributed analysis
Without direct access to all the individual-level data from participating sites, researchers are required to specify all
the descriptive and inferential analyses a priori as part of the data request process. It is possible and advisable to inspect the data using summary-level information (eg, “Table 1” that describes the patient characteristics at each site) before final-izing the regression model. It is also recommended to include some sites that are able and willing to share individual-level data to test the analytic code before full distribution. As with pooled deidentified individual-level data analysis, it is feasible to fit multiple regression models as sensitivity or sec-ondary analyses, as we did in this study. By being completely explicit about the analysis, the distributed analytic approach minimizes the risk of data dredging and selective reporting. In other words, although the analytic approach used in this study may initially appear opaque to readers who are less familiar with the approach, it is actually more transparent and reproducible.
Distributed regression for other
generalized linear models
Although we only examined distributed linear regression, it is possible to conduct multivariable-adjusted distrib-uted analysis for other commonly used generalized linear models, including logistic, Poisson, and Cox proportional hazards model.18–20,29–32 Unlike linear regression, which can
be completed in a single computation step, the computation process of other regression models requires multiple iterative steps. The iterative process involves exchanging intermedi-ate statistics and interim parameter estimintermedi-ates between the analysis center and participating sites. Manual exchanges of this summary-level information can be too tedious and
Table 3 results from a linear regression model that adjusted for sites and confounders as propensity score deciles (Model 2) from 36 health systems participating in the PCOrnet Bariatric study
Variablea Parameter estimate SE
Pooled individual-level data analysis
Distributed regression Pooled individual-level data analysis
Distributed regression
Exposureb −0.05470 −0.05470 0.00113 0.00113
Ps stratum 1 reference reference reference reference
Ps stratum 2 −0.00754 −0.00754 0.00209 0.00209
Ps stratum 3 −0.00671 −0.00671 0.00210 0.00210
Ps stratum 4 −0.00717 −0.00717 0.00211 0.00211
Ps stratum 5 0.00034218 0.00034218 0.00212 0.00212
Ps stratum 6 −0.00583 −0.00583 0.00213 0.00213
Ps stratum 7 −0.00135 −0.00135 0.00214 0.00214
Ps stratum 8 −0.00435 −0.00435 0.00216 0.00216
Ps stratum 9 −0.00523 −0.00523 0.00218 0.00218
Ps stratum 10 −0.00812 −0.00812 0.00222 0.00222
Notes:aalso adjusted for sites (35 indicator variables; results not shown for brevity); broux-en-Y gastric bypass vs sleeve gastrectomy.
Abbreviations: PCOrnet, national Patient-Centered Clinical research network; Ps, propensity score; sE, standard error.
Clinical Epidemiology downloaded from https://www.dovepress.com/ by 118.70.13.36 on 20-Aug-2020
Dovepress Combining distributed regression with propensity scores
Table 4 results from a linear regression model that adjusted for sites and confounders as both individual covariates and propensity score deciles (Model 3) from 36 health systems participating in the PCOrnet Bariatric study
Variablea Parameter estimate SE
Pooled individual- level data analysis
Distributed regression
Pooled individual- level data analysis
Distributed regression
Exposureb −0.05355 −0.05355 0.00108 0.00108
age
20–44 −0.01668 −0.01668 0.00106 0.00106
45–64 reference reference reference reference
65–80 0.01364 0.01364 0.00218 0.00218
Male sex 0.02189 0.02189 0.00134 0.00134
race
White reference reference reference reference
Black 0.02917 0.02917 0.00132 0.00132
Other 0.00877 0.00877 0.00153 0.00153
hispanic ethnicity 0.00218 0.00218 0.00148 0.00148
Year of procedure
2005–2009 −0.00372 −0.00372 0.00241 0.00241
2010 −0.00352 −0.00352 0.00187 0.00187
2011 −0.00348 −0.00348 0.00146 0.00146
2012 reference reference reference reference
2013 0.00453 0.00453 0.00146 0.00146
2014 0.00683 0.00683 0.00157 0.00157
2015 0.03793 0.03793 0.00295 0.00295
Comorbidity scorec,d 0.00585 0.00585 0.00069368 0.00069368
Baseline weightc,d −0.00025150 −0.00025150 0.00000922 0.00000922
Baseline weight proximityd,e 0.00012628 0.00012628 0.00001507 0.00001507
smokingc −0.00653 −0.00653 0.00163 0.00163
Days of hospitalizationc,d 0.00018276 0.00018276 0.00006130 0.00006130
Diagnosis ofc
anxiety 0.00040061 0.00040061 0.00119 0.00119
Deep vein thrombosis 0.00272 0.00272 0.00530 0.00530
Depression 0.00403 0.00403 0.00107 0.00107
Diabetes 0.01859 0.01859 0.00115 0.00115
Dyslipidemia 0.00164 0.00164 0.00103 0.00103
Eating disorder −0.00226 −0.00226 0.00236 0.00236
gErD −0.00164 −0.00164 0.00097208 0.00097208
hypertension 0.01451 0.01451 0.00124 0.00124
infertility 0.00880 0.00880 0.00521 0.00521
Kidney disease 0.00055973 0.00055973 0.00176 0.00176
naFlD −0.00680 −0.00680 0.00150 0.00150
Osteoarthritis −0.00244 −0.00244 0.00337 0.00337
PCOs 0.00127 0.00127 0.00212 0.00212
Psychosis 0.00003263 0.00003263 0.00226 0.00226
Pulmonary embolism 0.00757 0.00757 0.00415 0.00415
sleep apnea −0.00177 −0.00177 0.00098965 0.00098965
substance use disorder −0.00745 −0.00745 0.00310 0.00310
Ps stratum 1 reference reference reference reference
Ps stratum 2 0.00180 0.00180 0.00204 0.00204
Ps stratum 3 0.00362 0.00362 0.00207 0.00207
Ps stratum 4 0.00058495 0.00058495 0.00211 0.00211
Ps stratum 5 0.00731 0.00731 0.00217 0.00217
Ps stratum 6 0.00056111 0.00056111 0.00223 0.00223
Ps stratum 7 0.00508 0.00508 0.00231 0.00231
Ps stratum 8 0.00383 0.00383 0.00242 0.00242
Ps stratum 9 0.00516 0.00516 0.00257 0.00257
Ps stratum 10 0.00336 0.00336 0.00285 0.00285
Notes:aalso adjusted for sites (35 indicator variables; results not shown for brevity); broux-en-Y gastric bypass vs sleeve gastrectomy; cmeasured in the year prior to the surgery; dmodeled as a continuous variable; enumber of days between baseline weight measurement and index procedure.
Abbreviations: GERD, gastroesophageal reflux disease; NAFLD, nonalcoholic fatty liver disease; PCORnet, National Patient-Centered Clinical Research Network; PCOS,
polycystic ovarian syndrome; Ps, propensity score; sE, standard error.
Clinical Epidemiology downloaded from https://www.dovepress.com/ by 118.70.13.36 on 20-Aug-2020
Dovepress Toh et al
labor-intensive to be practical in actual multicenter studies. However, there are a number of statistical packages and stand-alone software that enable researchers to perform distributed regression and partially or fully automate the file transfer process.19,20,31–33 We chose not to assess the operational
per-formance (eg, runtime) of our distributed regression analysis because it is highly network-dependent. Some multicenter studies have better (or less ideal) technical infrastructure to allow distributed regression to be conducted more (or less) efficiently.
Site-specific propensity score models vs a
“global” propensity score model
We fit site-specific propensity score models because pro-pensity scores are sensitive to the prevalence of exposure in the population under study. As the prevalence of bariatric procedures might vary across databases due to differences in clinical practice and other factors, patients from two dif-ferent sites might not be comparable even if they had the same propensity score value. In addition, a given covariate (eg, diabetes) may have different effects on the probability of receiving a specific bariatric procedure at different sites. Therefore, it is generally advisable to estimate propensity scores by site and perform the analysis accounting for data source, eg, match on propensity scores within site, stratify jointly on site-specific propensity scores and site, and include both propensity scores and site as regressors. However, it is not always possible to estimate propensity scores by site because some sites might be too small to accommodate a robust propensity score model. Indeed, the number of patients in some sites in the current study was too low to allow the conventional rule of requiring 7–10 “outcome events” (ie, exposed patients) per covariate in the propensity score model.34,35 In a distributed environment,
researchers have the ability to inspect the log or other summary-level output (eg, a patient characteristic table) to assess the feasibility of fitting site-specific propensity score models.
An alternative is to fit one propensity score model that adjusted for the confounders, site, and additional interaction terms between confounders and site, which was done in the primary analysis for this study.25 This allows sites that do
not have sufficient data to fit site-specific propensity score models to contribute their data to the analysis, with an addi-tional assumption that the global propensity score model is correctly specified. It is straightforward to fit such a model in the pooled individual-level data analysis. Although we did not do it here, in principle it would be possible to fit a global
propensity score model using distributed logistic regression. This is a topic for future research.
Some sites may have additional confounder informa-tion that can be included in the study. For example, some participating health systems in this study may have dietary information from patients who underwent bariatric proce-dure. For simplicity, we only adjusted for confounders that were available in all participating sites. It is straightforward computationally to include different sets of confounders in the site-specific propensity score models, but the use of different confounders across sites would need to be justified scientifically. Future studies should examine the strengths and limitations of allowing site-specific confounder lists.
limitations of distributed regression
approach
Although we were able to illustrate the statistical equiva-lence of the distributed linear regression approach to pooled individual-level data analysis for a one-time continuous outcome, we were not able to fully replicate the primary analysis in the main study, which used a linear mixed-effects model to simultaneously estimate the association between bariatric surgeries and percent total weight loss at 1, 3, and 5 years postsurgery.25 In the main study, the
estimated difference in percent weight loss at 1 year post-surgery was −5.9% comparing Roux-en-Y gastric bypass with sleeve gastrectomy. The results from the distributed linear regression analyses, which were between −5.3% and −5.5% across the three models, were comparable. We may have observed greater dissimilarities if we estimated a 3- or 5-year postsurgery difference where the advantages of using repeated measure analysis with a linear mixed-effects model are more pronounced due to missing data assump-tions being relaxed (eg, mixed-effects models assume that data are missing at random borrowing from more outcomes being measured). Distributed regression has not been fully developed for models that examine repeated outcomes or repeated exposures.
In addition, certain model diagnostics cannot currently be performed with summary-level information. For example, creating residual plots to examine the normality assumption in linear regression requires sharing of individual-level data. It is possible to introduce noise to the individual-level data but doing so could impact its fidelity.36 It is also more
challenging to identify or assess idiosyncratic data issues at participating sites without direct access to all individual-level data being analyzed. Enhancing the capability of dis-tributed regression to perform other tasks that can readily
Clinical Epidemiology downloaded from https://www.dovepress.com/ by 118.70.13.36 on 20-Aug-2020
Dovepress Combining distributed regression with propensity scores
be performed with individual-level data is another topic for future research.
Other privacy-protecting analytic and
data-sharing methods
Prior studies have demonstrated the feasibility and validity of using summary-level risk-set data to perform propensity score-matched and propensity score-stratified analysis.11–13
Recent work has explored the feasibility of conducting inverse probability-weighted analysis using risk-set data.37
Our study shows the feasibility of adjusting for propensity scores via modeling using only summary-level information in multicenter studies. In addition to summary score-based methods and distributed regression, meta-analysis of site-specific estimates is another analytic option that does not require sharing of individual-level data in a multicenter study. Studies have shown that meta-analysis produced results comparable to those from pooled individual-level data analysis.13–15,38 However, unlike distributed regression,
meta-analysis generally produces similar, but not identical, results to those from pooled individual-level data analysis.
Instead of using distributed regression, it would also be possible to request stratified counts of all unique com-binations of the confounders from participating sites to fit a regression model in a multicenter study. The approach requires all confounders to be binary or categorical vari-ables.39 It would be feasible to employ that approach for
Model 2, but not the other two models examined in the study because of the large number of confounders in these two models and because some of them were modeled as continuous variables.
Conclusion
We demonstrated the feasibility and empirical validity of performing distributed linear regression analysis for one-time linear outcomes within a large distributed data network and the feasibility and validity of combining distributed regression and propensity scores to offer addi-tional privacy protection and analytic flexibility. Along with other existing privacy-protecting analytic methods, distributed regression is a viable and valid analytic option that allows researchers to analyze data that may otherwise be inaccessible.
Availability of data and computing
code
The analytic code is available at https://github.com/ pcornet-analytics/bariatric.
Acknowledgments
The PCORnet Bariatric Study Collaborative includes key investigators and stakeholders who made substantial contri-butions to the manuscript as authors. The PCORnet Bariatric Study Collaborative authorship list includes: Sengwee Toh (Department of Population Medicine, Harvard Medical School and Harvard Pilgrim Health Care Institute), Robert Wellman (Kaiser Permanente Washington Health Research Institute), R Yates Coley (Kaiser Permanente Washington Health Research Institute), Casie Horgan (Department of Population Medicine, Harvard Medical School and Harvard Pilgrim Health Care Institute), Jessica Sturtevant (Depart-ment of Population Medicine, Harvard Medical School and Harvard Pilgrim Health Care Institute), Erick Moyneur ( Statlog Econometrics, Inc.), Cheri Janning (Duke Clinical and Translational Science Institute), Roy Pardee (Kaiser Permanente Washington Health Research Institute), Karen J Coleman (Kaiser Permanente Southern California), David Arterburn (Kaiser Permanente Washington Health Research Institute), Kathleen McTigue (Department of Medicine, University of Pittsburgh), Jane Anau (Kaiser Permanente Washington Health Research Institute), Andrea J Cook (Kai-ser Permanente Washington Health Research Institute); Joseph Vitello (Jesse Brown VA Medical Center); Elisha Malanga (COPD Foundation); Corrigan L McBride (Depart-ment of Surgery, University of Nebraska Medical Center); James McClay (University of Nebraska Medical Center); David Schlundt (Vanderbilt University); Cynthia Blalock (Vanderbilt University Medical Center); Tammy St Clair (patient partner); Joseph Nadglowski, Jr (Obesity Action Coalition); Anita P Courcoulas (University of Pittsburgh Medical Center); Marc Michalsky (Nationwide Children’s Hospital); Nirav Desai (Division of Gastroenterology, Hepa-tology, and Nutrition, Boston Children’s Hospital); Alberto Odor (University of California, Davis); William Richardson (Ochsner Clinic); Caroline M Apovian and William G Adams (Boston University School of Medicine/Boston Medical Center); Elizabeth Cirelli and Ali Tavakkoli (Brigham and Women’s Hospital); Roni Zeiger (Smart Patients, Inc.); Laura Rasmussen-Torvik (Northwestern University Feinberg School of Medicine); Gabrielle Purcell and Jeffrey Brown (Department of Population Medicine, Harvard Medical School, Harvard Pilgrim Health Care Institute); John H Holmes (Perelman School of Medicine, University of Penn-sylvania); Ana Emiliano (The Rockefeller University); Jona-than N Tobin (Clinical Directors Network and The Rockefeller University); Jeanne M Clark (Johns Hopkins University and Health Plan); Wendy Bennett (The Johns Hopkins University
Clinical Epidemiology downloaded from https://www.dovepress.com/ by 118.70.13.36 on 20-Aug-2020
Dovepress Toh et al
School of Medicine); Thomas H Inge (Children’s Hospital Colorado and University of Colorado, Denver); Lydia Bazzano (Tulane University School of Public Health and Tropical Medicine); Elizabeth Nauman (Louisiana Public Health Institute); Denise M Hynes (US Department of Vet-erans Affairs and Oregon State University); David Meltzer (The University of Chicago); Bipan Chand (Loyola Univer-sity Medical Center); Jeffrey J VanWormer (Marshfield Clinic Research Institute); Lindsay G Cowell (UT Southwestern Medical Center); Lawrence P Hanrahan (University of Wis-consin – Madison); Meredith Duke (University of North Carolina); Daniel M Herron (Icahn School of Medicine at Mount Sinai); Sameer Malhotra (Weill Cornell Medicine); Jiang Bian (University of Florida); Michelle R Lent (Geis-inger); Jennifer L Kraschnewski and Julie Tice (Penn State College of Medicine); Michael A Edwards (Lewis Katz School of Medicine at Temple University); Molly M Conroy (Division of General Internal Medicine, University of Utah); Matthew F Daley (Institute for Health Research, Kaiser Permanente Colorado); Michael Horberg (Kaiser Permanente Mid-Atlantic Permanente Research Institute); Jay R Desai (HealthPartners Institute); Stephanie L Fitzpatrick (Kaiser Permanente Center for Health Research); Douglas S Bell (Department of Medicine, David Geffen School of Medicine at UCLA, and UCLA Clinical and Translational Science Institute); Erin Roe (Baylor Scott & White Endocrine Center); Ellen P McCarthy (Beth Israel Deaconess Medical Center); Andrew O Odegaard (Department of Epidemiology, School of Medicine, University of California, Irvine); Neely A Wil-liams (Community Partners’ Network, Inc.); and Sameer Murali (Southern California Permanente Medical Group). Mr Nadglowski reports other support from the Obesity Action Coalition. Dr Apovian reports funding or other support from Nutrisystem, Zafgen Corporation, Sanofi-Aventis, Novo Nordisk, Scientific Intake, Merck, Johnson & Johnson, Xeno Biosciences, Bariatrix Nutrition Corp., Rhythm Pharmaceu-ticals, Orexigen, Takeda, GI Dynamics, Aspire Bariatrics, Myos, Science-Smart LLC, Vela Foundation, Dr. Robert C. and Veronica Atkins Foundation, Coherence Lab, Energesis and the NIH outside the submitted work. Dr Tavakkoli reports consulting support from Medtronic and AMAG pharmaceu-ticals, as well as grants from Sanofi Corporation outside the submitted work. The PCORnet® Study reported in this article
was conducted using PCORnet®, an initiative funded by the
Patient-Centered Outcomes Research Institute (PCORI). The study was funded by PCORI through PCORI Award OBS-1505-30683. The views expressed in this manuscript are solely those of the authors and do not reflect the views of PCORnet® or PCORI. The authors would like to acknowledge
the following individuals for their invaluable contributions to PCORnet and the PCORnet Bariatric Study: Stephen R Perry, Kin Lam, David Hawkes, Thomas Dundon, and Kelli Kinsman (Kaiser Permanente Washington Health Research Institute); Shelly Sital (The Chicago Community Trust); Elizabeth Tarlov (University of Illinois at Chicago); Jasmin Phua (Medical Research Analytics and Informatics Alliance); Mia Gallagher, Lindsey Petro, and Beth Syat (Harvard Pil-grim Health Care Institute and Harvard Medical School); Prakash Nadkarni and Elizabeth Chrischilles (University of Iowa); Steffani Roush, Robert Greenlee, and Laurel Verhagen (Marshfield Clinic Research Institute); Umberto Tachincard (University of Wisconsin); Phillip Reeder, Shiby Antony, Rania AlShahrouri (University of Texas – Southwestern Medical Center); James Campbell, Russell Buzalko, and Jay Pedersen (University of Nebraska Medical Center); Russel Waitman and Dan Connolly (University of Kansas Medical Center); Russel Rothman, David Crenshaw, and Katie Worley (Vanderbilt University Medical Center); Emily Pfaff, Robert Bradford, Kellie Walters, Tim Carey, Timothy Farrell, and D Wayne Overby (University of North Carolina); Maija Neville-Williams and Rhonda G Kost (The Rockefeller University); Elizabeth Shenkman, William Hogan, Kathryn McAuliffe, and Gigi Lipori (University of Florida); Rebecca Zuvich Essner (Florida Hospital); Howard Su, Michael George, Michael J Becich, Barbara Postol, Giselle G Hamad, Ramesh C Ramanathan, Bestoun H Ahmed, William F Gourash, Bill Shirey, Chuck Borromeo, and Desheng Li (University of Pittsburg); Anthony T Petrick, Ilene Ladd, Preston Biegley, H Lester Kirchner (Geisinger); Daniel E Ford, Michael A Schweitzer, Karl Burke, Harold Lehmann, Megan E Gauvey-Kern, and Diana Gumas (Johns Hopkins); Rachel Hess, Meghan Lynch, and Reid Holbrook (University of Utah); Jody McCullough, Matt Bolton, Wenke Hwang, Cynthia Chuang, Ann Rogers, and Alison Bower (Penn State); Cecilia Dobi, Michael Edwards, Mark Weiner, Anuradha Paranjape, Sharon J Herring, and Patricia Bernard (Temple University); Janet Zahner, Parth Divekar, Keith Marsolo, and Lisa Boerger (Cincinnati Children’s Hospital); Kimberly J Holmquist (Kaiser Permanente Southern California); Ray Pablo, Roni Bracha, and Robynn Zender (University of California at Irvine); Lucila Ohno-Machado, Paulina Paul, and Michele Day (University of California, San Diego); Thomas Carton, Elizabeth Crull, and Iben McCormick-Ricket (Louisiana Public Health Institute); Ashley Vernon, Malcom Robinson, Scott Shikora, David Spector, Eric Sheu, Edward Mun, Mat-thew Hutter, Shawn Murphy, Jeffrey Klann, and Denise Gee (Partners Healthcare); Daniel Jones, Benjamin Schneider, Griffin Weber, and Robert Andrews (Beth Israel Deaconess
Clinical Epidemiology downloaded from https://www.dovepress.com/ by 118.70.13.36 on 20-Aug-2020
Dovepress Combining distributed regression with propensity scores
Medical Center); Donald Hess, Brian Carmine, Miguel Burch, and Galina Lozinski (Boston Medical Center); Ken Mandl, Jessica Lyons, and Margaret Vella (Harvard Medical School); and Joseph Skelton and Kun Wei (Wake Forest Integrated Health System).
Disclosure
Dr Arterburn reports NIH funding outside the submitted work. Mr Moyneur reports StatLog was paid consulting fees to conduct study programming. All authors received funding from PCORI to support the submitted work. The authors report no other conflicts of interest in this work.
References
1. Behrman RE, Benner JS, Brown JS, McClellan M, Woodcock J, Platt R. Developing the Sentinel System--a national resource for evidence development. N Engl J Med. 2011;364(6):498–499.
2. Collins FS, Hudson KL, Briggs JP, Lauer MS. PCORnet: turning a dream into reality. J Am Med Inform Assoc. 2014;21(4):576–577. 3. Richesson RL, Hammond WE, Nahm M, et al. Electronic health records
based phenotyping in next-generation clinical trials: a perspective from the NIH Health Care Systems Collaboratory. J Am Med Inform Assoc. 2013;20(e2):e226–e231.
4. Sankar PL, Parker LS. The Precision Medicine Initiative’s All of Us Research Program: an agenda for research on its ethical, legal, and social issues. Genet Med. 2017;19(7):743–750.
5. Suissa S, Henry D, Caetano P, et al; Canadian Network for Observational Drug Effect Studies (CNODES). CNODES: the Canadian Network for Observational Drug Effect Studies. Open Med. 2012;6(4):e134–e140. 6. Reynolds RF, Kurz X, de Groot MC, et al. The IMI PROTECT project: purpose, organizational structure, and procedures. Pharmacoepidemiol Drug Saf. 2016;25(Suppl 1):5–10.
7. Simon GE, Coronado G, DeBar LL, et al. Data Sharing and Embedded Research. Ann Intern Med. 2017;167(9):668–670.
8. Brown JS, Holmes JH, Shah K, Hall K, Lazarus R, Platt R. Distributed health data networks: a practical and preferred approach to multi-institutional evaluations of comparative effectiveness, safety, and quality of care. Med Care. 2010;48(6 Suppl):S45–S51.
9. Toh S, Platt R, Steiner JF, Brown JS. Comparative-effectiveness research in distributed health data networks. Clin Pharmacol Ther. 2011;90(6):883–887.
10. Mazor KM, Richards A, Gallagher M, et al. Stakeholders’ views on data sharing in multicenter studies. J Comp Eff Res. 2017;6(6):537–547. 11. Rassen JA, Avorn J, Schneeweiss S. Multivariate-adjusted
pharma-coepidemiologic analyses of confidential information pooled from multiple health care utilization databases. Pharmacoepidemiol Drug Saf. 2010;19(8):848–857.
12. Toh S, Gagne JJ, Rassen JA, Fireman BH, Kulldorff M, Brown JS. Confounding adjustment in comparative effectiveness research con-ducted within distributed research networks. Med Care. 2013;51(8 Suppl 3):S4–S10.
13. Toh S, Shetterly S, Powers JD, Arterburn D. Privacy-preserving analytic methods for multisite comparative effectiveness and patient-centered outcomes research. Med Care. 2014;52(7):664–668.
14. Toh S, Reichman ME, Houstoun M, et al. Multivariable confounding adjustment in distributed data networks without sharing of patient-level data. Pharmacoepidemiol Drug Saf. 2013;22(11):1171–1177. 15. Platt RW, Dormuth CR, Chateau D, Filion K. Observational Studies of
Drug Safety in Multi-Database Studies: Methodological Challenges and Opportunities. EGEMS (Wash DC). 2016;4(1):1221.
16. Karr AF, Lin X, Sanil AP, Reiter JP. Secure Regression on Distributed Databases. J Comput Graph Stat. 2005;14(2):1–18.
17. Fienberg SE, Fulp WJ, Slavkovic´ AB, Wrobel TA. “Secure” log-linear and logistic regression analysis of distributed databases. Lect Notes Comput Sci. 2006;2006(4302):277–290.
18. Wolfson M, Wallace SE, Masca N, et al. DataSHIELD: resolving a conflict in contemporary bioscience-performing a pooled analysis of individual-level data without sharing the data. Int J Epidemiol. 2010;39(5):1372–1382.
19. El Emam K, Samet S, Arbuckle L, Tamblyn R, Earle C, Kantarcioglu M. A secure distributed logistic regression protocol for the detection of rare adverse drug events. J Am Med Inform Assoc. 2013;20(3): 453–461.
20. Wu Y, Jiang X, Kim J, Ohno-Machado L. Grid Binary LOgistic REgres-sion (GLORE): building shared models without sharing data. J Am Med Inform Assoc. 2012;19(5):758–764.
21. Meeker D, Jiang X, Matheny ME, et al. A system to build distributed multivariate models and manage disparate data sharing policies: imple-mentation in the scalable national network for effectiveness research. J Am Med Inform Assoc. 2015;22(6):1187–1195.
22. Fleurence RL, Curtis LH, Califf RM, Platt R, Selby JV, Brown JS. Launching PCORnet, a national patient-centered clinical research network. J Am Med Inform Assoc. 2014;21(4):578–582.
23. PCORnet Common Data Model (CDM). Available from: http://www. pcornet.org/pcornet-common-data-model/. Accessed April 26, 2018. 24. Toh S, Rasmussen-Torvik LJ, Harmata EE, et al. The National
Patient-Centered Clinical Research Network (PCORnet) Bariatric Study Cohort: Rationale, Methods, and Baseline Characteristics. JMIR Res Protoc. 2017;6(12):e222.
25. Arterburn D, Wellman R, Emiliano A, et al. Comparative effectiveness and safety of bariatric procedures for weight loss: A PCORnet cohort study. Ann Intern Med. Epub 2018 Oct 31.
26. Gagne JJ, Glynn RJ, Avorn J, Levin R, Schneeweiss S. A combined comorbidity score predicted mortality in elderly patients better than existing scores. J Clin Epidemiol. 2011;64(7):749–759.
27. Lunceford JK, Davidian M. Stratification and weighting via the pro-pensity score in estimation of causal treatment effects: a comparative study. Stat Med. 2004;23(19):2937–2960.
28. Bang H, Robins JM. Doubly robust estimation in missing data and causal inference models. Biometrics. 2005;61(4):962–973.
29. Fienberg SE, Karr AF, Nardi Y, Slavković AB. Secure logistic regression with multi-party distributed databases. Proceedings of the 56th Session of the ISI. The Bulletin of the International Statistical Institute; Alexandria, VA. 2007; 3506–3513.
30. Slavkovic´ AB, Nardi Y, Tibbits MM. Secure logistic regression of hori-zontally and vertically partitioned distributed databases. Proceedings of Workshop on Privacy and Security Aspects of Data Mining. Washington, DC: IEEE Computer Society Press; 2007; 723–728.
31. Lu CL, Wang S, Ji Z, et al. WebDISCO: a web service for distributed cox model learning without patient-level data sharing. J Am Med Inform Assoc. 2015;22(6):1212–1219.
32. Gaye A, Marcon Y, Isaeva J, et al. DataSHIELD: taking the analysis to the data, not the data to the analysis. Int J Epidemiol. 2014;43(6):1929–1944. 33. Her QL, Malenfant JM, Malek S, et al. A query workflow design to
perform automatable distributed regression analysis in large distributed data networks. EGEMS (Wash DC). 2018;6(1):11.
34. Cepeda MS, Boston R, Farrar JT, Strom BL. Comparison of logistic regression versus propensity score when the number of events is low and there are multiple confounders. Am J Epidemiol. 2003;158(3):280–287. 35. Peduzzi P, Concato J, Kemper E, Holford TR, Feinstein AR. A simula-tion study of the number of events per variable in logistic regression analysis. J Clin Epidemiol. 1996;49(12):1373–1379.
36. Kargupta H, Datta S, Wang Q, Sivakumar K. On the privacy preserving properties of random data perturbation techniques. Paper presented at: Third IEEE International Conference on Data Mining 2003; Melbourne, Florida.
Clinical Epidemiology downloaded from https://www.dovepress.com/ by 118.70.13.36 on 20-Aug-2020
Dovepress
Clinical Epidemiology
Publish your work in this journal
Submit your manuscript here: https://www.dovepress.com/clinical-epidemiology-journal
Clinical Epidemiology is an international, peer-reviewed, open access, online journal focusing on disease and drug epidemiology, identifica-tion of risk factors and screening procedures to develop optimal pre-ventative initiatives and programs. Specific topics include: diagnosis, prognosis, treatment, screening, prevention, risk factor modification,
systematic reviews, risk and safety of medical interventions, epidemiol-ogy and biostatistical methods, and evaluation of guidelines, translational medicine, health policies and economic evaluations. The manuscript management system is completely online and includes a very quick and fair peer-review system, which is all easy to use.
Dove
press
Toh et al
37. Yoshida K, Gruber S, Fireman BH, Toh S. Comparison of privacy-protecting analytic and data-sharing methods: A simulation study.
Pharmacoepidemiol Drug Saf. 2018;27(9):1034–1041.
38. Rassen JA, Solomon DH, Curtis JR, Herrinton L, Schneeweiss S. Pri-vacy-maintaining propensity score-based pooling of multiple databases applied to a study of biologics. Med Care. 2010;48(6 Suppl):S83–S89.
39. Cook AJ, Wellman RD, Shoaibi A, Nelson JC. Feasibility of new Mini-Sentinel group sequential monitoring methods in a distributed setting – Implementation in practice. Available from: https://www. sentinelinitiative.org/sites/default/files/Methods/Mini-Sentinel_New-Mini-Sentinel-Group-Sequential-Methods_Distributed-Data-Setting_0. pdf. Accessed January 12, 2018.
Clinical Epidemiology downloaded from https://www.dovepress.com/ by 118.70.13.36 on 20-Aug-2020