Separation of Negatively Charged TiO
2-coated Polystyrene Beads in Microfluidic
Device
Chalinee Phiphatanaphiphop,1Komgrit Leksakul,1*
Rungrueang Phatthanakun,2 Wutthikrai Busayaporn,2Chatree Saiyasombat,2 Pat Phothongkam,2Isa Anshori,3MdMohosin Rana,3 Hiroaki Suzuki,3
1
Graduate Program in Industrial Engineering, Department of Industrial Engineering, Faculty of Engineering, Chiang Mai University, Thailand 50200
2Synchrotron Light Research Institute (Public Organization), 111 University Avenue NakhonRatchasima, Thailand 30000
3
Graduate School of Pure and Applied Sciences, University of Tsukuba, 1-1-1 Tennodai, Tsukuba, Ibaraki, 305-8573, Japan
Corresponding author *: E-mail address: [email protected]
Abstract
charged TiO2-coated Ps-beads can be established as testified samples for development of other microfluidic devices.
Keywords: microfluidic, microelectrodes, negatively charged, TiO2, assisted reproductive technology
1. Introduction
Assisted Reproductive Technology (ART) gains more importance at the present time as it assists people who have infertility issues to be successful in their attempts to have biological children. In most of the cases, the infertility concerns the problem of inability of sperms to fertilize an oocyte naturally [1]. Intracytoplasmic sperm injection (ICSI) and traditional in vitro fertilization (IVF) were introduced as solutions to this problem. However, ICSI and IVF are not applicable in cases of low sperm count, low sperm motility, or cryopreserved samples of sperm with reduced motility [2-4]. Furthermore, the success of these techniques is highly subjective and dependent on the skill of the embryologist. To improve the rate of success, microfluidic systems have been proposed as bio-sensing devices for sorting, manipulation, detection, and characterization of sperms [5-9]. With regard to sorting of sperms for sexual selection in fertilization, [10] reported evidence of slight difference in the electrical charge caused the variation of electrophoretic mobility between sperms those carrying chromosome X and Y. Therefore, fabrication of microfluidic devices thatare capable of sorting sperms for sexual selection becomes a significant topic [11]. In this work, fabrication of microfluidic devices installed with microelectrodes in order to make them capable of separating sperms is reported. However, to avoid ethical problems and difficulties to utilize the devices with real sperms in the development stage, device examination has been conducted withnegatively charged TiO2-coated Polystyrene beads (TiO2-coated Ps-beads). Methods to create negativelycharged TiO2 -coated Ps-beadsalso are presented . After that, the Ps-beads were characterized by various characterization techniques. Then, simulation and fabrication of the microfluidic devices have been shown. Finally, the microfluidic deviceswith microelectrodes wereexaminedto separate the negativelycharged TiO2-coated Ps -beads to evaluate percentage of validities.
2. Materials and methods
2.1.
Fabricated TiO
2-coated Ps-beads
Eppendorf tube). Then, the tube was centrifuged for 15 sec and the supernatant was removed. Finally, DI 1 ml of DI water was added to make the stock of TiO2-coated Ps-beads.
2.2.
Characterization of TiO
2-coated Ps-beads
2.2.1.
XRD and SEM-EDS
Crystalline structure and phase identification of TiO2-coated Ps-beads were examined by XRD experiment using a RigakuSmartLab9KW with Cu Kα radiation (λ = 1.5406 Å) to generate X-rays with a voltage of 40 kV and a current of 30 mA. Parallel beam mode was employed with incident slit at 1mm width, length limit slit at 10mm, and receiver slit at 20mm. The XRD patterns were collected from 5°to 80° with increments of 0.02° and a scan rate of 3.0°/min. Tungsten scanning electron microscopy (W-SEM) was performed by FEI at 20 kV acceleration voltage. The W-SEM images were captured under secondary electron mode in a high vacuum environment. Note that the pictures of the surfaces have been captured without any deposited element on the sample, which presentsthe electrical conductivity of the surface. Furthermore, energy-dispersive X-ray spectroscopy (EDS) mode was employed for elemental investigation of specific areas of the surface.
2.2.2.
XAS
The oxidation state and local structure of TiO2-coated PS-beads were determined by X-ray absorption spectroscopy (XAS) at beamline BL1.1w, equipped with an Si (111) double-crystal
monochromator, of the Synchrotron Light Research Institute (SLRI), Thailand. The SLRI storage ring was
operated at an electron energy of 1.2 GeV with the electron beam current in the range of 140–80 mA. The spectra near the Ti K-edges were measured in the transmission mode at room temperature using Ti foil, Ti2O3, rutile-TiO2, and anatases-TiO2 as references.
2.3.
Microfluidic device fabrication
2.3.1.
Design and simulation
The design of the structure for separationthe negativelycharged Ps-beads mimic the character of Y -shape structure. The Comsol® program was applied for simulation of the electrical field and flow of microfluidic by using mode electrostatics (es), Transport of Diluted Species (tds) and laminar flow, respectively. The simulationswere calculated according to the Reynolds number equation as following;
Re UL
where ρ is the fluid density, U is a characteristic velocity of the flow, L is a characteristic dimension of the device (mm) and μ is the fluid viscosity (1 mPa s).
While, electric displacement field nodes is established by the following electric-displacement boundary condition;
0
n D n D , (2) where Eq. (2) specified the normal component of the electric displacement field at a boundary and D0 is the boundary electric displacement field (C/m2).
In addition, calculation of fluidic transportation depends on convection and diffusion. The transportation of diluted species which considered as ionic species at interface is calculated based on migration in electric fields. Finally, themass balance has been taken into the calculation as follows:
D ci i z u Fc Vi m i, i
ci 0 , (3)
where ci denotes the concentration of species i (mol/m3), Di is thediffusion coefficient of species i (m2/s), u is the fluid velocity (m/s),F refers to Faraday’s constant (s·A/mol), V denotes the electric potential (V), zi is the charge number of the ionic species (unitless), and um,i is ionicmobility (s·mol/kg).
The structure of microfluidic devices weredesigned by the Layout editor® program with various different distances between the electrodes; 30µm, 50µm, 100µm, and 200 µm then named with type A to D, respectively. Theparameters setting were presented as in Table 1. Thenall structure (type A to D) were exported into Comsol® program and were analyzedby the Eq. (1) - (3). Finally, the electrical displacement field (c/m2) were calculated by the program
ใ
Table1. Parameters setting in each types to designed the microfluidic devices used in Layout editor® and
Comsol®.
Type Electrode
(mm)
Microchannel
(mm)
Voltage
(V)
Distance between electrodes
(µm)
Width Height Width Height
A 0.5 5 0.1 6 1 30
B 0.5 5 0.1 6 1 50
C 0.5 5 0.15 6 1 100
2.3.2.
Photolithography process
The microfluidic devices integrated with the microelectrodes were fabricated by UV and soft lithography process, as illustrated inFigure 1. Cr/Pt layers were deposited on substrate by sputtering and UV patterning to make electrode patterns followed by lift-offtechnique to achieve the final form of electrodes, as shown inFigure 1 (a). The spin-coated of positive photoresist (S-1818G) at 500 rpm for5 sec and 2000 rpm for10 sec were employed. Then, the samples were baked in an oven for 30 min at 80°C and cooled down to room temperature for 15 min. UV mask to pattern the electrodes has been aligned andwas irradiated with UV for 40 sec using mask aligner exposure. Next, the pattern was lifted off using toluene, which was warmed up to 30°C inwater bath, to soak the substratefor 30 sec. After that, the substrate was developed by using micropositTM MF-319 developer for 1 min. The sputteredCr and Pt film was depositedon the substrate and lifted off by immersing in acetone for 1 hr. To create the microchannel, UV exposure was performed on the SU-825,negativephotoresistand was developed to achieve the master mold for PDMS replication. The SU-8 25 was spin-coatedon lime glass substrate to obtain film atthickness of 40 µm using the following conditions; 500 rpm for5sec, then gradually increase the speed for 10 sec to reach 1,250 rpm thenremain at this speed for10 sec. The pattern of microchannel was aligned and exposedby UV for 180 sec. After that, it was developed by SU-8 developer twotimesfor 10 min and 20 min, respectively. Then Isopropyl alcohol
(IPA) has been used for the final wash for 1 min. Therefore, the SU-8 25 has been fabricated as the mold. Next, the PDMS replicate was mixedby using PDMS precursor (KE-1300T) for 15g and PDMS curing agent
(a)
(
b
)
Figure 1. An illustration of the fabrication process of UV and soft lithography. (a) The microelectrodes’ fabrication procedure and
(b) the microchannels’ fabrication procedure.
3. Result and Discussion
3.1.
TiO
2-coated Ps-beads
3.1.1.
XRD and SEM-EDS
spectra of Ti and O in the area labeled as asolid red rectangle. In thedotted red rectangle area, there is no sign of Ti.
Figure 2. (a) The SEM image of TiO2-coated Ps-beads at 5000× of magnitude. (b) 20000× magnitude of area labeled by the white
rectangle in (a). SEM-EDS was used for elemental analysis for investigationof areas labeled using solid red and dotted red
rectangles.
3.1.2.
XAS
The XAS spectra of TiO2-coated Ps-beads has absorption edge at 4979 eV which matches with the absorption edge of anatase-TiO2 and rutile-TiO2. Therefore, the oxidation number of the TiO2-coated Ps
beads clearly is Ti4+. The pre-edge feature at around 4970 eV is
bound-state transition, such as the 1s → 3d transition [12]. The pre-edge of TiO2-coated Ps-beads is located at 4971 eV with 0.21 normalized pre-edge height. The position and height of the pre-edge feature directly correspond to the six-fold coordinated Ti [12 -13].
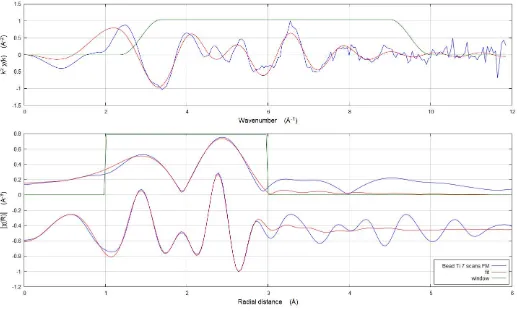
Figure 5. The k2χ (k) functions (a) and the corresponding amplitude and real part of Fourier transforms (FT) (b) of TiO
2-coated Ps
-beads. The red lines represent the simulations using the parameters shown in Table 2.
indicated that the Ti could be in the tetrahedral site and the octahedral site. However, it is more likely that Ti was in the six-fold, coordinated as evaluated from XANES. The result leads to the conclusion that the TiO2 coated on the surface was in the amorphous form and that itis mostly in the Ti4+ state with high surface area.
This might be the factor that caused the negative charge to be able to appear on the surface for a long term.
Table 2. Ti K-edge EXAFS Fitted Parameters of TiO2-coated PS-beads
Path Ndegen R (Å) σ2 (10-3Å2) E0 (eV) Ti–O 5.7 ± 2.4 2.05 ± 0.02 24 ± 10 -0.04 ± 2.00 Ti–Ti 1.0a 2.54 ± 0.03 9 ± 1 -0.04 ± 2.00 Ti–Ti 3.0a 3.02 ± 0.02 9 ± 1 -0.04 ± 2.00
aValues without uncertainties were not determined in the fit but were held at the given value.
3.2.
Microfluidic devices
3.2.1. Comsol® simulation
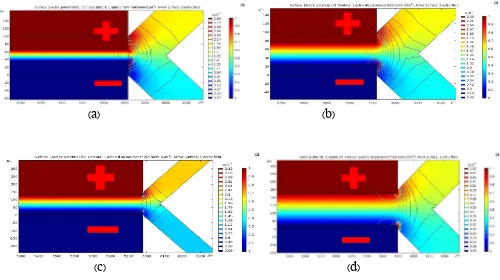
Simulation with the Comsol® program for finding out the optimal model of microfluidic devices was conducted. The result in term ofelectric displacement field from simulation at eachdistancesbetween the electrodes at 30µm, 50µm, 100µm, and 200 µm were 2.88 × 10⁻⁷, 2.33 × 10⁻⁷, 3.32 × 10⁻⁷, and 1.02 × 10⁻⁷ C/m2, respectively, as can be seen in Figure6.
(
a
) (
b
)
Figure 6. The result of the simulation by the Comsol® programexhibit the variation of electric displacement field at different
distances between the microelectrodes.
3.2.2. Device examination: separation of TiO2-coated Ps-beads
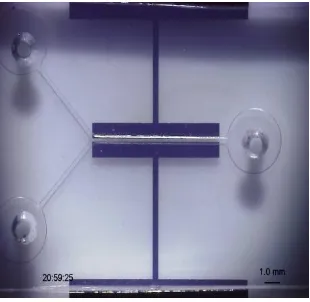
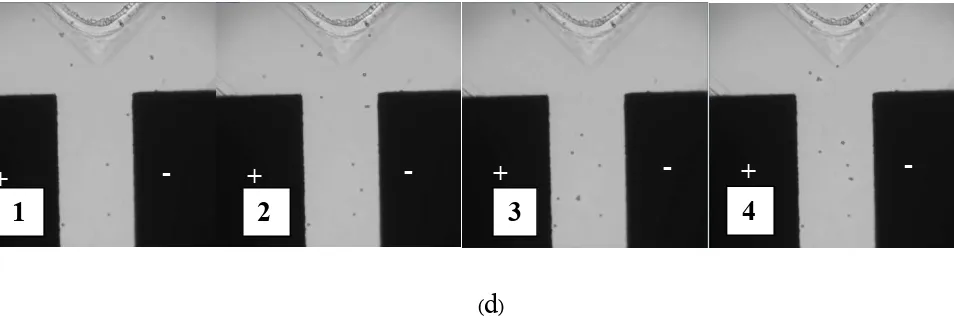
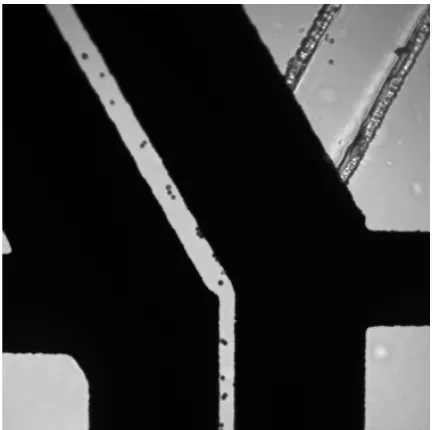
The microfluidic chip was fabricated by photolithography process and composed of microelectrodes and microchannel as presented inFigure 7. The experiments were divided into four sets based on the different distances between the microelectrodes. The set-up of each experiments were made under microscope and the video fileswererecordedto investigate the performance of microfluidic devices. The video file has been presented as the supporting information (S-1) . When the microfluidic devices were connected to the potentiostat to apply the potential at 1 V for 1 min, the negatively chargedTiO2-coated Ps -beads wereattracted by the positive electric field in the area between the two electrodes. After that the Ps -beads were diverged to thefollowing microchannel, as demonstrated inFigure. 8. Noted that the flow rate of fluid is at 0.1L/sec. The examinations were repeated for10 times. The resultshowed that the microfluidic device with the 100m distance between the microelectrodes exhibits the highest performanceat 86.96% validation for the separation of negativelycharged TiO2-coated Ps-beads as shown inTable 3.
(
a
)
(
b
)
(
c
)
+
-
+
-
+
-
+
-+
-
+
-
+
-
+
-+
-
+
-
+
-
+
-1
2
3
4
1
2
3
4
(
d
)
Figure 8. Examination of microfluidic devices with the negatively charged TiO2-coated Ps beads with Ps-bead size 5.98µm
diameter. (a)-(d) represent the microfluidic devices with various distances between the microelectrodes from 30, 50, 100, 200m,
respectively. Fig. (1) at each device represents stage of devices with no electricity supplied, and Fig. (2) – (4) of each device were
recorded after 1V potential is applied at the average time of 0.15, 0.40 and 0.51 sec, respectively.
Table 3.Validations of separation the negatively charged TiO2-coated Ps-beads with various distances
between the microelectrodes of microfluidic devices.
Distance of Electric fields
(µm)
Electrical displacement
field (c/m2)
Moving left Moving right Validation
30 2.88 x 10⁻⁷ 17 3 82.35%
50 2.33 x 10⁻⁷ 20 5 75.00%
100 3.32 x 10⁻⁷ 23 3 86.96%
200 1.02 × 10⁻⁷ 19 8 57.89%
Moreover, another design of the microfluidic device has been established based on the previous designed 100 m distance between the microelectrodes. The device is simplified to be single path. The structure is designed as shown in Figure 9. The result of examination of the single path device shows improved percentage of validation at 92.59% as shown in the table 4.
+
-
+
-
+
-
+
Figure 9. Examination of single path microfluidic devices with the negatively charged TiO2-coated Ps beads with Ps-bead
size 5.98µm diameter
Table 4. .Validation of separation the negatively charged TiO2-coated Ps-beads with the single path model of the microfluidic device.
Structure Left Right Validate
Single path with 100 µm distances between the electrodes
45 2 92.59%
4.
Conclusion
To avoid the ethical problems for examination the microfluidic devices with actual spermatozoa, negativelycharged TiO2-coated Ps-beads were crafted by sputtering andO2plasma techniques. The beads were characterized using XRD, SEM-EDS, and XAS. XRD reveals the amorphous structure on the surface of the Ps-beads. SEM images revealed that the beads were partly coated with thin shell of TiO2which is confermed with SEM-EDS elucidated the elemental identification of Ti and O in the coated area but cannot detect Ti anywhere else. Furthermore, structural analysis using XAS reported the TiO2 on the Ps-beads to be likely in the amorphous form of Ti4+ consistence with the result of XRD. The structure of the mixed
simulated and fabricated with various distances between the electrodes at 30, 50, 100, 200 m, respectively. After applying with 1 V electricity, the chip with100 m distance between the microfluidic device exhibited excellent capability to separatethe negatively charged TiO2-coated Ps-beadswith 86.96% of validationand induced them into the different path of microchannel. Moreover the single path prototype of microfluidic device with 100 m distance between the microelectrodes has been established. The percentage of validation of this device is improved to be 92.59% . Later these microfluidic devices can be tested with the actual sperm for purpose of sexual separation.
Acknowledgments
The Thailand Research Fund (TRF), through the Research and Researchers for Industries (RRI), PhD Program (PHD5710053),provided the financial support.
References
[1] Keith A, Frey MD 2010 Male reproductive health and infertility Primary Care. 37: 643.
[2] Cooper TG, Noonan E, von Eckardstein S, Auger J, Baker HW, Behre HM, Haugen TB, Kruger T, Wang C, Mbizvo MT, Vogelsong KM 2010 World Health Organization reference values for human semen characteristics Hum. Report. Update. 16: 231.
[3] Palermo G, Joris H, Devroey P, Van Steirteghem AC 1992 Pregnancies after intracytoplasmic injection of single spermatozoon into an oocyte Lancet. 340:17.
[4] O’Connell M, McClure N, Lewis S.E.M. 2002 The effects of cryopreservation on sperm morphology, motility and mitochondrial function Hum. Reprod. 17:704.
[5] Yan G, Wenjie L, Dimitri P 2013 Recent advances in microfluidic cell separations Analyst. 138:4714.
[6] Yi Z, John N, Yuan W, Yu S 2013 Recent advances in microfluidic techniques for single-cell biophysical characterization Lab Chip. 13:2464.
[7] Niels H, Sebastian C.B, Flavio H, Andrea H 2014 Characterization of subcellular morphology of single yeast cells using high frequency microfluidic impedance cytometer Lab Chip. 14:369.
[8] Urban S, Shady G, Robert J, Arnaud B, Philippe R 2004 Cell immersion and cell dipping in microfluidic devices Lab Chip. 4:148.
[10] Ute Engelmann, Franz Krassnigg, Harald Schatz, and Wolf-Bernhard Schill, 1988 Separation of Human X and Y Spermatozoa by Free-Flow Electrophoresis, Gamete Research 19:151-159.
[11] Lang Rao, Bo Cai, Jieli Wang, QianfangMeng, Chi Ma, Zhaobo He, Junhua Xu,Qinqin Huang, Shasha Li, Yi Cen, ShishangGuo, Wei Liu, and Xing-zhong Zhao, 2015 A microfluidic electrostatic separator based on pre-charged droplets, Sensors and Actuators B 210: 328-335
[12] Farges, François, Gordon E. Brown Jr, and John J. Rehr. Coordination chemistry of Ti(IV) in silicate glasses and melts: I. XAFS study of titanium coordination in oxide model compounds.Geochimica et
Cosmochimicaacta 60, no. 16 (1996): 3023-3038.
[13] Farges, François, Gordon E. Brown, and J. J. Rehr. Ti K-edge XANES studies of Ti coordination and disorder in oxide compounds: Comparison between theory and experiment. Physical Review B 56, no. 4