AN ANALYSIS TO WEALTH DISTRIBUTION BASED ON
SUGARSCAPE MODEL IN AN ARTIFICIAL SOCIETY
Arash Rahman
Department of Computer, Faculty of Engineering Science and Research Branch, Islamic Azad University
Tehran, Iran [email protected]
Saeed Setayeshi* and Mojtaba Shamsaei Zafarghandi
Faculty of Nuclear Engineering and Physics, Amirkabir University of Technology Tehran, Iran
[email protected] - [email protected]
*Corresponding Author
(Received: August 14, 2007 - Accepted in Revised Form: November 22, 2007)
Abstract In this paper an artificial society is being assumed as a multi agents system. A sugarscape model consisting of a cellular landscape of resources is used to form an interaction among the agents of the population. In the model, agents find the resources to survive. They are supposed to move and search and because of this movement, an evolutionary social behavior will develope. From model analysis view point this behavior should be parameterized and also optimized. To analyze the said assumption, each agent should gather and store as much sugar as possible to create an asset for itself. Hence, From the simulation result, the population be categorized based on the asset. In the society, wealth may be allocated based on the asset, gathered by the agents. The percentage of population who will possesses some percentage of the wealth is specified. The simulation shows that in an artificial life, it is possible to use the sugarscape model to optimize the behavior of a society, and the parameters of the model are predictable as well.
Keywords Artificial Life, Artificial Society, Sugarscape Model, Agent Based Modeling, Wealth Distribution
ﻩﺪﻴﻜﭼ
ﻲﻣﻪﺘﻓﺮﮔ ﺮﻈﻧ ﺭﺩ ﻪﻠﻣﺎﻋﺪﻨﭼ ﻲﻤﺘﺴﻴﺳﻥﺍﻮﻨﻋ ﻪﺑ ﻲﻋﻮﻨﺼﻣ ﻪﻌﻣﺎﺟ ﻚﻳ ﻪﻟﺎﻘﻣﻦﻳﺍ ﺭﺩ ﺩﻮﺷ
. ﻝﺪﻣ ﻚﻳ
ﺖﺳﺍﻩﺪﺷﻩﺩﺎﻔﺘﺳﺍﻲﺘﻴﻌﻤﺟ ﻞﻣﺍﻮﻋﻦﻴﺑ ﺎﻣﻲﻓﻞﻣﺎﻌﺗﻞﻴﻜﺸﺗﻱﺍﺮﺑﻲﻟﻮﻠﺳﻊﺑﺎﻨﻣﻞﻣﺎﺷﻱﺪﻨﻗﻱﺎﻀﻓ .
ﻝﺪﻣﻦﻳﺍﺭﺩ
ﻲﻣﺀﺎﻘﺑﻱﺍﺮﺑﺍﺭﻊﺑﺎﻨﻣ،ﻞﻣﺍﻮﻋ ﺪﻨﺑﺎﻳ
. ﻨﺘﺴﻫﻮﺠﺘﺴﺟﻭﺖﻛﺮﺣﻪﺑﻒﻇﻮﻣﺎﻬﻧﺁ ﺪ
. ﺭﺎﺘﻓﺭﻚﻳ،ﺶﺒﻨﺟﻦﻴﻤﻫﻪﻄﺳﺍﻭﻪﺑ
ﻲﻣﻉﻮﻗﻮﺑﻲﻠﻣﺎﻜﺗﻲﻋﺎﻤﺘﺟﺍ ﺩﺪﻧﻮﻴﭘ
. ﺩﻮﺷﻪﻨﻴﻬﺑ ﻭﻩﺰﻳﺮﺘﻣﺍﺭﺎﭘﻲﺘﺴﻳﺎﺑﺭﺎﺘﻓﺭﻦﻳﺍ،ﻝﺪﻣ ﻞﻴﻠﺤﺗﺮﻈﻨﻣﺯﺍ .
،ﻞﻴﻠﺤﺗﻱﺍﺮﺑ
ﺪﻳﺎﻤﻧﻊﻤﺟﺪﻨﻗﺕﻭﺮﺛﺪﻴﻟﻮﺗﻱﺍﺮﺑﻲﺘﺴﻳﺎﺑﻞﻣﺎﻋﺮﻫﻪﻛﺖﺳﺍﻩﺪﺷﺽﺮﻓ .
ﻦﻳﺍﺯﺍ ﻩﺯﺍﺪﻧﺍﺮﻫﻱﺭﻭﺁﻊﻤﺟﻪﺑﺎﻬﻧﺁ،ﻭﺭ
ﻲﻣﺕﺭﺩﺎﺒﻣﺪﻨﻗﺮﺘﺸﻴﺑ ﻧ
ﺪﻨﻳﺎﻤ . ﻲﻣﻱﺪﻨﺑﻪﺘﺳﺩﻥﺎﺸﺗﻭﺮﺛﺱﺎﺳﺍﺮﺑ ﺖﻴﻌﻤﺟ،ﻱﺯﺎﺳ ﻪﻴﺒﺷﺞﻳﺎﺘﻧﺎﺑ ﺪﻧﻮﺷ
. ،ﻪﻌﻣﺎﺟﺭﺩ
ﻲﻣﺺﻴﺼﺨﺗﻞﻣﺍﻮﻋﻩﺪﺷﻱﺭﻭﺁﻊﻤﺟﻲﺋﺍﺭﺍﺩﺱﺎﺳﺍﺮﺑﺕﻭﺮﺛ ﺪﺑﺎﻳ
. ﺕﻭﺮﺛﺯﺍﻱﺪﺻﺭﺩﺖﻴﻜﻟﺎﻣﻪﻛﻲﺘﻴﻌﻤﺟﺪﺻﺭﺩ
ﺖﺳﺍ ﻩﺪﺷﺺﺨﺸﻣ،ﻩﺪﺷ ﺐﺣﺎﺻﺍﺭ .
ﻲﻣﻥﺎﺸﻧ ﻱﺯﺎﺳﻪﻴﺒﺷ ﺭﺎﺘﻓﺭﻱﺯﺎﺳﻪﻨﻴﻬﺑ ،ﻲﻋﻮﻨﺼﻣﺕﺎﻴﺣ ﻚﻳﺭﺩﻪﻛﺪﻫﺩ
ﻲﻣﻲﻋﺎﻤﺘﺟﺍ ﺪﻧﻮﺷﻩﺩﺯﻦﻴﻤﺨﺗﻝﺪﻣﻱﺎﻫﺮﺘﻣﺍﺭﺎﭘﻭﻪﺘﻓﺮﮔﺕﺭﻮﺻﻱﺪﻨﻗﻱﺎﻀﻓﻝﺪﻣﺎﺑﺪﻧﺍﻮﺗ
.
1. INTRODUCTION
In this paper a basic model of society called “Sugarscape” [1-10,22] is used, in which the elementary population who are the properly parameterized agents will be distributed in an artificial environment, then a self organized
is to choose adequate societal parameters for achieving dynamic emergent behaviors which are pre described in simulations. This has been done through an evolutionary program for parametrizing simulated artificial society. The objective of these researches is to determine adequate parameters for an artificial society and achieving dynamic emergent behaviors which are pre-described in simulations.
In this function, fundamental social structures and group behaviors will be observed through spatiotemporal interactions among agents as well as agents and artificial environment. Both agents and the environment have spatial evolutionary rules which are defined by variable sets of parameters.
2. MATERIAL METHOD
2.1. The Social Evolution and its Necessity
The model based upon social processes is called artificial society [1,2,4,5,6,10,12-20]. Fundamental social structures and group behaviors are created by active agents who are interacting with society and each other, under certain rules effecting the computational data and each agent's capabilities. The artificial society is a computerized model consisting of independent agents with individual space. Agents are artificial entities who have been simulated in the society. Each agent possesses some inherited genetic features from their parents who are consistent in their lives.Evolution makes compatibility with dynamic environment possible [2,11]. Therefore, when an agent confronts an unpredicted situations, it can survive the new circumstances. It can be said about the evolution's necessity in an artificial world, that any generation will have an effect on the genetic functions of the next generation. These functional agents in biology are called mutation and selection. Artificial life refers to simple and natural behaviors which guarantee survival in complex spaces (environments).
Evolutionary computation comes from artificial life, and they are the results of an idea which askes in an environment, which solution should be reproduced or how to reproduce them or agents, and which solutions or agents should be omitted
from an environment.
2.2. Social Behaviors and Agent Based
Modeling
The main idea is that by supplying the agent with behavioral rules that sufficiently resembles real life behavior also allowing the evolutionary process to favour the socially best adapted, with which we are able to study developments in a society. In an artificial world we could insert certain capabilities and see if it is beneficial or not, we also could use computer laboratory to do social research that used to be impossible.The term “agent” should be interpreted as “actor” or “one who is doing something”. Agents have been proposed as situated and embodied problem solvers who are capable of functioning effectively and efficiently in complex space or environment.
An autonomous agent is a system situated within an environment that senses and acts according to that environment over time and in pursuit of its own agenda, to effect what it senses for the future. The system can be seen as an active entity (may it be human, computer program, robot, or any other organism), and autonomous means in charge of its own actions. The environment or space would mean the world it inhabits, including other agents [1].
Agents like humans can be connected socially in various ways: genealogically, culturally, and economically, for example. Indeed, one of the things that makes human complicated, conflicted, and interesting is that they can belong to many different communities, or social networks, at once. These network change over time And most interestingly, group loyalties can come into profound conflict, as when brothers (member of family group) fight each other (as member of competing political group) [2]. Also agents like humans can have communicative and cooperative behaviors towards each other in a society for increasing their welfare and improving their lives [1].
2.3. Artificial Society Models
We apply agent based modeling technique to the study of social systems. This modeling methodology has a long lineage beginning with Von Neumann's work on self reproducing automata in 1996 that combines elements of many fields, including cybernetics, connectionist cognitive science, distributed artificial intelligence, cellular automata, genetic algorithm, genetic programming, artificial life, and individual based modeling in biology. However, there have been very few attempts to bring these literatures to bear on social science.The first concerned attempts to apply, agent based computer modeling explicitly to social science was Thomas Schelling's. Schelling anticipated many of the themes encountered in the contemporary literature on agent based modeling, social complexity, and economic evolution. Among other things, Schelling devised a simple spatially distributed model composing of neighborhoods, in which agents prefer to have at least some fraction of their neighbors to be the same as their own for example, “color”. He found that even quite color-blind preferences, produced quite segregated neighborhoods.
But Schelling's works were constrained by limited available computational power at that time. It is only in the last decade that advances in computing have made large scale agent based modeling practical. Recent efforts in the social sciences have taken advantage of new capabilities. Additionally, computer science is interested in questions of distributed artificial intelligence, decentralized decision making, and game theory
that have been actively researching multi agent systems. Biologists have even built models in which a population of agents representing human exploits ecological resources.
In what follows, we shall refer to agent based models of social processes as artificial societies. In this approach (methodology) fundamental social structures and group behaviors, emerge from the interaction of individuals operating in an artificial environment under rules that place only bounded demands on each agent’s information and computational capacity. We view artificial societies as laboratories, where we attempt to grow certain social structures in the computer, the aim is to discover fundamental local or micro mechanisms that are sufficient to generate the macroscopic social structures and collective behaviors of interest. In general, such agent based computer modeling experiments involve three basic ingredients: agents, an environment or space, and rules.
A particular and complete instance (of the agent based modeling) of the artificial society concept is sugarscape model that was presented by Epstein and Axtell [2] so far. It has been developed as a tool able to analyze social processes without isolating them. It applies agent based computer modeling technique to the study of human social trade, migration, group formation, transmission of culture propagation of disease, and population dynamics. It is an attempt to simulate fundamental social structures and group behavior from the interaction of various agents operating in artificial environments under very simple rules [2].
Sugarscape model is defined as a bottom-up world for agents where agents are heterogeneous from the view point of individual abilities (vision) and needs (metabolism). Sugar, in this space, is the only distributed resource for agents' survival.
2.4. The Simulation Model
The primary focus of the present work is on sugarscape model that includes cellular automata, a fixed topology that never changes [2].Sugarscape Model= CA + Agents + Sugar + Rules.
represented as a lattice or array of cells. The size of this lattice is referred to as the dimension of the CA. The cells have a set of properties (variables) that may change over time. The values of the variables of a specific cell at a given time are called the state of the cell and the state of all cells together form (as a vector or matrix for example) a global state or global configuration of the CA [3].
This model can be considered as a two dimensional cellular automata, each point of which possesses (x,y) features. A sugar level and a sugar capacity are considered for each point and the maximum sugar capacity is the amount of sugar, taken from any points of this landscape. There are some sugarless points (deserts) with low capacity, and some sugarless points with high capacity. Some points are sugar rich with high capacity. The basic elements in sugarscape model are: agent, rules, landscape and sugar (resource) [2]. Agents start working in random on their primary situation, assets, and all their internal area. A subgroup of internal states always remains unchanged within agent's life, where as other subgroup depends on time. In addition some of these states are spatial and different for some and common for other agent. The spatial time independent states are the primary assets, maximum life time, vision and metabolism rate. The overall independent states include: time needed for increasing vision, poverty limit (= o), spatial time dependant states such as agent situation in landscape, real asset in sugar units. The agent executes rules simultaneously in searching for sugar. Thorough movement of population is an emergent result of simple spatial activities by agents [1-10].
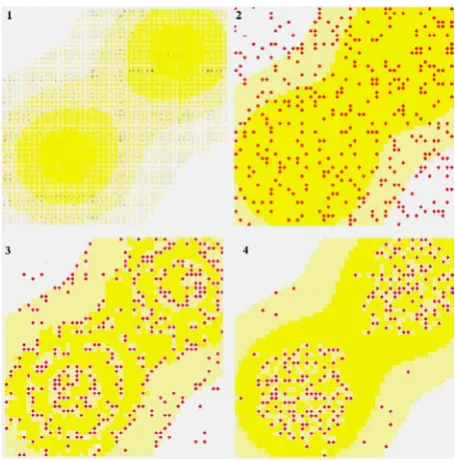
This landscape is specified by computerized program of sugar and capacity distribution. Therefore the landscape includes energy agents and resources with a 50×50 layout in which agents are active. Concerning this layout it can be said that: the basic agent of landscape is cellule and each landscape consists of 50×50 cellules upon which the rules are executed and allows agents to occupy it. There may be other agents than sugar in cellule. The amount of cellule sugar can be predefined according to growth rate,it can rise and be searched by any agent for sugar or production. Sugarscape is a grid world. Figure 1 shows an artificial society on sugarscape. Part 1 of this
figure shows the distribution of sugar in the grid world, the sugar score is highest at the peaks in the northeast and southwest quadrants of the grid- where the color is most yellow- and falls in a series of terraces. Part 2 shows random initial distribution of agents on sugarscape. Part 3 has actual dynamics of agents for collecting the sugar. Each agent moves to the site it ranks highest and harvest the sugar. In part 4 the agents concentrate their activities on the sugar peaks. Indeed, two colonies seem to form, one on each mountain. Also notice that some agents die. For those with high metabolism and low vision, life is particularly hard [2].
Initial population of
individuals
Individuals Measure Fitness
Evaluation
Selection
Mating/ Replacing Mutation
Parental Individuals Child
Individual
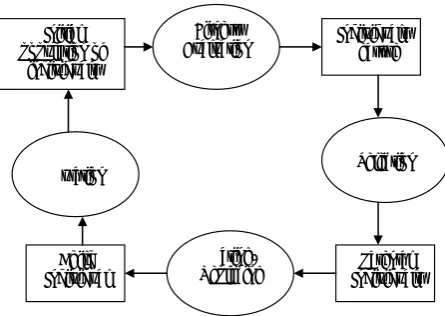
Figure 2. A block diagram for an evolutionary program.
better suited to their environment than the individuals who were created from, just as selection, recombination, mutation, migration, locality and neighborhood are modeled (Figure 2). Since evolutionary programs work on population of individuals instead of single solutions, the search is very efficient and is performed in a parallel manner. In this work an evolutionary program is designed in order to carry out the search for the set of intervals within which the different parameters of sugarscape can be randomly initialized in order to observe expected wealth distribution for the agent population.
The main component of an evolutionary program [14] are a population of data structures (individuals), each representing a potential solution to the task at hand; an expected distribution (that can be a fitness function) that assigns a quality ranking to each individual used in the selection mechanism; and a group of reproduction operators that allow the evolution of the population.
The data structure to be manipulated by the evolutionary program consists of a population of bit strings that are used in the representation of each evolved parameter.
The expected distribution guiding the search insists on a similarity measure of the dynamic of the simulation with a desired social conduct. To measure this similarity the important observable consideration is the asymptotic wealth distribution of population. As the consequence, the expected distribution is written in terms of average values of descriptors of desired wealth distribution.
Some distribution descriptors considerations are: average value, second moments and partial sums. The average value of the descriptors are evaluated at large; time for several iterations and used in the calculation of expected distribution.
The selection of the parents is carried out by a roulette wheel selection mechanism. The selected parents are manipulated by the reproduction operators in order to produce offspring for a new population. Two simple reproduction operators were used: one point crossover and mutation. The mutation operator is based on the mutation of each bit with a fixed probability.
3. EXPERIMENTS AND RESULTS
We used Michael Gizzi, Richard Vail, and Tom Lairson's Wealth Distribution model [21,22]. This model is adapted from Epstein and Axtell's Sugarscape model. We analyzed it and presented an optimized state of the social model. The model can indicate social welfare as an economic non-classic theory and uses sugar instead of sugar. Each patch has an amount of sugar and a sugar capacity (the amount of sugar it can grow). People collect sugar from patches and eat them to survive. The amount of sugar collected by each person indicates its assets or wealth.
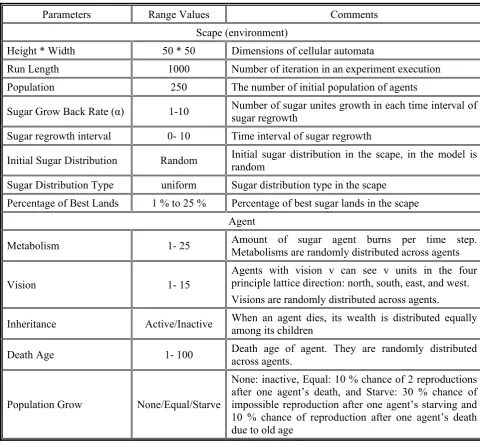
TABLE 1. The Used Parameters for the Experiments.
Comments Range Values
Parameters
Scape (environment)
Dimensions of cellular automata 50 * 50
Height * Width
Number of iteration in an experiment execution 1000
Run Length
The number of initial population of agents 250
Population
Number of sugar unites growth in each time interval of sugar regrowth
1-10 Sugar Grow Back Rate (α)
Time interval of sugar regrowth 0- 10
Sugar regrowth interval
Initial sugar distribution in the scape, in the model is random
Random Initial Sugar Distribution
Sugar distribution type in the scape uniform
Sugar Distribution Type
Percentage of best sugar lands in the scape 1 % to 25 %
Percentage of Best Lands
Agent
Amount of sugar agent burns per time step. Metabolisms are randomly distributed across agents 1- 25
Metabolism
Agents with vision v can see v units in the four principle lattice direction: north, south, east, and west. Visions are randomly distributed across agents. 1- 15
Vision
When an agent dies, its wealth is distributed equally among its children
Active/Inactive Inheritance
Death age of agent. They are randomly distributed across agents.
1- 100 Death Age
None: inactive, Equal: 10 % chance of 2 reproductions after one agent’s death, and Starve: 30 % chance of impossible reproduction after one agent’s starving and 10 % chance of reproduction after one agent’s death due to old age
None/Equal/Starve Population Grow
observed in the world. Therefore a model is presented which simulates wealth distribution in the society, that the saying “the rich becomes richer and the poor become poorer” is a sign of inequality in the world. Paretto’s rule has been used in this simulation in which a great number of poor people are considered by red color, a less number of middle class people by green, and the least number of rich people by blue color.
By using this model we can study the way of
wealth distribution in an artificial society and achieve an optimized state in it, for making better decision in economics and society according to; observations, measurements, and results. Findings will show that in an artificial life, it is possible to use the sugarscape model to analyze and optimize the behavior of the society.
According to Table 1.the most important parameters are;
0.36 0.38 0.4 0.42 0.44 0.46 0.48 0.5 0.52 0.54 0.56
1950 1952 1954 1956 1958 1960 1962 1964 1966 1968 1970 1972 1974 1976 1978 1980 1982 1984 1986 1988 1990 1992 1994 1996 1998 2000
Year
G
in
i C
o
ef
fi
ci
en
t
Real world Model
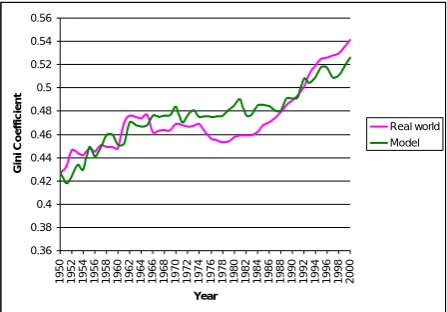
Figure 3. The model behavior in comparison with the real world.
social behavior in the real world (model validation and verification), UN research on the evolution of world income inequality for years of 1950 to 2000 is studied and the results are compared to the simulated results of the model (the model is adjusted according to above range values) [23]. Figure 3 shows an instance of the results that are conclusive of the UN research and the model execution. According to the results the convergence between two curves is acceptable. The most important rules used are [2]:
Movement rule of agent (M):
It’s obvious that movement is a requisite to achieve fertile areas, reproduction or sugar division locations.
• Look at different directions as much as your vision let, and identify in occupied places with most amount of sugar.
• If the most amount are seen on 3 several places, choose the nearest area.
• Move to this area
• Gather all amount of sugar from this area.
The gathered wealth (sugar) by agent is increased with sugar gathering and decreases with metabolism rate of agent. If the agent’s wealth decreases or even reaches 0 at any time and the agent isn’t able to gather enough sugar for its required metabolism, the agent will starve and
exits the landscape. Each agent is authorized to move once in each time period therefore they move casually during each period.
The rule of sugar regrowth in sugarscape (Gα):
In each situation of sugar network, sugar grows by
α rate in each growth time interval and rises up to the capacity of that situation.
The agent replacement rule R (a,b):
When an agent dies, it shall be replaced with a 0 aged agent with random genetic features, in casual situation on sugarscape, with casual gender, as well as casual life expectancy [a,b].
The agent inheritance rule (I):
When an agent dies, its wealth is distributed equally among its children.
There experiments with different states are down and compared. In final experiment is approved that more equality can be achieved by adjusting (optimizing) some parameters.
Figure 4. Evolutionary wealth distribution under rules (G,M).
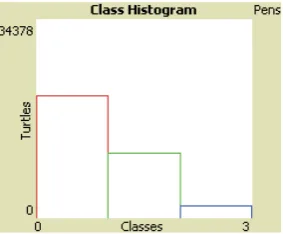
Figure 5. The table of social classes number (red, green and blue indicate low, mid and up classes, respectively) under rules (G,M).
Figure 6. The diagram of social classes evolution under rules (G,M).
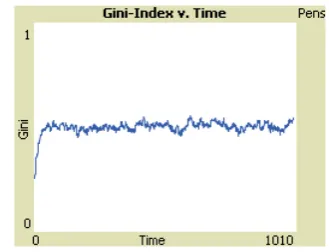
Figure 7. Increase of gini coefficient.
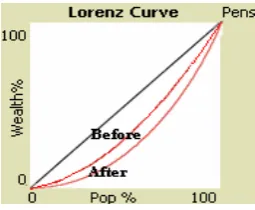
Figure 8. Lorenz curve indicates increase of inequality and injustice.
Figure 9. Quintile wealth histogram shows the wealthiest 20 % will control 58 percent of the wealth.
63
112
75 219
22 9
0 50 100 150 200 250
1 2 3
classes
P
o
pul
a
ti
o
n
Before the Experiment A After the Experiment A
Figure 10. Histogram of social classes number (1,2 and 3 indicate low, mid, and up classes, respectively) for experiment A, before and after the simulation.
Figure 11. Lorenz curve: Percentage of population changes to percentage of wealth (asset or sugar) for experiment A, before and after the simulation.
Figure 12. Table of social classes number (red, green and blue indicate low, mid and up classes, respectively) in active inheritance under rules (G,M,R).
Figure 13. Diagram of social classes evolution in active inheritance under rules (G,M,R).
Figure 14. The fluctuations of GINI coefficient in active inheritance under rules (G,M,R).
before and after the simulation. As it is shown after the simulation number of the poor people has increased. It indicates the movement of assets in the society.
Figure 11 shows percentage of population changes to percentage of wealth (asset or sugar). As it is shown deviation increase in the curve after the simulation indicates increase of inequality in the society.
3.2. Experiment B
In this experiment, the amount of parameters is also adjusted as per experiment A. there are only 2 new changes: (1) agents are allowed to be replaced in space (activating replacement rule by placing equality in population growth parameter) in order to investigate their effect on wealth distribution in society and (2) the effect of inheritance rule activation in agents society is studied with respect to wealth distribution evolution.Figures 12 to 16 shows the results, which
Figure 15. Lorenz curve in active inheritance under rules (G,M,R).
Figure 16. Quintile wealth histogram shows the wealthiest 20 % will control 42 percent of the wealth.
73 104 73
21108
11000
2000
0 5000 10000 15000 20000 25000
1 2 3
Classes
P
o
pu
la
ti
on
Before the Experiment B
After the Experiment B
Figure 17. Histogram of social classes number (1,2 and 3 indicate low, mid, and up classes, respectively) for experiment B, before and after the simulation of part 1.
Figure 18. Lorenz curve: Percentage of population changes to percentage of wealth (asset or sugar) for experiment B, before and after the simulation of part 1.
curves and time intervals of “Figure 15” the amount of deviation from equality is less than previous state.
Another point is that, the total wealth after the end of simulation is 677911, and its average for each agent is 20. These amounts were 8000 and 30 respectively in the beginning. Also, after life expectancy, about 96 % of the agents starved in the last generation.
In the second state of this experiment the agents are allowed to give their stored sugars to their children when they are dying. So the agents have inheritance right, the question is, what effect inheritance rule can have on wealth distribution in society? The results shows that society achieves equality sooner (Figure 14). The Quintile wealth histogram in “Figure 16” shows the wealthiest 20 % will control 42 percent of the wealth. The poorest 20 % will control 2.3 percent of it.
The number of agent population and average of
wealth distribution in this state shows the survival of most agents due to inheritance.
Therefore the answer to above question is “inheritance” makes selection delayed, in other words the agents who may be omitted can achieve superiority by the help of inheritance.
Figure 17 shows the social classes number before and after the simulation of part 1. As it is shown, the population increase caused by activation of replacement rule.
Figure 18 shows percentage of population changes to percentage of wealth (asset or sugar). As it is shown deviation increase in the curve after the simulation indicates increase of inequality in the society. But this inequality is less than the result of experiment A.
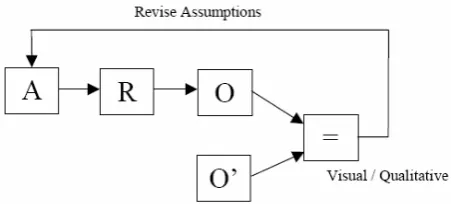
Figure 19. Behavior Modeling. Given some desired set of observation (O') the assumptions (A) represented by the program can be revised until some level of correspondence is produced.
Figure 20. Table of social classes number (red, green and blue indicate low, mid and up classes, respectively) in time period 300.
Figure 21. Diagram of social classes evolution in active inheritance in time period 300.
wealth distribution in the society. It may occur by changing, adjusting and optimizing the parameters.
Optimization Method:
The model is executed several times by changing and adjusting the parameters and the simulation results compared to the target in some way (Lorenz deviation, Gini coefficient, and other curves are studied in each time). The agreement between the model and the target is a base for the optimization of the model. Figure 19 shows the use of optimization methodology in the artificial society [17].
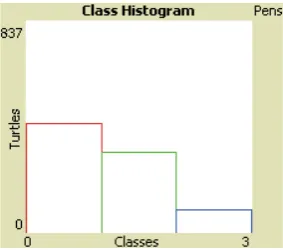
The most optimized state in all executions includes: the number of agents in space = 250, the maximum vision = 15, the maximum metabolism rate = 1, the death age = 1 to 83, the time interval of sugar regrowth = 1, the number of sugar regrowth in each growth time interval = 10, the percentage of the best lands in space = 25 %. The growth state of population is adjusted in starvation. Therefore a replacement control for the families with starvation record is executed. This experiment is done for 1000 time periods. In the beginning, the Gini coefficient concerning primary wealth distribution is 0.332, the wealth average in society is 25 sugars, and the amount of sugar in total land is 6349. After 300 periods, Gini coefficient reaches 0.184 which shows an approach to wealth equality in society. Moreover, Lorenz curve and diagram of social class numbers in Figure 20 and Figure 21, indicates the number of poor agents is a few, and the number of middle class ones is more, which reveals welfare improvement in society; the wealth average in society is 3063.
Despite increase of Gini coefficient in time period 700 (i.e. 0.255) the Lorenz curve is still in a good state because the number of middle class agents is kept high by adjustment (about 270 among 572 agents existing in society). The wealth average in society is 4583 , which reveals more welfare improvement in society. Despite increase of the poor in time period of 1000, Gini coefficient is still acceptable up to this time (i.e. 0.281 in time period 1000), but it seems performing experiments for more than 1000 time periods again increases the social inequality and injustice which is the result of over population and shortage of available resources for agents. In time period of 1000, there are 837 agents existing in space, and comparing it with 572
Figure 22. Table of social classes number (red, green and blue indicate low, mid and up classes, respectively) in time period 1000.
Figure 23. Diagram of social classes evolution in active inheritance in time period 1000.
Figure 24. The fluctuations of GINI coefficient in active inheritance under rules (G,M,R) in time period 1000.
Figure 25. Lorenz curve in active inheritance under rules (G, M,R) in time period 1000.
Figure 26. Quintile wealth histogram shows the wealthiest 20 % will control 37 percent of the wealth.
91 86 73
459
314
64
0 100 200 300 400 500 600 700 800
1 2 3
Classes
P
o
pu
la
ti
on
Before the Experiment C
After the Experiment C
Figure 27. Histogram of social classes number (1,2 and 3 indicate low, mid, and up classes, respectively) for experiment C, before and after the simulation.
increased, the wealth average in society is 4633 sugars in this time period and the total amount of social wealth is 3877812 sugars. The evolutionary process of Gini coefficient, the plot related to social classes’ evolution, Lorenz curve, and Quintile wealth histogram at the end of this experiment are shown in Figures 22 to 26 respectively.
The Quintile wealth histogram in “Figure 17” shows the wealthiest 20 % will control 37 percent of the wealth. The poorest 20 % will control 7.7 percent of it.
Figure 28. Lorenz curve: Percentage of population changes to percentage of wealth (asset or sugar) for experiment C, before and after the simulation.
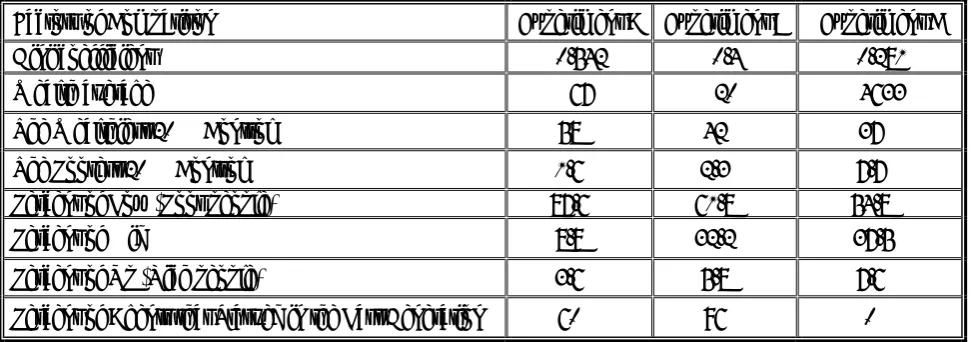
TABLE 2. A Comparison Between the Factors Shows an Optimization in Wealth Distribution in the Society that Occurred in the Experiment C.
Factors of Comparison Experiment A Experiment B Experiment C
Gini coefficient 0.542 0.4 0.281
Wealth average 67 20 4633
The Wealthiest 20 % Control 58 % 42 % 37 %
The Poorest 20 % Control 1.6 % 2.3 % 7.7 %
Percent of Low (Poor people) 87.6 % 61.8 % 54.8 %
Percent of Mid 8.8 % 32.2 % 37.5%
Percent of Up (Rich people) 3.6 % 5.8 % 7.6 %
Percent of Agents that Starved in the Last Generation 60 % 96 % 0 %
wealth (asset or sugar). As it is shown deviation decrease in the curve after the simulation indicates increase of equality in the society.
Table 2 compares the important results achieved from experiments of A, B, and C. As it is shown, Gini Coefficient has the least amount in experiment C, and it means that in the society of experiment C more equality and welfare in wealth distribution has occurred. Also comparison among the percentage of population classes shows in experiment C the percent of the poor is the least and percent of the mid is the most. Finally, wealth average in experiment C is the most and death caused by starvation is the least. Therefore, comparison between the factors shows an optimization in wealth distribution in the society has occurred in the experiment C.
4. CONCLUSION
5. REFERENCES
1. Buzzing, P., “VUSCAPE: Communication and
Cooperation in Evolving Artificial Societies”, Master's Thesis, Artificial Intelligence Department of Computer Science, Faculty of Sciences, Vrije University, Amsterdam, The Netherlands, (2003).
2. Epstein, J. M. and Axtell R., “Growing Artificial Societies: Social Science from the Bottom Up”, Brookings Institution Press, Washington DC, U. S. A., (1996).
3. Pfeifer, R., Kunz, H., Weber M.M., Thomas D., “Artificial Life”, Institute for Informatics, Zurich University, Germany, (June 2001).
4. Zonemat Kermani, N., Setayeshi, S. and Teshnelab, M., “Implementation of Communication's Effect in Artificial Life and Effect of Evolutionary Functions in It”, Master's Thesis, Department of Computer Engineering, Faculty of Technical and Engineering, Science and Research Branch, Islamic Azad University (IAU), Tehran, Iran, (2003).
5. Rahman, A. and Setayeshi, S., “Evolution of Social Behavior in Artificial Society”, Proceedings of the12th
International CSI Computer Conference, Shahid
Beheshti University, Faculty of Electrical and Computer Engineering, Tehran, Iran, (2007), 1219-1227.
6. Rahman, A. and Setayeshi, S., “Modeling of Health Destruction Arising from Spreading Pollution”,
Proceedings of the 15th Iranian Conference on
Electrical and Computer Engineering (ICEE 2007),
(Biomedical Engineering Proceeding), Iran Telecom Research Center, Tehran, Iran, (2007), 91-97.
7. Rahman, A. and Setayeshi, S., “Implementation of AIDS Disease and HIV + Virus Distribution Model In an Artificial Society as a computation Approach to Establish the Electronic Health”, Proceedings of the First Conference on Study of IT Development
Approach in Iranian Medical Sciences Universities,
Shahid Beheshti University of Medical Science and Health Services, Tehran, Iran, (2007).
8. Rahman, A. and Setayeshi, S., “Designing Health Development Model in an Artificial Society through Optimizing of Disease Distribution Model between Population”, Proceedings of the International
Conference on Telemedicine and e-Health, Shahid
Beheshti University of Medical Science and Health Services, Tehran, Iran, (November 2006).
9. Rahman, A. and Setayeshi, S., “Complex Systems Analysis in Artificial Life based on Sugarscape Model”,
Submitted to CSI Journal on Computer Science and
Engineering, Tehran, Iran, (2006).
10. Toma, T., “Communication in Artificial Society- Effects of Different Communication Protocols in an Artificial Environment”, Master's Thesis, Artificial Intelligence Department of Computer Science, Faculty of Sciences, Vrije University, Amsterdam, The Netherlands, (2003).
11. Bar-Yam, Y., “Dynamics of Complex Systems”, New England Complex Systems Institute, UK, (1997). 12. Axelrod, R., “The Convergence and Stability of Cultures:
Local Convergence and Global Polarization”, SFI
Working Paper 95-30-028, Sanata Fe, N. M.: Sanata Fe Institute, U. S. A., (1995).
13. Axelrod, R., “The Evolution of Co-operation”, New York, U.S.A., (1980).
14. Baptista, D., Torres, M. and Moreno, J. A., “Evolution of Social Behavior in Simulated Societies”, Proceedings
World Multiconference on Systemics, Cybernetics and
Informatics SCI’2000, Vol. X, (2000), 5-12.
15. Dascalu, M., Franti, E. and Stefan, G., “Modeling Production with Artificial Societies: the Emergence of Social Structure”, Acri'98-Proceedings of the Third
Conference on Cellular Automata for Research and
Industry, Springer-Verlag, Trieste, Italy, (1998).
16. Hales, D., “Memetic Engineering and Culture Evolution”, In Knowledge Management, Organizational Intelligence and Learning, and Complexity, (Ed. L. Douglas Kiel), in Encyclopedia of Life Support Systems (EOLSS), Developed under the Auspices of the UNESCO, Eolss Publishers, Oxford, UK, (2004).
17. Hales, D., “Tag Based Co-operation in Artificial Societies”, Ph. D. Thesis, Department of Computer Science, University of Essex, UK, (2001).
18. Hales, D., “Selfish Memes and Selfless Agents, Altruism in the SwapShop”, Proceedings of the 3rd International Conference on Multi-Agent Systems, IEEE Computer
Society, California, U.S.A., (1998).
19. Hales, D., “Stereotyping, Groups and Cultural Evolution: A Case of Second Order Emergence?”, Lecture Notes in
Computer Science, Proceedings of the First
International Workshop on Multi-Agent Systems and
Agent-Based Simulation,Springer-Verlag, London, UK,
Vol. 1534, (1998).
20. Hales D., “An Open Mind is Not an Empty Mind, Experiments in the Meta- Noosphere”, Journal of
Artificial Society and Social Simulation, UK, Vol. 1, No.
4, (1998).
21. Gizzi, M., Vail, R. and Lairson, T., “Wealth Distribution Project”, Mesa State College, Center for Agent-Based Modeling, Evanston/Chicago, U. S. A., (2003).
22. NetLogo, Group, “NetLogo 3. 1. 3 Software, Center for Connected Learning and Computer-Based Modeling”, Northwestern University, Evanston, IL, U. S. A., (2006). 23. Rahman, A. and Setayeshi, S., “The Role of Wealth
Distribution, Inheritance and Population Control in Social Welfare: Simulation of Social Welfare in Artificial Society”, Institute of Social Welfare Research, University of Social Welfare and Rehabilitation Sciences, Journal of
Social Welfare, Tehran, Iran, Vol. 26, (2007).
24. Chattoe, E. and Gilbert, N., “A simulation of budgetary decision-making based on interview data”, Proceedings
of the Third Symposium on Simulating Societies, Boca
Raton, Florida, U. S. A., (1995).
25. Gilbert, N. and Conte, R., “Emergence in social simulation”, Artificial Societies London UCL Press, UK, (1995), 144-156.
26. Langlois, A. and Phipps, M., “Automates cellulaires application a la simulation urbaine”, HERMES, Paris, French, (1997).