University of Windsor University of Windsor
Scholarship at UWindsor
Scholarship at UWindsor
Electronic Theses and Dissertations Theses, Dissertations, and Major Papers
2017
Middle Eastern Smart Water Technologies for Distribution
Middle Eastern Smart Water Technologies for Distribution
Networks
Networks
Ahmed Alaa Mahmoud Moghazy Abdelaal
University of Windsor
Follow this and additional works at: https://scholar.uwindsor.ca/etd
Recommended Citation Recommended Citation
Abdelaal, Ahmed Alaa Mahmoud Moghazy, "Middle Eastern Smart Water Technologies for Distribution Networks" (2017). Electronic Theses and Dissertations. 7339.
https://scholar.uwindsor.ca/etd/7339
Middle Eastern Smart Water Technologies for Distribution Networks
by
Ahmed A. Abdelaal
A Thesis
Submitted to the Faculty of Graduate Studies
through the Department of Civil and Environmental Engineering
in Partial Fulfilment of the Requirements for
the Degree of Master of Applied Science at the
University of Windsor
Windsor, Ontario, Canada
MIDDLE EASTERN SMART WATER TECHNOLOGIES FOR DISTRIBUTION
NETWORKS
by
Ahmed A. Abdelaal
APPROVED BY:
K. Tepe
Department of Electrical and Computer Engineering
H. Maoh
Department of Civil and Environmental Engineering
R. Carriveau, Advisor
Department of Civil and Environmental Engineering
D. S.-K. Ting, Co-Advisor
Department of Mechanical, Automotive & Materials Engineering
DECLARATION OF ORIGINALITY
I hereby certify that I am the sole author of this thesis and that no part of this thesis has
been published or submitted for publication
I declare that, to the best of my knowledge, my thesis does not infringe upon anyone’s
copyright nor violate any proprietary rights and that any ideas, techniques, quotations, or any other
material from the work of other people included in my thesis, published or otherwise, are fully
acknowledged in accordance with the standard referencing practices. Furthermore, to the extent
that I have included copyrighted material that surpasses the bounds of fair dealing within the
meaning of the Canada Copyright Act, I certify that I have obtained a written permission from the
copyright owner(s) to include such material(s) in my thesis.
I declare that this is a true copy of my thesis, including any final revisions, as approved by
my thesis committee and the Graduate Studies office and that this thesis has not been submitted
ABSTRACT
The hydraulic analysis of water distribution systems (WDS) can be analyzed by two main
approaches: demand-driven analysis (DDA) and pressure-driven analysis (PDA). The DDA works
well under normal operating conditions, while the PDA produces reliable results under partially
failed conditions of a network. Comparisons are carried out by semi-pressure driven analysis
(SPDA), Emitter normal pressure driven analysis (ENPDA), Emitter UNESCO pressure driven
analysis (EUPDA) and the DDA. The verification is carried out by one of the most commonly
used hydraulic modelling software developed by the United States Environmental Protection
Agency, EPANET. Applying EPANET demonstrates that unrealistic results from an initial DDA,
in the form of pressure deficiencies, could be transformed into the partial fulfillment of nodal
demands without losing computational efficiency by PDA methods. The fixed demands of the
hydraulic engine in EPANET software is not suitable for analysis of WDS with low pressure.
ENPDA is one of the PDA approaches and depends on an emmiter equation which is built-in
EPANET software. Another approach of PDA is carried out by the modifications of EPANET
(EUPDA) for pressure impact in DDA employing emitter modelling of demands. The EUPDA
proposed version can work in a fully transparent way with standard EPANET network files. The
verification was carried out to select the most convenient approach for the reliability analysis. The
results of the selected PDA modelling approach will be utilized to apply a Middle Eastern solution
by adding the elevated tank. Smart enhancement solutions can eliminate the impacts of burst
DEDICATION
This work is dedicated to my parents Alaa and Amal, who have shown love, caring, support to my
brother all of our lives and me. They are my support in this life, and their dedication, as well as
their sacrifices, made my academic achievements possible. I would also like to add my special
thanks to my brother, Amr, who has always supported me. I am always deeply appreciative of his
ACKNOWLEDGEMENT
I would like to acknowledge the steady leadership, wisdom, patience, and support provided by my
primary advisor, Dr. Rupp Carriveau, and co-advisor, Dr. David S.-K. Ting. The guidance and
patience they have given me has been essential throughout the past two years and has helped me
develop my research and knowledge. Furthermore, I would like to thank Dr. Hanna Maoh and Dr.
Kamal Tepe for their contributions to my thesis defense. I would also like to offer special thanks
to Mr. Rodney Bouchard of the Union Water Supply System for his support and contributions to
this work.
TABLE OF CONTENTS
DECLARATION OF CO-AUTHORSHIP/PREVIOUS PUBLICATIONS………..…………....iii
ABSTRACT………..….iv
DEDICATION……….v
ACKNOWLEDGEMENT………...………...…………vi
LIST OF FIGURES………..….... xii
LIST OF TABLES……….…xv
CHAPTER I ……….…….…..1
INTRODUCTION……….……….…….…1
1.0 Water Distribution System (WDS)………...….…1
1.1Demand-driven analysis (DDA)……….………...…...2
1.2Pressure-dependent analysis (PDA)……….………..……….2
1.3The study’s main objectives and assumptions.……….……….….…..…..3
1.4The applied theory of reliability………...4
1.5The emitter approaches……….……….……...5
1.6The Smart Middle Eastern solution………..……….…..5
1.7Case studies……….…..…...6
2.0 References………..……….………...6
CHAPTER II: Water Distribution Networks Performance under Emergency Conditions…...10
NOMENCLATURE………..10
Keywords………...10
1.0Introduction………..10
1.1The current applied method………..……...…11
1.2The main objective and assumption………..………...12
1.3The applied criteria and algorithm………..………...12
2.0Case Studies……….14
2.1The first case study………....……….………….14
2.1.1 The analysis of the first case study results……….14
2.1.2 The first case study results—Validation………....15
2.1.2.3For route Z2……….………..17
2.2The second case study……….………...17
2.2.1 The analysis of the second case study’s results……….….……...18
2.2.2 The second case study results—Verification………..………….……...20
2.2.2.1Route R1………..……..20
2.2.2.2Route R2………..……..20
2.2.2.3Route R3………...21
3.0Conclusion………..……….…21
4.0Acknowledgement………...21
5.0References………22
Chapter III: Water Distribution Network Performance by Using Semi Pressure Driven Analysis Approach during Emergency Conditions………..25
NOMENCLATURE………..25
Keywords………...25
1.0Introduction………....…..25
1.1The applied solution method………..…....…..26
1.2The main objective and assumption………..……...…..27
1.3The applied criteria and assumption………...………...…..27
2.0Case Studies………...………....…. 28
2.1The first case study………...………...…..29
2.1.1 The analysis of the first case study results………...…..29
2.1.2 The results analysis of demand-driven analysis (DDA)...…………...…..29
2.1.3 The results analysis of semi-pressure driven analysis (SPDA).…….…...32
2.1.4 The first case study results—Verification………..……...33
2.1.4.1For route X………...……….….33
2.1.4.2For route Y………...……….….34
2.1.4.3For route Z2..………...……….….34
2.2The second case study…………...……….………...…...34
2.2.1 The analysis of the first case study’s results………….………...…..35
2.2.2 The results analysis of demand-driven analysis (DDA) ..…………..…...36
2.2.4 The second case study’s results—Verification………..……....38
2.2.4.1For route R1..………...……….….38
2.2.4.2For route R2…….………...………..….39
2.2.4.3For route R3..………...……….……….39
3.0Conclusion……….……….……….…40
4.0Acknowledgement………...41
5.0References………41
CHAPTER IV: Enhance the Reliability of Water Distribution System Utilizing the Smart Middle Eastern Application ……….………..44
NOMENCLATURE………..44
Keywords………...44
1.0Introduction………....…..44
1.1The main objective and assumption………..………...45
1.2The applied assumptions………..………46
1.3Theory of reliability……….………...….46
1.4The emitter approaches……….………...48
1.5The smart Middle Eastern technology solution………..……….49
1.6The criteria for selecting the suitable smart technology solution………49
1.6.1 The design of the elevated balance tank………...………….50
1.6.1.1The SPDA approach………..50
1.6.1.2The emitter normal pressure driven analysis (ENPDA)…...…….50
1.6.1.3The emitter UNESCO pressure driven analysis (EUPDA)…..….50
1.7The smart Middle Eastern technology approach………...50
1.7.1 Select the location and characteristics of elevated balance tank……...50
2.0Case Studies………...51
2.1The first case study………..…....52
2.1.1 The analysis of the first case study results………...52
2.1.1.1For burst pipe 2………..52
2.1.1.2For burst pipe 4………..…52
2.1.1.3For burst pipe 6………...53
2.1.2.1For burst pipe 2 route X……….……54
2.1.2.2For burst pipe 2 route Y……….……54
2.1.2.3For burst pipe 2 route Z2……….……..55
2.2The second case Study……….…55
2.2.1 The analysis of the second case study results………55
2.2.1.1For burst pipe 2………..56
2.2.1.2For burst pipe 3………..56
2.2.1.3For burst pipe 8………..56
2.2.2 The second case study analysis results—Verification……….……..56
2.2.2.1For burst pipe 2 route R1………..…….57
2.2.2.2For burst pipe 3 route R2………..…….58
2.2.2.3For burst pipe 8 route R3………..…….58
2.3The selection of the proper PDA approach………..………58
3.0The smart Middle Eastern engineering technology analysis………...…....60
3.1The first case study………..……60
3.1.1 The validation results for adding elevated balance tank (EBT) in the first case study………..….61
3.1.1.1For burst pipe 2………...61
3.1.1.2For burst pipe 4………..61
3.1.1.3For burst pipe 6………...61
3.2The second case study………..……62
3.2.1 The validation results for adding elevated balance tank (EBT) in the second case study………..……...62
3.2.1.1For burst pipe 2………..63
3.2.1.2For burst pipe 3………..63
3.2.1.3For burst pipe 8………..63
4.0The Discussion of the Results………...…...63
5.0Acknowledgement………...65
6.0References………65
CHAPTER V: CONCLUSION AND RECOMMENDATIONS………...………...70
2.0Recommendations………....73
APPENDIX A: FIGURES……….74
APPENDIX B: TABLES………...92
LIST OF FIGURES
CHAPTER II: Water Distribution Networks Performance under Emergency Conditions
Figure II-1: The flow chart of the pipes networks analysis by demand driven analysis (DDA) .. 13 Figure II-2: The first case study viewing pressure at the original and burst pipe 2. ... 14 Figure II-3: The first case study: The pressure route X for original and burst pipe 2, 4 and 6. ... 16 Figure II-4: The second case study viewing pressure at the original and burst pipe 2. ... 18 Figure II-5: The second case study: The pressure for route R1: burst pipes 2, 3 and 8. ... 19
Chapter III: Water Distribution Network Performance by Using Semi Pressure Driven Analysis Approach during Emergency Conditions
Figure III-1: The flowchart of semi-pressure driven analysis (SPDA) algorithm ... 30 Figure III-2: The first case study with viewing pressure at the original condition and after
applying the demand driven analysis (DDA) in burst pipe 2... 31 Figure III-3: The first case study with viewing pressure at the original condition and after
applying the semi pressure driven analysis (SPDA) in burst pipe 2. ... 31 Figure III-4: The case study I: The pressure profile for route X by demand driven analysis
(DDA) for the original condition and burst pipes 2, 4 and 6. ... 32 Figure III-5: The case study I: The pressure profile for route X semi pressure driven analysis (SPDA) for the original condition and burst pipes 2, 4 and 6... 32 Figure III-6: El-Mustaqbal City (Egypt) outline specified by red lines parameter map from
Google Earth, ... 35 Figure III-7: The second case study with viewing pressure during the original condition and with the demand driven analysis (DDA) in burst pipe 2... 35 Figure III-8: The second case study with viewing pressure at the original condition and the semi pressure driven analysis (SPDA) in burst pipe 2. ... 37 Figure III-9: The case study II: The pressure scenario in DDA for route R1. ... 37 Figure III-10: The case study II: The pressure scenario for route R1 after applying SPDA
method... 38
CHAPTER IV: Enhance the Reliability of Water Distribution System Utilizing the Smart Middle Eastern Application
Figure IV-1: The first case study viewing pressure in original and ENPDA approach for burst pipe 2. ... 53 Figure IV-2: The second case study viewing pressure in original and ENPDA approach for burst pipe 2. ... 57
APPENDIX A: FIGURES
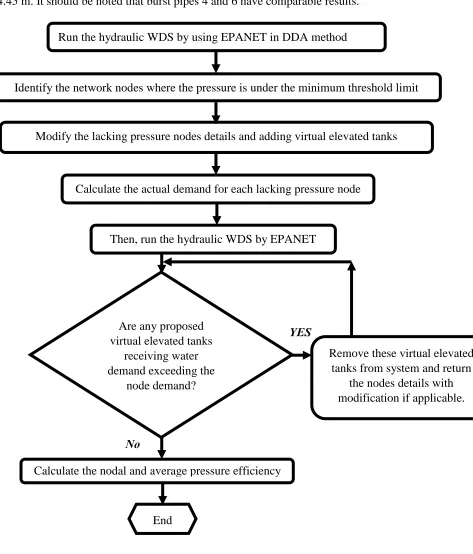
Figure A-2: The flow chart of the pipes networks analysis of emitter driven approaches for
normal and UNESCO (ENPDA and EUPDA) algorithms ... 75
Figure A-3: The smart Middle Eastern elevated balance tank (EBT) for determining reliability of water supply algorithm. ... 76
Figure A-4: The elevated balance tank hydraulic grade line. ... 77
Figure A-5: The elevated balance tank required volume. ... 77
Figure A-6: The case study I: The pressure route Y for original and burst pipes 2, 4 and 6. ... 78
Figure A-7: The case study I: The pressure route Z2 for original and burst pipes 2, 4 and 6. ... 78
Figure A-8: The case study II: The pressure route R2 for original and burst pipes 2, 3, and 8. ... 79
Figure A-9: The case study II: The pressure route R3 for original and burst pipes 2, 3 and 8. .... 79
Figure A-10: The first case study Network 2 with viewing base demand at the original and burst pipe 2 conditions in DDA. ... 80
Figure A-11: The first case study Network 2 with viewing base demand in original and after applying the semi pressure driven analysis in burst pipe 2 in SPDA. ... 80
Figure A-12: The case study I: The pressure profile for route Y by DDA for the original and burst pipes 2, 4 and 6. ... 81
Figure A-13: The case study I: The pressure profile for route Y by the semi pressure driven analysis for original condition and burst pipes 2, 4 and 6. ... 81
Figure A-14: The case study I: The pressure profile for route Z2 by the demand driven analysis for the original condition and burst pipes 2, 4 and 6. ... 82
Figure A-15: The case study I: The pressure profile for route Z2 by the semi pressure driven analysis for original condition and burst pipes 2, 4 and 6. ... 82
Figure A-16: The second case study El-Mustaqbal City network with viewing base demand at the original and burst conditions at pipe 2 in DDA. ... 83
Figure A-17: The second case study El-Mustaqbal City network with viewing base demand at the original and burst conditions pipe 2 in SPDA. ... 83
Figure A-18: The case study II: The pressure scenario for route R2 nodes. ... 84
Figure A-19: The case study II: The pressure scenario for route R2 nodes after applying SPDA approach. ... 84
Figure A-20: The case study II: The pressure scenario for route R3 nodes. ... 85
Figure A-21: The case study II: The pressure scenario for route R3 nodes after applying SPDA approach. ... 85
Figure A-22: The first case study Network 2 with viewing pressure at the original and after applying the emitter normal pressure driven analysis (ENPDA) in burst pipe 2. ... 86
Figure A-23: The first case study Network 2 with viewing pressure at the original and after applying the emitter normal pressure driven analysis (EUPDA) in burst pipe 2. ... 86
Figure A-24: The case study I: Network 2 with viewing pressure in original, SPDA, ENPDA .. 87
Figure A-25: The case study I: Network 2 with viewing pressure in original, SPDA, ENPDA and EUPDA after burst pipe 2 route Y. ... 87
LIST OF TABLES
CHAPTER IV: Enhance the Reliability of Water Distribution System Utilizing the Smart Middle Eastern Application in the Great Lakes
Table IV-1: Assessment of the negative impacts parameters on the different applied PDA methods
... 59
APPENDIX B: TABLES Table B-1: The first case study for the network pipelines ... 92
Table B-2: The first case study pressure efficiency for burst pipe scenarios ... 92
Table B-3: The second case study for the network pipelines ... 92
Table B-4: The second case study pressure efficiency for burst pipe scenarios ... 93
Table B-5: The case study I: The pressure efficiency analysis in DDA, SPDA, ENPDA and EUPDA for burst pipe 2 ... 94
Table B-6: The case study I: The pressure efficiency analysis in DDA, SPDA, ENPDA and EUPDA for burst pipe 4 ... 95
Table B-7: The case study I: The pressure efficiency analysis in DDA, SPDA, ENPDA and EUPDA for burst pipe 6 ... 95
Table B-8: The case study II: The pressure efficiency analysis in DDA, SPDA, ENPDA and EUPDA for burst pipe 2 ... 96
Table B-9: The case study II: The pressure efficiency analysis in DDA, SPDA, ENPDA and EUPDA for burst pipe 3 ... 97
Table B-10: The case study II: The pressure efficiency analysis in DDA, SPDA, ENPDA and EUPDA for burst pipe 8 ... 97
Table B-11: The case study I: The pressure efficiency analysis in DDA, ENPDA and EBT for Burst Pipe 2... 98
Table B-12: The case study I: The pressure efficiency analysis in DDA, ENPDA and EBT for burst pipe 4 ... 98
Table B-13: The case study I: The pressure efficiency analysis in DDA, ENPDA and EBT for burst pipe 6 ... 98
Table B-14: The case study II: The pressure efficiency analysis in DDA, ENPDA and EBT for burst pipe 2 ... 99
Table B-15: The case study II: The pressure efficiency analysis in DDA, ENPDA and EBT for burst pipe 3 ... 100
CHAPTER I
INTRODUCTION
Water distribution systems (WDS) represent the backbone of potable water supply that must be
reliably delivered to customers at acceptable levels of quality and quantity [1]. It includes all
potential operating conditions, such as extreme emergency scenarios like burst pipes or failed
pumping stations [2]–[4]. The hydraulics of WDS can be analyzed through two approaches:
demand-driven analysis (DDA) and pressure-driven analysis (PDA). DDA works well under
normal operating conditions while the PDA produces realistic results under the partially failed
conditions of a network [5], [6]. This study found that a smart solution to ensure water distribution
system reliability requires both the required pressure enhancements as well as necessary
reinforcements of the source of supply to the WDS.
1.0 Water Distribution Systems (WDS)
Hydraulic models that simulate the behaviour of WDS have become standard engineering tools of
water utilities for applications such as design, calibration, rehabilitation and operation [7]. DDA
is the conventional approach used as it assumes that demands are known functions at a certain time
and independent of the pressure in a WDS [8]. The objective of a hydraulic model is to create
nodal pressures, and pipe link flows that fulfill fixed demand values at system nodes [9]. Many
hydraulic models based on DDA have provided practical solutions under normal conditions [7],
[10]. A weakness in many hydraulic models is that they are not able to show how they will perform
during emergency conditions due to the negative pressure that can occur at nodes as the result of
1.1Demand-driven analysis (DDA)
DDA hydraulic simulators, such as EPANET, which are used in optimization processes, are
configured to simulate water delivery even when there is insufficient pressure to do so [11–13]. In
the analysis of physically poor pressure of WDS, recent studies have emphasized the limitations
of demand-driven models [14].
The supplied flow at a demand node is dependent on the pressure at that node of the WDS;
when the network is deficient in pressure, consumers’ demand for water cannot be fully
supplied [15]–[17]. The objective is to deliver the domestic water supply efficiently including the
fire flow at desirable pressures in large pipes [18]. Weak pressure sections are unavoidable in a
WDS and can occur as a normal part of operational problems, such as pump failure, pipe bursts,
the closing of main pipes, and extreme firefighting demands [19]. This approach is termed as
DDA and is used by nearly all the traditional network hydraulic modellers, such as EPANET [20].
Statistical analysis surveys globally show that 56% of utilities had no need for the maximum
pressure distributed to consumers, and 67% did not manage the ultimate pressures in their systems
[21].
The main disadvantage of the DDA is its inability to evaluate a less than operational network
performance, which may produce deviations in the components of water distribution systems [1].
An accurate evaluation of a fully functioning water network can be accomplished by assessing
demand through a pressure dependent analysis (PDA) [22]. This analysis approach presents a
modified application of DDA based on the hydraulic simulator EPANET 2.0 to integrate PDA
[23].
1.2Pressure dependent analysis (PDA)
pressurized networks. For scenarios in which regular conditions with sufficient pressure are present
DDA is accurate while providing a rapid and strong algorithm. DDA is used by almost all of the
traditional network hydraulic solutions, such as EPANET and KYPIPE [24], [25]. The PDA
models have become essential tools for hydraulic analysis of WDS under stress conditions and are
also applied for the modelling of leakages. In a simplified approach, PDA models can be based on
the principle of the emitter coefficient available in EPANET software [20]. Common approaches
assume the definition of pressure threshold as an indicator of a sufficient service level, which is
then used to switch between the DDA and PDA modes. A semi-pressure driven analysis (SPDA)
can be used to develop an algorithm for network analysis; it can avoid the problem of false negative
pressures due to forced demand conditions in the hydraulic analysis [26]. The technique called the
demand-driven analysis available-method (DDA-AM) can be used for a more realistic reliability
assessment of WDS compared to pure DDA. The pressure sensitive-demand implemented version
of EPANET uses the object-oriented modification of EPANET known as OOTEN and utilizes the
emitter functionality of traditional EPANET [26]. Furthermore, there are new numerical algorithms
that have produced results to handle PDA in networks [27]. EPANET 2.0 software was modified by
reforming the computational engines and adding the emitter equation for the entire node of WDS
to implement pressure sensitive demand in network calculations which is one of PDA methods
[26], [28].
1.3 The study’s main objectives and assumptions
The first objective of this study is to predict the impacts on the performance of the WDS during
normal and emergency conditions when the main pipes of the WDS burst. The second objective is
to evaluate and verify the result of applying SPDA as one of the common reliability analysis
for the water distribution network [29]. The third objective seeks to evaluate, verify and compare
the result of applying PDA methods that are SPDA, EPANET’s normal emitter method (ENPDA),
and EPANET’s UNESCO Emitter method (EUPDA). Each is a common reliability analysis
method that is modified to be more efficient in an emergency or during contingency scenarios of
a WDS [30]. The results of the approaches will be compared with each other and to the
conventional DDA to determine which method is more reliable, sensitive and time effective. The
fourth objective is to determine the smart Middle Eastern solution to enhance and reinforce the
reliable water supply in line with the selected PDA method. The smart Middle Eastern solution is
to allocate and design proper methods to eliminate the effects of emergency situations on WDS;
in this study elevated tanks are used.
1.4 The applied theory of reliability
The mandatory part of the network reliability model is the phase during which a network’s
deficiencies are predicted under partially failed conditions. DDA usually assumes that a nodal
demand is always satisfied regardless of the validity of the calculated pressure values at these
nodes [30], [31]. Consequently, once the pressure drops below the proposed threshold value, a
shortfall begins in the volume of water flow that is delivered to consumers. The threshold pressure
value for a junction depends on the type of service connection, and the amount of demand value
in the area served by this junction. In general, nodal heads of 14 m to 25 m can guarantee
satisfactory service at all related stop taps in a WDS [32]. An emitter is modelled as a setup of a
dummy pipe connecting the actual node with a dummy reservoir whose initial head equals the
nodal elevation. The standard DDA explains the factors that first place demands on the network
and then calculate the pressures in the system [33]. When there is enough pressure in the WDS,
1.5 The emitter approaches
Full featured and accurate hydraulic modelling is a prerequisite to creating effective water quality
modelling. EPANET contains a hydraulic analysis engine that can model the pressure dependent
analysis and the flow issuing from an emitter (sprinkler) with an EPANET normal emitter
pressure driven analysis including the demand time pattern that can be applied [34]. The emitter
exponent power going to that pressure is raised when computing the flow through an emitter
device that models the flow through a nozzle or orifice which discharges into the atmosphere
[35]. EPANET operates emitters as a property of a node and not as an independent WDS element
to compute the actual demand in a PDA [35], [36]. Emitter coefficients were first introduced in
EPANET to simulate the operation of fire hydrants and irrigation sprinkler systems. By specifying
the emitter’s coefficient, the demand node would turn into an emitter node.
1.6 The smart Middle Eastern solution
The smart Middle Eastern solution can be defined as the best practice for hydraulic analysis
applications to achieve the reliable water supply for WDS. The reliability assessment can lead to
applying either one or all of the smart solutions. The main objective is to supply a suitable quantity
of water with an acceptable level of pressure at all nodes under all modes of supply, such as peak
hourly demand or fire flow without further negative impact to WDS [37], [38]. Many suitable
smart solutions can, for example, increase the diameter size, provide an additional water source,
construct an additional pump station, build automated control systems, or provide an elevated
balanced tank. Many criteria can be considered; however, the three most important are the
following: criterion one is the topology characteristic of the ground level’s profile or the distance
from the community. The second criterion is the network’s features such as the pipe diameter, type
involves environmental factors such as the placement of the districts within the main cities, where
industrial areas are focussed, and the different temperatures between the winter and the summer
seasons.
1.7 Case studies
Two different WDS were used in this study to apply different approaches to resolving the
emergency cases. The first case study had a main, single source tank and a system using a three
pumping stations system. The second case study operated by gravity as the main single source tank
to analyze how the four different model approaches operated under emergency conditions. The
proposed, reliability model approaches include semi-pressure driven analysis (SPDA), and
EPANET normal emitter pressure driven analysis (ENPDA). Another important reliable approach
is EPANET-UNESCO emitter UNESCO pressure driven analysis (EUPDA). As well, the
conventional DDA model approach is demonstrated through WDS [39]. The smart Middle Eastern
solution depends on adding WDS’s components such as the elevated tank, pipeline, pumping
station, or automated water system, ensuring the reliable water supply. The smart solution has been
applied, and the proper size of the elevated balanced tank, location and the height have been
selected with a 110% extreme ultimate demand pattern. Extreme ultimate demand pattern is the
maximum design demand for the entire lifecycle of the certain WDS. The Middle Eastern smart
solutions provide strong enhancement and reinforcement to the WDS.
2.0References
]1[ S.S. Ozger and L.W. Mays, “A semi-pressure-driven approach to reliability assessment of water distribution networks,” Ph.D. thesis, Arizona State University, United States, 2003.
]3[ J. Van Zyl, J. Borthwick and A. Hardy, “Ooten: An object-oriented programmers toolkit for epanet,” Advances in Water Supply Management (CCWI, 2003), pp. 1-8, 2003.
]4[ L.S. Reddy and K. Elango, “Analysis of water distribution networks with head-dependent outlets,” Civil Engineering Systems, vol. 6, no. 3, pp. 102-110, 1989.
]5[ F. Martinez, M. Signes, R. Savall, M. Andrés, R. Ponz and P. Conejos , “Construction and use of dynamic simulation model for the valencia metropolitan water supply and distribution network,” in Water Industry Systems: Modeling and Optimization Applications, D.A. Savic and G.A.Walters, Eds. Baldock: Research Studies Press, 1999, vol. 1, pp. 155-174.
]6[ A.K. Soares, L.F.R. Reis and I.B. Carrijo, “Head-driven simulation model (HDSM) for water distribution system calibration,” Advances in Water Supply Management, Č. Maksimović, D. Butler, F.A. Memon, Eds. Lisse: Swets and Zeillinger, 2003. vol. 1, pp. 197-207.
]7[ M.S. Morley and C. Tricarico, “Pressure-driven demand extension for EPANET (EPANETpdd),” Technical Report 2008/02. Exeter: University of Exeter, 2008.
]8[ O. Giustolisi, D. Savic and Z. Kapelan, “Pressure-driven demand and leakage simulation for water distribution networks,” Journal of Hydraulic Engineering, vol. 134, no. 5, pp. 626-635, 2008.
]9[ M. Hayuti and R. Burrows, “Sequential solution seeking dda based hda (sss-dda/hda) approach,” in Proc. of Decision Support in the Water Industry under Conditions of Uncertainty-ACTUI 2004, 2004.
]10[ S.A. Moosavian and M.R. Jaefarzadeh, “Pressure-driven demand and leakage simulation for pipe networks using differential evolution,” World Journal of Engineering and Technology, vol. 1, Nov. 2013, 49-58.
]11[ T. Dasic and B. Djordjevic, “Method for water distribution systems reliability evaluation, ” in Proc. 9th International Congress on Environmental Modelling and Software. 138, 2004.
]12[ M. Tabesh, T. Tanyimboh and R. Burrows, “Pressure dependent stochastic reliability analysis of water distribution networks,” Water Science and Technology: Water Supply, vol. 4, no. 3, pp. 81-90, 2004.
]13[ R. Gupta, M. Agrawal and P. Bhave, “Reliability analysis of water distribution systems considering nodal storage facility,” in Proc. 30th IAHR Congress, 2003, pp. 271-278.
]15[ M.J. Cullinane, K.E. Lansey and L.W. Mays, “Optimization-availability-based design of water-distribution networks,” Journal of Hydraulic Engineering, vol. 118, no. 3, pp. 420-441, 1992.
]16[ R. Gupta and P.R. Bhave, “Comparison of methods for predicting deficient-network performance,” Journal of Water Resources Planning and Management, vol. 122, no. 3, pp. 214-217, 1996.
]17[ T. Tanyimboh, M. Tabesh, R. Gupta and P.R. Bhave, “Discussion and closure: Comparison of methods for predicting deficient-network performance,” Journal of Water Resources Planning and Management, vol. 123, no. 6, pp. 369-370, 1997.
]18[ M. Langford, J.-L. Daviau and D.Z. Zhu, “Design of a centralized regional water distribution system: A case study in the County of Paintearth No. 18, Alberta, Canada,” Canadian Journal of Civil Engineering, vol. 39, no. 7, pp. 801-811, 2012.
]19[ W.K. Ang and P.W. Jowitt, “Solution for water distribution systems under pressure-deficient conditions,” Journal of Water Resources Planning and Management, vol. 132, no. 3, pp. 175-182, 2006.
]20[ L. Rossman, EPANET 2 User’s Manual, National Risk Management Research Laboratory, Office of Research and Development, USEPA. Cincinnati: EPA Publication, 2000.
]21[ M. Xu, J. Yang, D.M. Hughes and M.W. LeChevallier, “Survey of pressure management in water distribution systems,” Journal American Water Works Association, vol. 106, no. 11, pp. E518-E524, 2014.
]22[ R.N. Allan, Reliability Evaluation of Engineering Systems: Concepts and Techniques. Boston: Pitman Advanced Pub. Program, 1983.
]23[ C. Siew and T.T. Tanyimboh, “Pressure-dependent EPANET extension,” Water Resources Management, vol. 26, no. 6, pp. 1477-1498, 2012.
]24[ G.B. Rossman and B.L. Wilson, “Numbers and words revisited: Being ‘shamelessly eclectic’,” Quality & Quantity, vol. 28, no. 3, pp. 315-327, 1994.
]25[ D. Wood, KYPipe Reference Manual, Lexington: Civil Engineering Software Center, University of Kentucky, 1995.
]26[ A. Pathirana, “EPANET2 desktop application for pressure driven demand modeling,”in in Proc. 12th Annual Conference on Water Distribution Systems Analysis (WDSA), 2010, pp. 65-74.
[ 28
] M. Radkrishnan, A. Pathirana, K. Ghebremichael and G. Amy, “Modelling formation of disinfection by-products in water distribution: Optimisation using a multi-objective evolutionary algorithm,” Journal of Water Supply: Research and Technology-AQUA, vol. 61, no. 3, pp. 176-188, 2012.
]29[ R. Gupta, A. Hussain and P.R. Bhave, “Water quality reliability based design of water distribution networks,” in World Environmental and Water Resources Congress 2012 : Crossing Boundaries, Eric D. Loucks, Ed. Reston: ASCE, 2012, pp. 3320-3330.
]30[ C. Suribabu, “Emitter based approach for estimation of nodal outflow to pressure deficient water distribution networks under pressure management,” Scientia Iranica. Transaction A, Civil Engineering, art. 10. vol. 22, no. 5, pp. 1765-1778, Sept. and Oct. 2015.
]31[ T.S. Riis, “Modeling Water Distribution Systems-Integration Between SCADA Systems and Hydraulic Network Simulation Models,” Master’s thesis, NTNU (Norwegian University of Science and Technology), Norway, 2016.
[ 32
] S. Ozger and L.W. Mays, “Optimal location of isolation valves in water distribution systems: A reliability/optimization approach,” in Water Resources Systems Management Tools, Larry W. Mays, Ed. New York: McGraw-Hill, 2005, pp. 7.1-7.28.
]33[ H. Maki, “Reliability assessment of water distribution networks under uncertain nodal demand and pipe roughness,” 2014
]34[ M. Arunkumar and V.N. Mariappan, “Water demand analysis of municipal water supply using epanet software,” International Journal on Applied Bioengineering, vol. 5, no. 1, pp. 9-19, 2011.
]35[ K.B. Senokonoko, “Hydraulic modelling of the water distribution system of Tavua-Vatukoula, Fiji,” Bachelor of Engineering, University of Southern Queensland, Australia, 2014.
]36[ S.N. Senyondo, “Using EPANET to optimize operation of the rural water distribution system at Braggs, Oklahoma,” Master’s thesis, Oklahoma State University, United States, 2009.
]37[ B. Coelho and A. Andrade-Campos, “Efficiency achievement in water supply systems—A review,” Renewable and Sustainable Energy Reviews, vol. 30, iss. C, pp. 59-84, Feb. 2014.
]38[ T. Tanyimboh, M. Tabesh and R. Burrows, “Appraisal of source head methods for calculating reliability of water distribution networks,” Journal of Water Resources Planning and Management, vol. 127, no. 4, pp. 206-213, 2001.
[ 39
1 Corresponding Author. Address: 401 Sunset Ave. Windsor, Ontario, Canada N9B 3P4; CHAPTER II
Water Distribution Networks Performance under Emergency Conditions
Ahmed Abdelaal, 1Rupp Carriveau and David S.-K. Ting
Turbulence and Energy Laboratory, Ed Lumley Centre for Engineering Innovation,
University of Windsor, Windsor, Ontario, Canada
NOMENCLATURE
DDA Demand Driven Analysis OOTEN Object Oriented Modification
D-W Darcy Welsbach PDA Pressure Driven Analysis
EPS Extended Period Simulation WDS Water Distribution Systems
H-W Hazen-William W-C White Colebrook
M Meter LPS Liter Per Second
Keywords: Demand-Driven Analysis; Efficiency; EPANET; Hydraulic; Pressure Driven
Analysis; Water Distribution System
1.0Introduction
Water distribution systems (WDS) represent the backbone of potable water supply. A key factor
in potable water supplies is that water must be reliably delivered to customers at acceptable levels
of quality and quantity [1]. This includes all potential operating conditions, such as extreme
emergency scenarios like burst pipes or failed pumping stations [2]-[4]. The fixed-demand
hydraulics engine EPANET software, in its original form, is not suitable for the analysis of water
distribution networks with low operating pressures [5]-[8]. Hydraulic models that simulate the
behaviour of WDS have become standard engineering tools of water utilities for applications such
which assumes that demands are known functions at a certain time independent of the pressure in
the system [15]. The objective of a hydraulic model is to create nodal pressures, and pipe link
flows that fulfill fixed demand values at system nodes [16]. Water utilities have, in the Middle
East, applied guidelines or have collected field data to evaluate and verify system demands to be
used as input within these simulation models [9], [17]. Many hydraulic models based on DDA
have provided practical solutions under normal conditions. The models are not able to show
real-life behaviour during emergency conditions because of the negative pressure that can be reached
[18]. Demand-driven hydraulic simulators, such as EPANET, which are used in optimization
processes, are configured to simulate water delivery even when there is insufficient pressure to do
so [18]–[20]. In the analysis of physically poor pressure of WDS, recent studies have emphasized
that the restriction, the availability of minimum threshold pressure, to use the demand driven
models [21]. The current research explores the reason and the need for this restriction. To
overcome the mentioned restrictions, reliable hydraulic performance can be achieved by utilizing
another hydraulic approach like Pressure Driven Analysis, PDA [11]-[14]. The second approach
is to apply surrogate reliability process to simplify the calculation analysis with a high degree of
accuracy for pressure deficient water distribution systems [22].
1.1 The current applied method
The traditional hydraulic analysis, EPANET, is the hydraulic model in which a nodal demand is
supplied without consideration of the availability of the pressure. In this type of model, even when
the pressure is negative, the nodal demand is still supplied, which is not realistic. This type of
analysis approach is called demand-driven analysis or DDA [23], [24]. DDA is the first step in all
reliability or calibrated analysis methods. To achieve the required demand at a certain node, the
The DDA approach has limitations in its ability to analyze water distribution systems (WDS) when
the pressure is low during emergencies, when a pipe has burst, when there is a pumping failure or
when firefighting is in progress [27], [28].
1.2The main objectives and assumptions
The first objective of this paper is to predict the impacts on the performance of a water distribution
system during both normal and emergency conditions. The first case study will examine the WDS
performance when there are burst pipes in pipes 2, 4 and 6. The second case study will examine
WDS performance when there are burst pipes in the main pipes 2, 3 and 8. The second objective
is to illustrate the demand-driven analysis characteristics and its standard performance in handling
these emergency scenarios. Certain limitations, as well as the assumption that the flow is
one-dimensional, are required to achieve these two objectives. The steady state flow with a minimum
pressure range is set from 1.4 bar to 2.5 bar, or 14.0 m to 25.0 m head. In this study, the applied
frictions factor equations are: Hazen-William (H-W); Darcy Welsbach (D-W); and White
Colebrook (W-C) equations. As well, the velocity will be limited in the range of 0.3 m/sec and 3.0
m/sec. All minor losses are not applicable to valves or pipes because they are very small. The pipe
diameter range used in the study ranges from 0.1 m to 2.0 m. The main assumption of the study is
that only one pipeline will burst in each scenario of the emergency hydraulic model.
1.3The applied criteria and algorithm
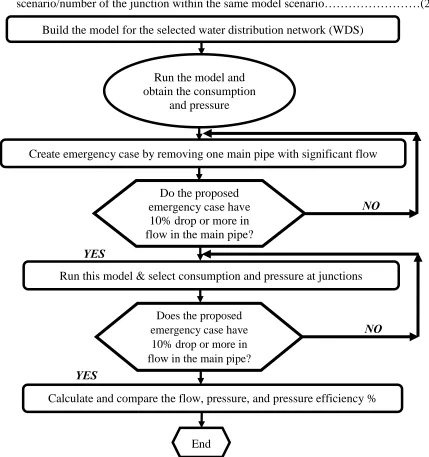
The applied criteria per the flow chart (see Fig. II-1)are listed below:
1. Build and run water distribution network model as usual for normal status.
2. Extract the consumption and pressure for each junction.
3. Create spreadsheet table that includes the extracted consumption and pressure.
5. Extract the pressure and consumption to a spreadsheet table.
6. Calculate the efficiency of the available pressure at each junction in the following manner:
a. Junction Efficiency = the current junction pressure for the model scenario with specific
burst pipe / the pressure for the same junction of the original model scenario…….…(2.1)
b. Average Efficiency = the summation of the efficiency for each junction within model
scenario/number of the junction within the same model scenario………(2.2)
Figure II-1: The flow chart of the pipes networks analysis by demand driven analysis (DDA)
NO OO
Create emergency case by removing one main pipe with significant flow Build the model for the selected water distribution network (WDS)
Run the model and obtain the consumption
and pressure
Run this model & select consumption and pressure at junctions
Calculate and compare the flow, pressure, and pressure efficiency %
End
NO
YES
Do the proposed emergency case have
10% drop or more in flow in the main pipe?
Does the proposed emergency case have
10% drop or more in flow in the main pipe?
2.0Case Studies
In the current study, there are two case studies which have been applied as follows:
2.1 The first case study
The proposed reliability evaluation and optimization methods are demonstrated within a
hypothetical example of a water distribution system. The system has a single source node; one
pumping station has three pumps, 16 demand nodes and 33 links as shown in Fig. II-2. This
network is a theoretical network and utilized in by many researchers for example reference [26].
This WDS was selected because it contains many of the fundamental elements of a water
distribution system [26]. The hydraulic analysis is applied to normal water demand scenarios and
three emergency scenarios for burst pipes 2, 4 and 6, respectively, as follows:
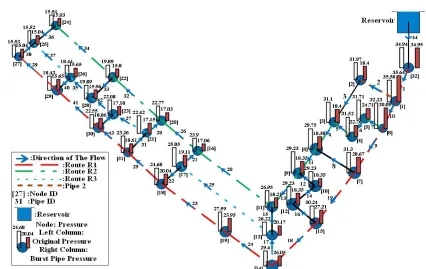
Figure II-2: The first case study viewing pressure at the original and burst pipe 2.
2.1.1 The analysis of the first case study results
First of all, it should be noted that the obtained pressure and consumption for each node have been
and 83.95 lps accordingly. Pipes 2, 4 and 6 are selected for the analysis of reliability since they are
the main pipeline with a huge flow rate that is equal to 10% or more than the flow in WDS.
Secondly, it should be noted that the full analysis, as shown in Table B-2 (in Appendix B),
demonstrates that the WDS’s pressure efficiency for burst pipes 2, 4 and 6 are 6.25 %, 6.8 % and
27.64 %, respectively, compared to the original pressure.
Additionally, Fig. II-2 represents the WDS with the original pressure column, which is high
enough to supply the network with pressure above the minimum threshold within a range of 34.47
m to 68.94 m. It also shows that the pressure column of burst pipe 2 is low and this is in a range
between 17.23 m to 34.47 m, which was reduced dramatically compared with the pressure at the
same nodes of the original WDS. The scenarios with burst pipes 4 and 6 indicate a large reduction
in pressure range as shown in Table B-2 (Appendix B).
Also of relevance is the demand for both scenarios. That is the original WDS analysis and the one
with burst pipe 2 have the same value, while the pressure was reduced sharply without any effect
on the demand or the flow rate. The results suggest that the DDA model analysis provides suitable
pressure efficiency when the pressure is above or within the minimum requirement of 14–25 m,
while in an emergency it does not have reliability when the pressure is less than 14 m.
2.1.2 The first case study result verification
To verify the analysis of the original hydraulic scenario and the three scenarios (burst pipes 2, 4
and 6), the pressure profile should be traced through three different routes within the WDS, which
are X, Y and Z2. The route means the flow track is in a certain direction within WDS. The three
traced routes (X, Y and Z2) started from the node near the source of the supply (node 20), and are
directed to the far nodes of the WDS based on the flow directions. The three routes should provide
nodes in the WDS [18]. Fig. II-3 as well as Fig. A-6 and Fig. A-7 (in Appendix A) illustrate the
profile pressure in both original WDS scenarios and the WDS scenario for the burst pipes 2, 4 and
6.
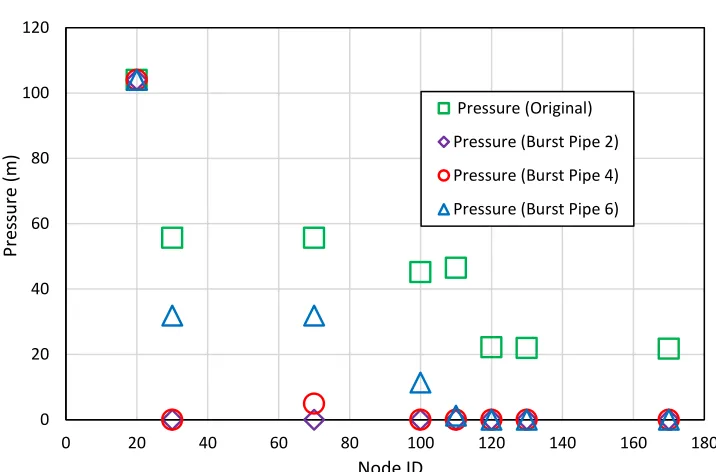
Figure II-3: The first case study: The pressure route X for original and burst pipe 2, 4 and 6.
2.1.2.1Route X
Shown in Fig. II-3 are the scenario results for burst pipes 2, 4 and 6. The results demonstrate the
pressure profile for the original WDS scenario from 20–105 m where the demand can be achieved.
The figure illustrates the pressure profile of WDS for burst pipe 2 scenario; it is in the range of 0–
105 m and the most of nodes have a pressure equal to zero. This is in line with a pressure efficiency
of 6.25% as seen in Table B.2 (Appendix B). The WDS for the scenario of burst pipe 4 has a
pressure profile to be in the range of 0–105 m and most of the nodes have a pressure equal to 0.
Route X has a robust agreement with pressure efficiency of 6.8% as seen in Table B-2 (Appendix
B). The table also illustrates the pressure profile for burst pipe 6 to be in the range of 0–105 m with
0 20 40 60 80 100 120
0 20 40 60 80 100 120 140 160 180
Pre
ss
u
re
(m
)
Node ID
Pressure (Original)
Pressure (Burst Pipe 2)
Pressure (Burst Pipe 4)
pressure in the range from 30–12 m for many of the nodes that are in line with a scenario pressure
efficiency of 27.4%.
2.1.2.2Route Y
Fig. A-6 (in Appendix A), regarding burst pipes 2, 4 and 6, represents the pressure profile for the
original WDS scenario that is in the range of 20–105 m where the demand can be accommodated.
The figure also illustrates similar pressure profiles for burst pipes 2, 4 and 6, which are the same
as the pressure efficiency of route X.
2.1.2.3Route Z2
Fig. A-7 (in Appendix A), for burst pipes 2, 4 and 6, represents the pressure profile for the original
WDS scenario from 20 to 105 mm where the demand can be accommodated. The figure illustrates
similar pressure profiles for burst pipes 2, 4 and 6 that are the same as the pressure efficiency of
routes X and Y. These pipes represent a highly significant flow rate above 10% of the flow in
WDS.
2.2The second case study
The proposed reliability evaluation and verification methods are demonstrated using a theoretical
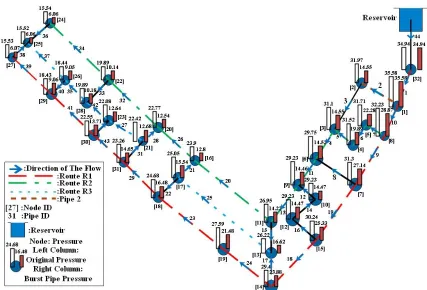
example of a water distribution system (WDS). It is a system with a single source node, 32 nodes
and 44 links shown in Fig. II-4. This WDS is based on research on the planned future city of
El-Mustaqbal, in Egypt, because it contains all the significant elements as pipelines, nodes, and
reservoir of a water distribution system (WDS) [29]. There are 32 junctions and one reservoir.
However, there are no tanks, no pumps and no valves. Finally, the flow rate entering the WDS is
352.49 lps, the pipes’ diameter is between 150 mm–600 mm. The model has been applied using
DDA under normal conditions as well as three emergency scenarios with burst pipes 2, 3 and 8 as
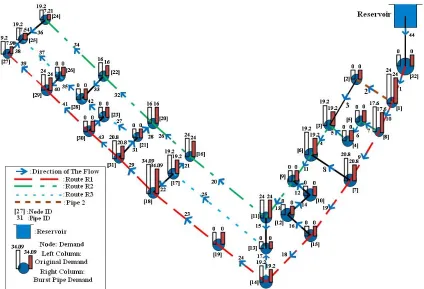
2.2.1 The analysis of the second case study’s results
In Table B-3 (in Appendix B), the analysis shows that pipe 2 (300 mm in diameter) originally
supplied 100.82 lps; pipe 3 (300 mm in diameter) supplied 100.82 lps, and pipe 8 (150 mm in
diameter) supplied 9.17 lps. Pipe 8 is selected to evaluate the pressure efficiency where the flow
is lower than 10% of the WDS’ total inflow. In Table B-4 (in Appendix B), the WDS pressure
efficiency for the scenario of burst pipes 2, 3 and 8 is shown to equal 60.96%, 62.66% and 99.36%,
respectively, compared to the original pressure.
Figure II-4: The second case study viewing pressure at the original and burst pipe 2.
Fig. II-4 represents the pressure column of the original scenario of WDS and the pressure column
for the original WDS analysis, which are high enough to supply the network with pressure above
the minimum threshold with a range between 15–45 m. The case of burst pipe 2 has pressure in
can be applied to burst pipe 3. However, the analysis is not applicable to burst pipe 8 since it has
a low flow rate that is less than 10% of WDS’ total inflow in with no impact on the efficiency.
Fig. II-5 shows the demand in both original scenario and the burst pipe 2 scenario as shown in
Table B-4 (in Appendix B). While the pressure is reduced sharply without affecting flow rate and
consumption. The DDA provides good efficiency when the pressure is above the minimum
requirement. However, in an emergency scenario, it would not be reliable.
The demand for both scenarios as found in the original, as is shown in Fig. II-5, and for the
scenarios of burst pipes 2, 3 and 8 are the same, as is shown in Table B-4 (in Appendix B), while
the pressure reduced sharply without any effect on the flow rate or the consumption. The DDA
provides good efficiency when the pressure is above the minimum threshold pressure. However,
in an emergency scenario where there is low pressure and the DDA efficiency is low the DDA
does not provide reliable results.
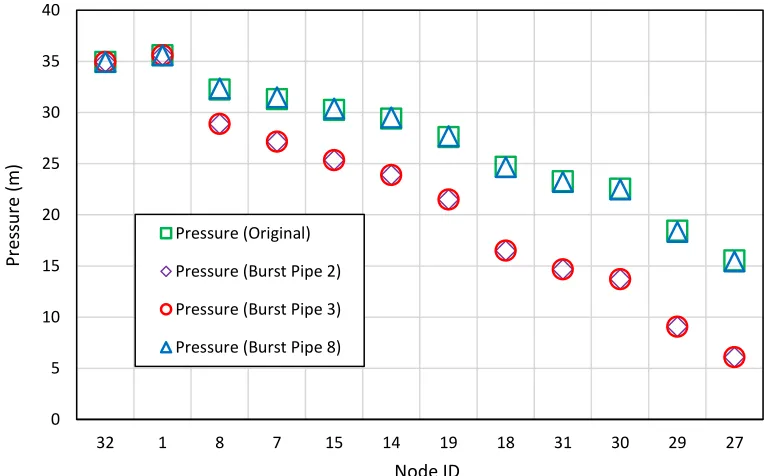
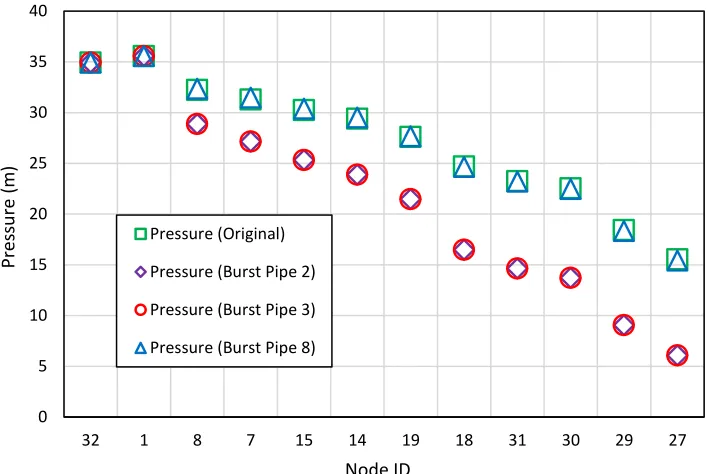
Figure II-5: The second case study: The pressure for route R1: burst pipes 2, 3 and 8.
0 5 10 15 20 25 30 35 40
32 1 8 7 15 14 19 18 31 30 29 27
Pres
su
re
(m
)
Node ID
Pressure (Original)
Pressure (Burst Pipe 2)
Pressure (Burst Pipe 3)
2.2.2 The second case study’s results—Verification
To verify the analysis of the original hydraulic scenario and the scenarios of the three burst pipes
2, 3 and 8, three different routes within the WDS were selected: R1, R2 and R3. These routes start
from node 32, near the source of the supply, and are directed to the far nodes of the WDS. The
flow routes are traced to examine the impact of the emergency on the pressure for different nodes
in the WDS. The figures illustrate the profile pressure in both the original WDS scenario and in
the WDS scenario for the burst specified pipe such as burst pipes 2, 3 and 8. The figures are verified
and validated by the obtained results as are discussed in the following sections.
2.2.2.1Route R1
Fig. II-5 focusses on burst pipes 2, 3 and 8; it demonstrates the pressure profile for the original
WDS scenario from 15–40 m where demand can be accommodated. The figure shows that the
pressure profile for the WDS scenarios of burst pipes 2 and 3 is in the range of 5–35 m with low
pressure at many nodes that have low-pressure efficiency.
Fig. II-5 illustrates the pressure profile in the WDS scenario for burst pipe 8, which is in the range
of 20–35 m where the pressure is above the minimum threshold pressure (14 m) for all the nodes.
Both the pressure profiles of the original WDS and the WDS for the burst pipe 8 have similar
trends and approximately the same efficiency values equal to 99.36%, which is very high, as the
flow through pipe 8 is very small at 9.17 lps and that is less than 10% for the overall total flow.
2.2.2.2Route R2
Fig. A-8 (in Appendix A) shows similar results as those found in routes R1 and R2 for the burst
pipes 2, 3 and 8, respectively. The verification proves that the results have a high level of
2.2.2.3Route R3
Fig. A-9 (in Appendix A) show similar results like the previous analysis in routes R1 and R2 for
burst pipes 2, 3 and 8, respectively. This verification proves that the results have a high level of
agreement regarding the accuracy of the analysis of the different routes.
3.0Conclusion
The purpose of this study is to clarify the limitations of the traditional hydraulic model
(demand-driven analysis) DDA for scenarios where demands may reach emergency levels. The EPANET
hydraulic simulation model presented both normal and emergency water distribution scenarios for
two different case studies. The two WDSs case studies illustrate both the DDA characteristics as
well as its standard performance in handling these emergency scenarios. There is a variation in the
performance of the two WDS during the original and emergency conditions when the DDA method
was applied to the systems. The results of the two WDS show that the pressure profile and pressure
efficiency for the burst pipe scenarios are lower than the original pressure profile, with no change
in node demand. In conclusion, the traditional hydraulic analysis is built on the concept of DDA
where the nodal demands have to reach the consumer without consideration of the available
pressure heads. As a result, the network may experience low or negative pressure, which is less
than the threshold pressure of the WDS. The results of the analysis indicate that the pressure driven
analysis (PDA) modelling should be applied to two different networks under burst pipe conditions
to measure the ability of PDA modelling to perform under conditions when there is an insufficient
amount of nodal pressure.
4.0Acknowledgement
I would like to thank my professors who supported me throughout the process to complete the
5.0References
[1] S.S. Ozger and L. Mays, “A semi-pressure-driven approach to reliability assessment of water distribution networks, Ph.D. thesis, Arizona State University, United States, 2003.
[2] L. Berardi, O. Giustolisi, Z. Kapelan and D. Savic, “Development of pipe deterioration models for water distribution systems using EPR,” Journal of Hydroinformatics, vol. 10, no. 2, pp. 113-126, 2008.
[3] J. Van Zyl, J. Borthwick and A. Hardy, “Ooten: An object-oriented programmers toolkit for epanet,” Advances in Water Supply Management (CCWI 2003), pp. 1-8, 2003.
[4] L.S. Reddy and K. Elango, “Analysis of water distribution networks with head-dependent outlets,” Civil Engineering Systems, vol. 6, no. 3, pp. 102-110, 1989.
[5] P. Cheung, J.E. Van Zyl and L.F.R. Reis, “Extension of EPANET for pressure driven demand modeling in water distribution system,” Computing and Control for the Water Industry, vol. 1, pp. 311-316, 2005.
[6] F. Martinez, M. Signes, R. Savall, M. Andrés, R. Ponz and P. Conejos, “Construction and use of dynamic simulation model for the valencia metropolitan water supply and distribution network,” in Water Industry Systems: Modeling and Optimization Applications, D.A. Savic and G.A.Walters, Eds. Baldock: Research Studies Press, 1999, vol. 1, pp. 155-174, 1999.
[7] A.K. Soares, L.F.R. Reis and I.B. Carrijo, “Head-driven simulation model (HDSM) for water distribution system calibration,” in Advances in Water Supply Management, C. Maksimović, D. Butler, F.A. Memon, Eds. Lisse: Swets and Zeillinger, 2003. vol. 1, pp. 197-207.
[8] L. Rossman, EPANET 2 User’s Manual, National Risk Management Research Laboratory, Office of Research and Development, USEPA. Cincinnati: EPA Publication , 2000.
[9] M.S. Morley and C. Tricarico, “Pressure-driven demand extension for EPANET (EPANETpdd),” Technical Report 2008/02. Exeter: University of Exeter, 2008.
[10] A. Saminu, N. Abubakar and L. Sagir, “Design of NDA water distribution network using EPANET,” International Journal of Emerging Science and Engineering (IJESE), vol. 1, no. 9, pp. 5-9, 2013.
[11] U. Tukur, “Design of NDA water treatment sedimentation tank,” submitted to Department of Civil Engineering, thesis, Nigerian Defence Academy, Kaduna, Nigeria, 2006.
[13] H. Cross, “Analysis of flow in networks of conduits or conductors,” University of Illinois Bulletin, University of Illinois at Urbana Champaign, College of Engineering, Engineering Experiment Station, bull. 286, vol. XXXIV, no. 32, Nov. 13, 38 pp., 1936.
[14] U.Y. Shamir and C.D. Howard, “Water distribution systems analysis,” Journal of the Hydraulics Division, vol. 94, no. 1, pp. 219-234, 1968.
[15] O. Giustolisi, D. Savic and Z. Kapelan, “Pressure-driven demand and leakage simulation for water distribution networks,” Journal of Hydraulic Engineering, vol. 134, no. 5, pp. 626-635, 2008.
[16] M. Hayuti and R. Burrows, “Sequential solution seeking dda based hda (sss-dda/hda) approach,” in Proc. of Decision Support in the Water Industry under Conditions of Uncertainty-ACTUI 2004, 2004.
[17] S.A. Moosavian and M.R. Jaefarzadeh, “Pressure-driven demand and leakage simulation for pipe networks using differential evolution,,” World Journal of Engineering and Technology, vol. 1, Nov. 2013, 49-58.
[18] T. Dasic and B. Djordjevic, “Method for water distribution systems reliability evaluation, ” in Proc. 9th International Congress on Environmental Modelling and Software. 138, 2004.
[19] M. Tabesh, T. Tanyimboh and R. Burrows, “Pressure dependent stochastic reliability analysis of water distribution networks,” Water Science and Technology: Water Supply, vol. 4, no. 3, pp. 81-90, 2004.
[20] R. Gupta, M. Agrawal and P. Bhave, “Reliability analysis of water distribution systems considering nodal storage facility,” in Proc. 30th IAHR Congress, Theme B: Urban and Rural Water Systems for Sustainable Development. Č. Maksimović and V. Kaleris, Eds. 2003, pp. 271-278.
[21] M.S. Islam, R. Sadiq, M.J. Rodriguez, H. Najjaran and M. Hoorfar, “Reliability assessment for water supply systems under uncertainties,” Journal of Water Resources Planning and Management, vol. 140, no. 4, pp. 468-479, 2013.
[22] T.T. Tanyimboh, M.T. Tietavainen and S. Saleh, “Reliability assessment of water distribution systems with statistical entropy and other surrogate measures,” Water Science and Technology: Water Supply, vol. 11, no. 4, pp. 437-443, 2011.
[23] R. Gupta, “Reliability-based analysis and design of water distribution system,” Ph.D. thesis, Nagpur University, India, 1994.
[25] T.T. Tanyimboh and Y. Setiadi, “Joint layout, pipe size and hydraulic reliability optimization of water distribution systems,” Engineering Optimization, vol. 40, no. 8, pp. 729-747, 2008.
[26] J.M. Wagner, U. Shamir and D.H. Marks, “Water distribution reliability: Analytical methods,” Journal of Water Resources Planning and Management, vol. 114, no. 3, pp. 253-275, 1988.
[27] M. A. Sayyed, R. Gupta and T. Tanyimboh, “Modelling pressure deficient water distribution networks in EPANET,” Procedia Engineering, vol. 89, pp. 626-631, 2014.
[28] K.R. Piratla and S.T. Ariaratnam, “Assessment of metrics for resilient design of water distribution networks,” Journal of Water Supply: Research and Technology-AQUA, vol. 64, no. 6, pp. 660-669, 2015.
CHAPTER III
Water Distribution Network Performance by using Semi Pressure Driven Analysis Approach during Emergency Conditions
Ahmed Abdelaal, 1Rupp Carriveau and David S.-K. Ting
Turbulence and Energy Laboratory, Ed Lumley Centre for Engineering Innovation,
University of Windsor, Windsor, Ontario, Canada
NOMENCLATURE
DDA Demand Driven Analysis OOTEN Object Oriented Modification
DDP Demand Dependent Pressure PDA Pressure Driven Analysis
EPS Extended Period Simulation SPDA Semi Pressure Driven Analysis
H-W Hazen-William WDS Water Distribution Systems
M Meter LPS Liter Per Second
Keywords: Demand-Driven Analysis; Efficiency; EPANET; Hydraulic; Pressure Driven
Analysis; Water Distribution System
1.0 Introduction
The supplied flow at a demand node is dependent on the pressure at that node of the WDS
when the network is deficient in pressure, and the consequence of that deficient pressure is that
consumer demand will not be fully supplied [1]–[4]. Weak pressure sections are unavoidable
in WDS and can happen as a normal part of operational problems, such as pump failure, pipe
bursts, the closing of main pipes, or extreme firefighting demands [5], [6]. This approach is
termed as DDA and is used by nearly all the traditional network hydraulic modelling software,
such as EPANET [7], [8]. The main disadvantage of DDA is its inability to evaluate the pressure
and flow performance in WDS, which may affect the analysis and the proper design of the
A true illustration of a water network’s functioning can be accomplished by linking demands
to the PDA [10]. This approach presents a modified application of the well-known DDA that
is based on the hydraulic model EPANET 2.0 to integrate pressure dependent demand (PDD)
[11]. The reliability is based on the hypothesis of connectivity and assumes a WDS is continuously
connected to the topological elevation of the system. This study considered the hydraulic approach
as it is fully hydraulic calculation with actual collected data [11], [12]. The PDA method is a
realistic approach to the hydraulic analysis of water distribution systems with a priority placed on
the pressure within the network [13]. Each node can reach the completion demand only if a
minimum required pressure is satisfied at that node. If the minimum pressure required cannot be
met, then only a partial demand can be satisfied in these nodes. Moreover, the hydraulics of a water
distribution system can be approached from several different perspectives. The difference between
the approaches comes from the level of primacy given to nodal demands versus nodal pressures
[1]. The different flow head relationships provide a detailed comparison of proposed hydraulic
analysis approaches by researchers [4], [16]. This is demonstrated by the following equation:
Hj = Hjmin+ KjQj nj
(1)
Where: Hj is the head at node j, Qjis the demand at that node, Kjis the flow resistance coefficient,
nj is an exponent, and Hjmin is the threshold pressure below which the outflow at the node is
inadequate or 0. A reliable hydraulic performance can also be achieved by utilizing a surrogate
reliability process to simplify the calculation analysis with high accuracy [17]. A reliability
analysis established through a combination of the extended period simulation (EPS) of WDS and
the pressure driven approach (PDA) is more accurate than the traditional DDA [18], [19].
1.1The applied solution method
the minimum pressure required, and it can be applied to any network where the pressure is less than
the minimum threshold pressure [4]. The enhanced water supply demand calculated by the SPDA
method might be less than the supplied water demand calculated by the conventional demand node
method [20], [21]. Both methods will be compared, evaluated and verified with an original scenario
for each network.
1.2The main objective and assumption
The current study seeks to evaluate and validate the result of applying the semi-pressure method
as one of the common reliability analysis methods and to establish the most efficient method of
water supply for a water distribution network during the emergency or contingency [22]. Both
DDA and SPDA illustrate and evaluate the network’s performance during normal and emergency
conditions when main pipe bursts or is removed [23]. The present study is operating under that
assumption that the flow is a one-dimension flow, with a minimum threshold pressure that equals
14 m. The number of iterations is 8 with a tolerance that will not exceed 0.5%. Any negative
pressure will be considered to be 0. The study’s operating assumptions also include that: the
velocity is in the range between 0.3 m/sec and 3 m/sec: no minor losses are applicable; the pipe
diameter is in the range from 0.1 m to 2.0 m; and that only one pipe segment will be considered
burst/closed in each scenario. The efficiency equations for the study are as follows:
a. Junction Efficiency = the current junction pressure for the model scenario with a certain
burst pipe / the pressure for the same junction of the original model scenario………....(3.1)
b. Average Efficiency = the summation of the efficiency for each junction within the model’s
scenario/number of the junction within the same model scenario………..……..(3.2)
1.3The applied criteria and algorithm