HIBISCUS SABDARIFFA ANTHOCYANIDINS: A POTENTIAL TWO-COLOUR END-POINT INDICATOR
IN ACID-BASE AND COMPLEXOMETRIC TITRATIONS.
Okonkwo, Tochukwu Josiah Nnaemeka
Department of Pharmaceutical Chemistry, Faculty of Pharmaceutical Sciences, University of Port Harcourt, Choba, Port Harcourt, Rivers State-Nigeria.
*Email: [email protected]
ABSTRACT
Hibiscus Sabdariffa petals commonly known as Zobo in Northern Nigeria, was dried, pulverized into fine powder and extracted
exhaustively with methanol by the hot maceration method. The Ultra-violet/visible light absorption spectra of the methanol extract at varying pH values (1-14) were also obtained and recorded. The extract was analysed to confirm the presence of anthocyanidins, and subsequently employed as end point indicator in acid-base and complexometric titrations. Its end-point indicating power was compared with those of standard end-point indicators: phenolphthalein, methyl red and eriochrome black T. The extract tested positive for anthocynidins and its end-point indicating power compared favorable (p < 0.05) to those of erichrome black T and methyl red in complexometric and acid-base titrations, respectively. Prominent absorption in the 500 - 550 nm wavelength region of the uv/visible spectrum of the methanol extract, confirmed the presence of anthocyanidins. Absorption within 200 - 350 nm also indicated the presence of flavonoids of the flavone and flavonol types. The entire absorption spectrum of the extract in method, suffered bathochromic and hypsochromic shifts in alkaline and acid media, respectively. Thus, H. sabdariffa contains excessive anthocyanidins, which could be used as an end-point indicator in acid-base and complexometric titrations.
Keywords: Hibiscus sabdariffa, anthocyanidins, two-colour end-point indicator, acid-base and complexometric titrations.
INTRODUCTION
Hibiscus sabdariffa (Fam: Malvaceae), commonly known as Red tea, is used in the tropics as emollient, purgative, sedative, stomachic, digestive, demulcent, tonic and aphrodisiac. The sweet–sour herb is traditionally used in making herbal tea, in the tropics. The fleshy calyx is invaluable for making roselle wine, jelly syrup, gelatin, refreshing beverages, pudding and lakes. In West indices, H. sabdariffa calyx is used to colour and flavour rum. The flower contains gossypetin anthocynanidins and glycoside hibiscin, which may have diuretic and choleretic effect, decreasing the viscosity of blood, reducing blood pressure and stimulating intestinal peristalsis.1
Manita–mishra2 documented a number of compounds that have been isolated and characterized from H. sabdariffa, which included flavonoids, anthocyanidins, triterpernoids, steroids, alakaloids, sesquiterpenes, quinines, and naphthalenes. Two major anthocynadins: delphinidine–3–sambubioside (hibiscins) and cyanidine– 3–sambubioside (gossy picyanin) were isolated from methanol extract of H. sabdariffa petal.
Anthocyanidins (anthocyanins) are notable plant pigments, which are responsible for the red-violet-blue colour seen in plant flowers.3 They are water-soluble and generally occur in the aqueous cell sap. Structurally, anthocyinidins are polyhydroxy derivations of flavylium chloride.3 Anthocynidins are classified as flavonoids because of their structural similarities to flavone – the base structure of certain plan pigments (flavones, flavonols, etc) known as flavonoids. The anthocyanidin pigments are amphoteric, their acid salts are usually red, base salts green, metal salts blue and in neutral solution
anthocynidins are violet.4 Utraviolet-visible light spectrum of anthocyanidins usually shows prominent bands in the 500 - 550 nm region, depending on the prevailing degree of conjugation.5 Thus, potential utilization of H. sabdariffa anthocyanidins as two-colour end-point indictor in acid-base and complexometric titrations was investigated. Since, anthocyanidins show characteristic (different) colours as the concentration of hydrogen and metallic ions change in solutions.
MATERIALS AND METHODS
Collection of plant materials and preparations of extract
Hibiscus Sabdariffa petals were purchased at Ogige Market, Nsukka, Enugu State – Nigeria, in early March, 2006. The plant material was identified and authenticated by Mr. Alfred Ozioko, Taxonomist, of Biodiversity Development and Conservation Progrmme (BDCP), Aku Rd., Nsukka, Enugu State−Nigeria. A voucher specimen
BDCPH/289 was deposited at the institute’s herbarium. The petals were air-dried to a constant weight and pulverized into a coarse powder. The petals were exhaustively extracted in 300-ml aliquots of absolute methanol, using the hot maceration technique. After 4 hrs, the macerate was agitated vigorously; the supernatant filtered off and H. sabdariffa crude anthocynanidins was obtained (HSCA). HSCA yield was determined, and the sample store in a refrigerator at 0 – 4%.
Reagent and apparatus
Saulter analytical balance, evaporating dishes, test tubes, 20-ml glass beaker, test tube holders, electric hot place, funnel, spatula, Whatman filter paper, measuring cylinder, amber coloured bottle, refrigerator and milling machine were among the important instrument utilized.
Preparation of pH buffer solutions
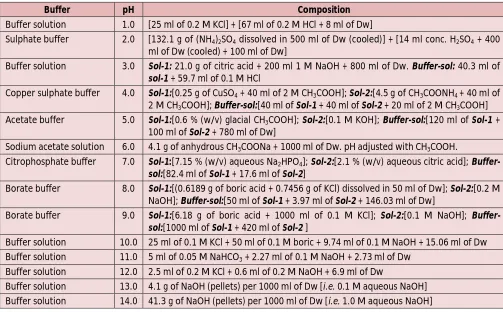
Buffer solutions of pH values 1 – 14 were prepared as indicated in Table 1. Their exact pH values were monitored and confirmed by two replicate reading in a pH-meter.
Table 1: Composition and pH values of buffer solutions
Buffer pH Composition
Buffer solution 1.0 [25 ml of 0.2 M KCl] + [67 ml of 0.2 M HCl + 8 ml of Dw]
Sulphate buffer 2.0 [132.1 g of (NH4)2SO4 dissolved in 500 ml of Dw (cooled)] + [14 ml conc. H2SO4 + 400 ml of Dw (cooled) + 100 ml of Dw]
Buffer solution 3.0 Sol-1: 21.0 g of citric acid + 200 ml 1 M NaOH + 800 ml of Dw. Buffer-sol: 40.3 ml of sol-1 + 59.7 ml of 0.1 M HCl
Copper sulphate buffer 4.0 Sol-1:[0.25 g of CuSO4 + 40 ml of 2 M CH3COOH]; Sol-2:[4.5 g of CH3COONH4 + 40 ml of 2 M CH3COOH]; Buffer-sol:[40 ml of Sol-1 + 40 ml of Sol-2 + 20 ml of 2 M CH3COOH] Acetate buffer 5.0 Sol-1:[0.6 % (w/v) glacial CH3COOH]; Sol-2:[0.1 M KOH]; Buffer-sol:[120 ml of Sol-1 +
100 ml of Sol-2 + 780 ml of Dw]
Sodium acetate solution 6.0 4.1 g of anhydrous CH3COONa + 1000 ml of Dw. pH adjusted with CH3COOH.
Citrophosphate buffer 7.0 Sol-1:[7.15 % (w/v) aqueous Na2HPO4]; Sol-2:[2.1 % (w/v) aqueous citric acid]; Buffer-sol:[82.4 ml of Sol-1 + 17.6 ml of Sol-2]
Borate buffer 8.0 Sol-1:[(0.6189 g of boric acid + 0.7456 g of KCl) dissolved in 50 ml of Dw]; Sol-2:[0.2 M NaOH]; Buffer-sol:[50 ml of Sol-1 + 3.97 ml of Sol-2 + 146.03 ml of Dw]
Borate buffer 9.0 Sol-1:[6.18 g of boric acid + 1000 ml of 0.1 M KCl]; Sol-2:[0.1 M NaOH]; Buffer-sol:[1000 ml of Sol-1 + 420 ml of Sol-2 ]
Buffer solution 10.0 25 ml of 0.1 M KCl + 50 ml of 0.1 M boric + 9.74 ml of 0.1 M NaOH + 15.06 ml of Dw Buffer solution 11.0 5 ml of 0.05 M NaHCO3 + 2.27 ml of 0.1 M NaOH + 2.73 ml of Dw
Buffer solution 12.0 2.5 ml of 0.2 M KCl + 0.6 ml of 0.2 M NaOH + 6.9 ml of Dw
Buffer solution 13.0 4.1 g of NaOH (pellets) per 1000 ml of Dw [i.e. 0.1 M aqueous NaOH] Buffer solution 14.0 41.3 g of NaOH (pellets) per 1000 ml of Dw [i.e. 1.0 M aqueous NaOH]
Determination of the ultraviolet/visible light absorption spectra of HSCA in pH buffer solutions (pH values 1 – 14)
A 2.0-g portion of HSCA was dissolved in 100 ml of absolute methanol to obtain a stock solution. To 2-ml aliquot of the stock solution, was added 2.0 ml of each buffer solution and shaken vigorously for 30 sec. The absorption spectra of the resulting mixtures (solutions) were obtained over 200 – 800 nm (at 1.0 nm scan interval) in Unico – UV – 2102 PC spectrophotometer. The observable colour of the stock at different pH media/values were also noted and recorded.
HSCA treated paper
Several 1.0 x 5.0 cm Whatman filter paper (qualitative) strips were submerged in 10-ml aliquot of HSCA stock solution for 2 min and dried in a stream of warm air. The treated papers were dipped 1 – 2 cm deep into 10.0-ml aliquot of each buffer solutions for 30 sec and dried for 2 min in air current. The resulting colour of the treated paper were noted and recorded.
Test for anthocyanidins
A 2.0-ml aliquot of the stock solution was run into a test tube containing 2.0 ml of 1 N aqueous NaOH, swirled for
30 sec and the resulting colour observed and recorded. Then, 4.0 ml of 1.0 N aqueous HCl was added and the colour, also, noted and recorded. A 2.0-ml aliquot of saturated (CH3COO)2Pb was run into a fresh 2.0-ml aliquot of the HSCA stock solution to develop a characteristic colour, which was noted and recorded.
Titration experiment
Titration of strong acid (SA) against strong base (SB)
A 20.0-ml aliquot of 2.0 gm NaOH in 500 ml of distilled water was pipetted into a conical flask, 3 drops of methyl red indictor solution added and subsequently titrated, thrice, against 0.1 N aqueous hydrochloric acid. The end-points were detected and recorded. The experiment was repeated, thrice, using 3 drops of HSCA stock solution as indicator. The end- points were noted and recorded.
Titration of strong acid (SA) against weak base (WB)
was repeated, thrice, using 3 drops of HSCA stock as indicator, to mark the end-points.
Titration of weak acid against strong base
A 20.0-ml aliquot of 2.65 g of sodium carbonate in 500 ml of distilled water was pipetted into a conical flask. Three drops of methyl red indicator solution was added and the content of the flask titrated, thrice, against 0.0N HCl (aq); to obtain a detectable end- points. The experiment was repeated, thrice, using 3 drops of HSCA stock as indicator, to mark the end-points.
Titration of weak acid (WA) against strong base (SB)
To 20.0-ml solution of 2.0 g NaOH in 500 ml of distilled water, was added 3 drops of phenolphthalein indicator solution and the mixture titrated, thrice, against 0.1 N acetic solution. The end-points were detected and recorded. The experiment was as well repeated, thrice, using 3 drops of HSCA stock as indicator to detect the end-points.
Complexometric titration
To a 100-ml aliquot of water sample was buffered with 2.0-ml of ammonia buffer solution was added 5 drops of
eriochrome black T. The sample was titrated, thrice, against 0.01 N disodium EDTA solution to detectable end-points. The experiment was repeated, thrice, employing 5 drops of HSCA stock as indicator, to determine the end-points.
Statistical analysis
Where applicable, the obtained results were expressed as mean S. E. M. The results were compared using the ‘comparing the mean method’ otherwise known as The Student t-test. They were considered significant at p < 0.05 & p < 0.01.
RESULTS
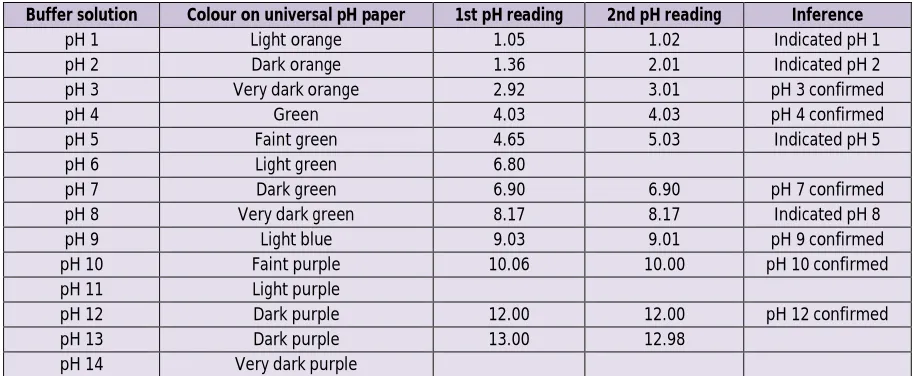
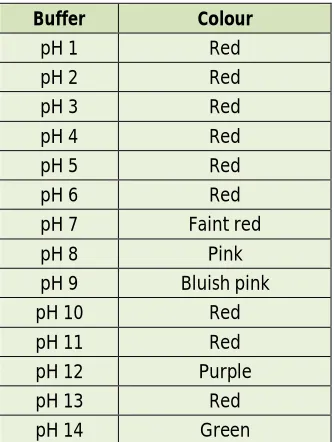
HSCA yield was 47.2 percent on air-dried basis. The yield was significant, and Table 2 indicated the pH values of the buffer solutions utilized in the investigation. While the colour effect of the HSCA stock solution in different buffer solutions were presented in Table 3. The colour effects were similar to those of authentic anthocynidines in identical media.
Table 2: Confirmation of the buffer solutions pH values
Buffer solution Colour on universal pH paper 1st pH reading 2nd pH reading Inference
pH 1 Light orange 1.05 1.02 Indicated pH 1
pH 2 Dark orange 1.36 2.01 Indicated pH 2
pH 3 Very dark orange 2.92 3.01 pH 3 confirmed
pH 4 Green 4.03 4.03 pH 4 confirmed
pH 5 Faint green 4.65 5.03 Indicated pH 5
pH 6 Light green 6.80
pH 7 Dark green 6.90 6.90 pH 7 confirmed
pH 8 Very dark green 8.17 8.17 Indicated pH 8
pH 9 Light blue 9.03 9.01 pH 9 confirmed
pH 10 Faint purple 10.06 10.00 pH 10 confirmed
pH 11 Light purple
pH 12 Dark purple 12.00 12.00 pH 12 confirmed
pH 13 Dark purple 13.00 12.98
pH 14 Very dark purple
Table 3: Colour effect of HSCA in different pH buffer solutions
TEST OBSERVED COLOUR INFERENCE
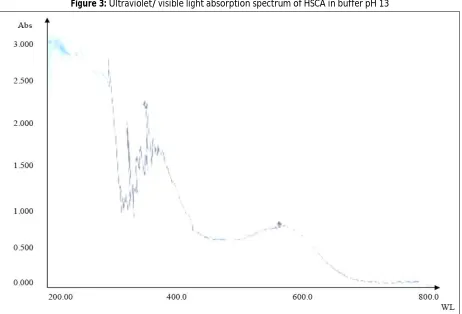
Figs. 1, 2, and 3 were the uv/visible absorption spectra of HSCA stock solution. Fig. 1 is its native absorption band and revealed the characteristic anthocynanidines absorption at 541.0 nm. Intense bands at 365 – 390 nm regions were indicative of the presence of flavonoids in the crude extract.
The anthocyanidin and flavonoid bands suffered hypsochromic or blue shift in acidic medium (pH 2), as seen in Fig. 2. In this regard, the anthocynidin peak was displaced 10 nm to the left (up filed settling at 531. 0 nm). In pH 13 buffer solution the bathochromic or red shift effect of alkaline medium on the absorption spectrum of HSCA, was confirmed in Fig. 3, as the anthocynidin maximum centred at 587.0 nm (down field).
Stability of the HSCA solution in acidic to moderately acidic to neutral media, determined by change in absorbance at 541.0 nm with respect to time, was indicated in Table 4.
Table 4: Stability of HSCA solution in acidic to moderately
acidic to neutral media
Buffer Initial absorbance at 541 nm
Final absorbance at 541 nm
pH 1 2.161 2.158
pH 2 2.582 2.163
pH 3 1.994 0.681
pH 4 0.510 0.266
pH 5 0.437 0.332
pH 6 0.920 0.266
pH 7 0.863 0.253
It could be seen that the “test solution” is most stable in very acidic (pH 1) medium. Table 5, shows the colour
effects of difference pH buffer solutions on the HSCA treated paper.
Table 5: Colour effect of HSCA stock solution treated
papers in different pH buffer solutions
Buffer Colour
pH 1 Red
pH 2 Red
pH 3 Red
pH 4 Red
pH 5 Red
pH 6 Red
pH 7 Faint red
pH 8 Pink
pH 9 Bluish pink
pH 10 Red
pH 11 Red
pH 12 Purple
pH 13 Red
pH 14 Green
While the various titre values obtained in the end-point indication experiments using standard end-point indicators were presented as Table 6.
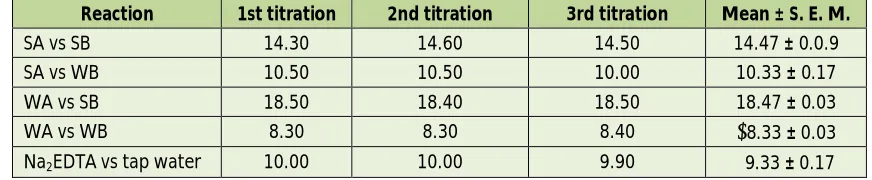
Table 7 indicated the corresponding titre value obtained with HSCA as end-point indicator in acid-base and complexometric titrations. Some of the HSCA end-points compared favourably to those of the standard end-point indicators.
Figure 2: Ultraviolet/ visible light absorption spectrum of HSCA in buffer pH 2
Figure 3: Ultraviolet/ visible light absorption spectrum of HSCA in buffer pH 13
Table 6: Titre values of various acid-base and complexomatric titrations involving standard end-point indicators Reaction 1st titration 2nd titration 3rd titration Mean ± S. E. M.
SA vs SB 16.25 16.20 16.00 16.15 ± 0.08
SA vs WB 12.20 12.30 12.30 12.27 ± 0.03
WA vs SB 19.25 19.20 19.24 19.23 ± 0.02
WA vs WB 8.50 8.60 8.60 8.57 ± 0.03
Na2EDTA vs tap water 9.50 9.50 9.00 9.33 ± 0.17
Table 7: Titre values of various acid-base and complexomatric titrations involving HSCA stock solution as end-point
indicator
Reaction 1st titration 2nd titration 3rd titration Mean ± S. E. M.
SA vs SB 14.30 14.60 14.50 14.47 ± 0.0.9
SA vs WB 10.50 10.50 10.00 10.33 ± 0.17
WA vs SB 18.50 18.40 18.50 18.47 ± 0.03
WA vs WB 8.30 8.30 8.40 8.33 ± 0.03
Na2EDTA vs tap water 10.00 10.00 9.90 9.33 ± 0.17
Significant at p < 0.01;Significant at p < 0.05.
DISCUSSION
The solution of H. Sabdariffa extract in methanol had a slightly acidic pH and is red in colour. A mixture of an aqueous solution of the extract and saturated lead II acetate gave an intense blue colouration; while in concentrated sodium hydroxide solution, the extract became green. These colour changes agree with the prescribed colours of anthocynadins in the itemized reagents. Thus, indicating the presence of anthocynidis in the petals of H. Sabdariffa. The ultraviolet-visible light absorption spectrum of the methanol extract of H. sabdariffa (HSCA) petals with prominent peaks in the 500 – 550 nm wavelength region also confirmed the presence of anthocyanidins. The typical spectrum expressed hypsochromic to bathochromic shift as the medium’s pH changes from acidic to basic. These spectral changes were in perfect agreement with the documented spectral behaviour of anthocyanidins in solutions of varying pH. This, once more, confirms the presence of anthocynidins in H. sabdariffa petals.
Reliable end-points were obtained in titrations, employing the methanol extract of H. sabdariffa petal as end-point indicator. End-points ranged between 0.24 – 1.17 ml of those obtained with standard indicators (methyl red, phenolphthalein and eriochrome black T.). Moreover, no significant difference at p < 0.05 probability factor between the titre values obtained when HSCA and Eriochrone black T were used, separately, in complexomettric titrations. For the titration of weak acid against weak base, the observed difference in the titre values were insignificant at p < 0.01.
Thus, a solution of HSCA can be employed as the end-point indicator in complexometric and weak acid-weak base titrations. Because, in such titrations the end results were identical to those reproduced with standard end-point indicators, eriochrome black T and phenolphthalein, respectively.
CONCLUSION
H. sabdariffa petal contains large amount of anthocynidins, which are freely soluble in methanol that can be used as end-point indicator in certain acid-base and complexometric titrations. The presence of anthocynidins in the petal was confirmed by ultraviolet/visible absorption, spectra of the methanol extract in difference pH medium.
Also, the colour associated with the extract in acidic, basic and in metallic ions solutions were typical of anthocynidins. It is therefore, summed that the end-point indicator power of the extract, lies in the ability of its inherent anthocyanidins to express varying colour as the hydrogen and metallic ions titration systems change.
REFERENCES
1. Perry LM. Medicinal plants of East and Southeast Asia. MIT Press, Cambridge, 1980. p. 312 – 322. 2. Manita-Mishra Chemistry and Pharmacology of
some Hibiscus sp. A Rev J Med & Aroma Plant Scis;
21, 1999: 4, 1169 – 1186.
3. Harborne JB. Phytochemical methods 3rd ed. Thompson Science, London, 1998. pp. 107 – 150. 4. Finar IL. Organic chemistry 5th ed, Vol. 2:
stereochemistry and chemistry of natural products. Addison Wesley Longman Limited, Edinburgh Gate, Harlow, Essex CM20 2JE, England, 1975. pp. 769 - 770.
5. Stren ES, Tinmons CJ. Gillman and Stern’s introduction to electronic absorption spectroscopy in organic chemistry 3rd ed. Edward Arnold (Publishers) Ltd., London, 1970. pp. 180 - 182.