University of South Carolina
Scholar Commons
Theses and Dissertations
6-30-2016
Examining Infant Health Outcomes Impacted By
South Carolina's Regionalized System of Perinatal
Care
Michael Grady Smith University of South Carolina
Follow this and additional works at:https://scholarcommons.sc.edu/etd
Part of thePublic Health Commons
This Open Access Dissertation is brought to you by Scholar Commons. It has been accepted for inclusion in Theses and Dissertations by an authorized administrator of Scholar Commons. For more information, please [email protected].
Recommended Citation
E
XAMININGI
NFANTH
EALTHO
UTCOMESI
MPACTED BYS
OUTHC
AROLINA’
SR
EGIONALIZEDS
YSTEM OFP
ERINATALC
AREby
Michael Grady Smith
Bachelor of Science Presbyterian College, 2005
Master of Science in Public Health University of South Carolina, 2008
Submitted in Partial Fulfillment of the Requirements
For the Degree of Doctor of Public Health in
Biostatistics
Norman J. Arnold School of Public Health
University of South Carolina
2016
Accepted by:
James W. Hardin, Major Professor
Marco Geraci, Committee Member
Nancy L. Fleischer, Committee Member
Nathan L. Hale, Committee Member
ii
iii
DEDICATION
This work is dedicated to my wife, Arika. I could never completely express how
grateful I am to you for your support, encouragement, affection, and demands that I get
iv
ACKNOWLEDGEMENTS
I sincerely appreciate all of the work that my major professor, Dr. James Hardin,
has put not only into this work, but also into my development as a researcher and
professional. Dr. Hardin, I appreciate your support, continual honest feedback, and lent
expertise. Most of all, I thank you for your time, mentorship, and investment in this
work. I am also grateful to the remaining members of my committee, Drs. Marco Geraci,
Nancy Fleischer, and Nathan Hale. Thank you for your careful reviews of my drafts and
for your timely and insightful feedback. You are all tremendous examples of the
professionalism and expertise in public health research that I aspire to reach.
I could not have completed this endeavor without the steadfast support of my
family. To my wife, Arika, who has been by my side since we were in high school, I
could never repay you for all that you’ve given me. Your support in everything I have
ever wanted to accomplish has strengthened and energized me. Thank you for your
patience, your sacrifices, your hard work, and your macaroni and cheese. To my
daughter, Catherine, who has given me applied experience in maternal and child health,
thank you for loving me so much. Your smiles, hugs, and kisses have filled me with joy
and purpose. To my parents, Garry and Brenda Smith, who have worked hard to give me
every advantage they could afford and many that they could not, thank you for believing
in me. I am so proud to be your son. You all have made me happier than any person
v
ABSTRACT
Perinatal regionalization systems have been shown to reduce the risk of neonatal
mortality when very low birth weight infants are delivered in Level III hospitals with
neonatal intensive care units, sub-specialist staffing, and adequate experience caring for
high-risk pregnancies and neonates. However, studies to date examining the association
between delivery in Level III hospitals and neonatal mortality have not accounted for
censoring due to fetal deaths. Furthermore, studies of perinatal regionalization to date
have not adequately assessed the association between delivery hospital level of care and
the infant’s hospital length of stay. This dissertation examined 8,594 very low birth
weight live births and fetal deaths occurring in South Carolina hospitals from 2004-2013
to assess the association between birth in a non-Level III hospital and neonatal mortality
accounting for censoring due to fetal death through the use of marginal structural models.
Subsequently, a simulation study was conducted to identify the most appropriate
statistical regression models to analyze highly skewed outcomes such as hospital length
of stay. Finally, Laplace regression was used to assess the association between delivery
hospital level of care and hospital length of stay among 6,301 live born very low birth
weight infants delivered in South Carolina hospitals from 2004-2013. These analyses
found that very low birth weight infants delivered in a non-Level III hospital had a
statistically significantly greater risk of neonatal death than similar infants delivered in a
Level III hospital (aRR=1.81, 95% CI: 1.52, 2.15). Furthermore, Laplace regression was
vi
the underlying distribution giving rise to the outcome is not confidently known. Finally,
hospital length of stay was found to be statistically significantly shorter for very low birth
weight infants delivered at Level I or Level II hospitals than similar infants born in Level
III hospitals for relatively short lengths of stay (5th and 10th conditional centiles);
significantly shorter for very low birth weight infants delivered at Level II hospitals than
similar infants born in Level III hospitals for relatively central lengths of stay (25th, 50th,
and 75th conditional quantiles); but no statistically significantly different hospital lengths
of stay were observed across levels of care for relatively long lengths of stay (90th and
95th conditional centiles). The potential cost savings due to shorter hospital stays among
relatively short and central hospital lengths of stay do not outweigh the increased risk of
neonatal mortality when very low birth weight infants are delivered in non-Level III
hospitals. Therefore, it is recommended that South Carolina maintain the perinatal
regionalization system and seek to ensure that every possible high-risk pregnancy has the
vii
TABLE OF CONTENTS
DEDICATION ... iii
ACKNOWLEDGEMENTS ... iv
ABSTRACT ...v
LIST OF TABLES ... viii
LIST OF FIGURES ...x
LIST OF ABBREVIATIONS ... xi
CHAPTER 1:INTRODUCTION ...1
CHAPTER 2:LITERATURE REVIEW ...9
CHAPTER 3:METHODS ...13
CHAPTER 4:ASSESSING THE ROLE OF CENSORING DUE TO FETAL DEATHS ON THE ASSOCIATION BETWEEN DELIVERY HOSPITAL LEVEL AND NEONATAL MORTALITY IN A REGIONALIZED SYSTEM OF PERINATAL CARE ...21
CHAPTER 5:TESTING STATISTICAL MODELS FOR ANALYZING SIMULATED HIGHLY SKEWED OUTCOMES ...47
CHAPTER 6:DELIVERY HOSPITAL LEVEL OF CARE AND LENGTH OF STAY AMONG VERY LOW BIRTH WEIGHT INFANTS IN SOUTH CAROLINA ...66
CHAPTER 7:CONCLUSIONS ...88
viii
LIST OF TABLES
Table 4.1 Bivariate associations between delivery characteristics and neonatal mortality among live births (n=6,726) occurring
in SC hospitals, 2004-2013 ...37
Table 4.2 Bivariate associations between delivery characteristics
and fetal deaths (n=8,594) occurring in SC hospitals, 2004-2013 ...38
Table 4.3 Relative risk of neonatal death for delivery in a non-Level III hospital, compared to deliveries in a Level III hospital, from marginal structural models with and without consideration
of censoring due to fetal deaths ...39
Table 4.4 Relative risk of neonatal and perinatal death for delivery in a non-Level III hospital, compared to delivery in a
Level III hospital, from log-binomial regression ...40
Table 4.5 Relative risk of neonatal death for delivery in a non-Level III hospital, compared to deliveries in a Level III hospital, from marginal-structural models with and without consideration of censoring due to fetal deaths. Sensitivity analysis including
continuous gestational age variable ...41
Table 4.6 Relative risk of neonatal death for delivery in a non-Level III Hospital, compared to deliveries in a Level III hospital, from marginal-structural models with and without consideration of censoring due to fetal deaths. Sensitivity analysis including a three-category gestational age variable (10-31 weeks, 32-36
weeks, 37+ weeks) ...42
Table 4.7 Relative risk of neonatal death for delivery in a non-Level III hospital, compared to deliveries in a Level III hospital, from marginal-structural models with and without consideration of censoring due to fetal deaths. Sensitivity analysis including
a two-category gestational age variable (10-31 weeks, 32+ weeks) ...43
ix
live births <500 grams, with neonatal deaths among live-born
infants weighing <500 grams censored...44
Table 5.1 Summary of analysis results with approximately 8% of the
observations censored. 1,000 replications with β0=1 and β1=-1 ...58
Table 5.2 Summary of analysis results with approximately 20% of the
observations censored. 1,000 replications with β0=1 and β1=-1 ...60
Table 5.3 Summary of analysis results with approximately 50% of the
observations censored. 1,000 replications with β0=1 and β1=-1 ...62
Table 5.4 Estimated impact of neonatal intensive care unit admission on hospital length of stay among very low birth weight infants
in SC, 2004-2013 ...64
Table 6.1 Descriptive summary of length of hospital stay by censoring
variables among live births occurring in SC hospitals, 2004-2013 ...82
Table 6.2 Descriptive summary of length of hospital stay by delivery characteristics among live births occurring in SC hospital,
2004-2013. Censored observations excluded ...83
Table 6.3 Adjusted difference in length of hospital stay by hospital level of care at the 5th, 10th, 25th, 50th, 75th, 90th, and 95th quantiles. Results from Laplace regression among live
x
LIST OF FIGURES
Figure 1.1 Map of SC’s perinatal regions and Regional Periantal
Centers ...8
Figure 3.1 Directed acyclic graph (DAG) for the relationship between level of perinatal care for the hospital of
delivery and neonatal mortality ...18
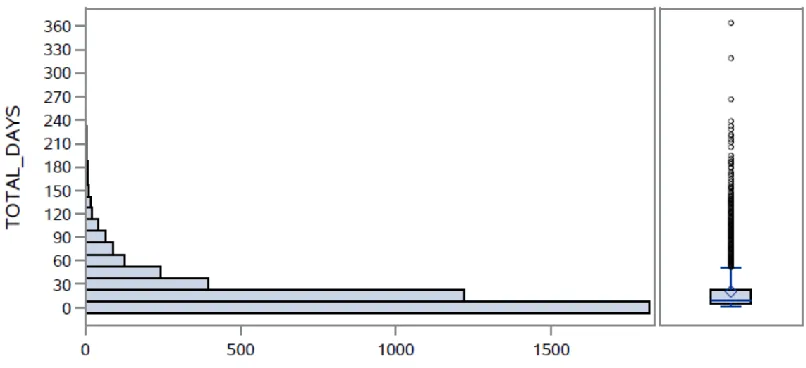
Figure 3.2 Distribution of total days until neonatal intensive care unit discharge among 2013 SC neonatal infant care unit
admissions ...19
Figure 3.3 Directed acyclic graph (DAG) for the relationship between level of perinatal care for the hospital of
delivery and length of hospital stay ...20
Figure 4.1 Directed acyclic graph (DAG) for the relationship between level of perinatal care for the hospital of delivery and neonatal mortality (outcome of interest)
and fetal mortality (censoring event) ...45
Figure 4.2 Sample size and exclusions for final set of deliveries
included in analyses ...46
Figure 5.1 Distribution of hospital length of stay among 7,252 singleton infants with a birth weight from 500-1,499 grams who did not have a birth defect reported on the birth
certificate in SC, 2004-2013 ...65
Figure 6.1 Sample size and exclusions for final set of deliveries
included in analyses ...86
Figure 6.2 Directed acyclic graph (DAG) for the relationship between level of perinatal care for the hospital of
xi
LIST OF ABBREVIATIONS
AFT ... Accelerated Failure Time
ARR ... Adjusted Relative Risk
BMI ... Body Mass Index
CI... Confidence Interval
CON ... Certificate of Need
DAG ... Directed Acyclic Graph
DHEC ... Department of Health and Environmental Control
HLS ... Hospital Length of Stay
NICU ... Neonatal Intensive Care Unit
OLS ... Ordinary Least Squares
QR ... Quantile Regression
RPC ... Regional Perinatal Center
RR ... Relative Risk
SC ... South Carolina
US ... United States
1
CHAPTER 1
INTRODUCTION
The purpose of this chapter is to provide background information about infant mortality
and perinatal regionalization in South Carolina. Additionally, this chapter will establish
the format and structure of this dissertation.
Infant Mortality
Infant mortality is a major public health outcome used in South Carolina (SC), the
United States (US), and across the world as an indicator of overall population health1 and,
in particular, the health of the women of reproductive age2,3. In the US, infant mortality
has decreased from 9.81 deaths per 1,000 live births in 1989 to 5.98 deaths per 1,000 live
births in 20124. However, despite these decreases in infant mortality, the US continues to
have substantially higher infant mortality rates than many other developed nations,
particularly due to a higher prevalence of preterm births5. Among US states, those in the
Southeast have substantially higher infant mortality rates, with 1.18 excess infant deaths
for every 1,000 live births than other US regions6.
South Carolina’s infant mortality rate has decreased substantially over the past
decade, from 9.3 deaths per 1,000 live births in 2004 to 6.9 deaths per 1,000 live births in
20137. Disorders related to low birth weight or short gestation are consistently the first or
second leading cause of infant death annually in SC. Compared to normal birth weight
2
substantially more likely to die in the first year of life, with most of these deaths
occurring during the neonatal period (first 27 days of life). Very low birth weight
deliveries made up 1.8% of all live births in SC in 2013, but comprised 54.5% of all
infant deaths in 2013. Among these deaths to VLBW infants, 86.3% occurred during the
neonatal period. Therefore, any system or intervention that effectively prevents VLBW
births or reduces the risk of neonatal death among VLBW births has the potential to
substantially impact the overall infant mortality rate.
Components of Perinatal Regionalization
Perinatal regionalization is a system of care that seeks to ensure that women with
high-risk pregnancies receive care and deliver at facilities with the technology,
sub-specialty staff, and experience to provide care for those high-risk pregnancies and
resulting infants. This is often referred to as a system of risk-appropriate care. Perinatal
regionalization systems are often statewide and classify hospitals into different levels of
care based on factors such as specialist and sub-specialist staffing (e.g. maternal-fetal
medicine specialists, neonatologists), technological capability to provide infant care (e.g.
special care nurseries, neonatal intensive care units [NICUs]), and capability to perform
complex cardiac surgeries on newborns. Each state (or other geographic area) is divided
into regions with at least one delivering hospital with a NICU and sub-specialist staff in
each region. These hospitals are referred to as Regional Perinatal Centers (RPCs) and
provide the following services within their region:
1. Act as the designated consultation and referral center for all high-risk
3
2. Provide transportation for high-risk patients to get from community hospitals or
midsize hospitals to the RPC,
3. Provide clinician education programs through outreach educators, and
4. Monitor the operation and effectiveness of the system within their region.
All of these services are supported and facilitated by a series of contracts between
hospitals in each region and the RPCs and between the RPCs and a funding agency,
usually a state health department. Perinatal regionalization systems have been shown to
reduce the risk of neonatal mortality among VLBW infants8–13. However, not all US
states have perinatal regionalization systems and there are many differences in the way
these systems operate among states that do have systems14.
Perinatal Regionalization in South Carolina
In SC, hospitals licensed to care for pregnant women and deliver infants are
currently divided into the following levels: Level I, Level II, Level II Enhanced
(commonly referred to as Level IIE), Level III, and RPCs. Level I hospitals are small
community hospitals that provide care for uncomplicated pregnancies expected to result
in normal birth weight births (≥2,500 grams). Level II hospitals are larger hospitals with
special care nurseries which provide appropriate care for some complex pregnancies
expected to result in a normal birth weight or moderately low birth weight births (1,500 -
2,499 gram). Level IIE hospitals have special care nurseries with some additional
capabilities to care for infants with a birth weight down to 1,250 grams. Level III
hospitals have 24 hour coverage by both maternal-fetal medicine specialists and
4
or complex pregnancies and infants of any birth weight. Regional Perinatal Centers are
Level III hospitals that accept high-risk pregnancies referred by other hospitals in their
region, provide transportation for these women and infants, and provide educational
programs to the other hospitals in their region.
In SC, the criteria for hospitals to operate at each level of care are codified in SC
State Regulation 61-16 and approved by the SC General Assembly. Each hospital must
apply to the SC Department of Health and Environmental Control (DHEC) Bureau of
Health Facilities Licensing for licensure at a specified level before being approved to
establish a maternity program. South Carolina has four perinatal regions with at least at
least one RPC in each region. These perinatal regions and RPCs are identified in Figure
1.1.
The national conversation about perinatal regionalization began in 1976 when the
March of Dimes Committee on Perinatal Health published Toward Improving the
Outcome of Pregnancy: Recommendations for the Regional Development of Maternal
and Perinatal Health Services15. This document outlined a recommended structure for a
regionalized system of perinatal care for the first time. However, South Carolina had one
of the three highest infant mortality rates in the US at this time, and a regionalized system
of perinatal care was already being discussed among state health leaders. In 1974 the SC
Board of Health and Environment approved the South Carolina Regionalization of
Perinatal Health Care Plan to allow for the voluntary review and designation of
delivering hospitals in SC as Level I, Level II, or Level III care centers. This plan also
5
In 1984, the Governor’s Perinatal Plan of Action was released by the
administration of SC Governor Richard Riley. This document, compiled by a
multi-agency work group, required DHEC to use its Certificate of Need (CON) process to
develop standards and requirements for a hospital to have NICU beds, develop a
licensure process for Level III hospitals, and develop and implement a transportation
system to allow women with high-risk pregnancies to receive care at Level III facilities.
This laid the foundation for the establishment of a formal, regulated perinatal
regionalization system in SC. This system has changed slightly in SC in the intervening
years, with licensing standards allowing for the addition of Level IIE hospitals, as long as
there was not a Level III facility within 90 miles, in 2002.
In 2012, the American College of Obstetricians and Gynecologists and the
American Academy of Pediatrics released the Guidelines for Perinatal Care, 7th Edition,
which provided updated recommendations for the regionalization of perinatal care16.
Strong perinatal regionalization systems continued to be recommended, but a Level IV
designation was recommended for hospitals able to perform complex cardiac surgery in
addition to the staffing and NICU requirements of Level III hospitals. Additionally, the
7th edition of the Guidelines of Perinatal Care recommended that Level III hospitals
maintain a “high volume” of VLBW deliveries. Given this new recommendation and the
fact that a Level IIE designation has never been part of a national recommendation for
perinatal regionalization systems, in 2014 DHEC drafted a revision of the perinatal
section of SC State Regulation 61-16 to govern the SC perinatal regionalization system.
This draft regulation eliminates the Level IIE designation; adds a Level IV designation;
6
ventilation for more than 24 hours, or infant surgeries for hospitals to become Level III,
RPC, or Level IV facilities. These drafted regulations were approved by the SC Board of
Health and Environment, the SC House of Representatives, and the SC Senate and were
implemented as part of the SC State Hospital Regulations on June 26, 2015.
Format and Structure of Dissertation
This dissertation will be formatted using the manuscript style with three academic
papers making up chapters 4-6. Each of these academic papers will answer research
questions as follows:
o Manuscript 1 (chapter 4):
Research Question 1: Does hospital level of perinatal care impact neonatal
deaths in South Carolina?
Research Question 2: Does “censoring” due to in-hospital fetal deaths
introduce selection bias in assessments of the association between hospital
level of perinatal care and neonatal mortality17?
o Manuscript 2 (chapter 5):
Research Question 1: Should a hospital length of stay outcome be analyzed as
a count outcome (zero-inflated poisson regression, negative binomial
regression, quantile regression), a continuous outcome (linear regression,
quantile regression), or a time-to-event outcome (accelerated failure time
regression, Laplace regression)? What situations (tail length, censoring
7 o Manuscript 3 (chapter 6):
Research Question 1: Does delivery in a level III hospital impact hospital
length of stay among VLBW infants (maternal transport vs. neonatal or no
transport)?
Chapter 7 will include an overall conclusion that summarizes the results of the three
8
9
CHAPTER 2
LITERATURE REVIEW
The purpose of this chapter is to provide a summary of the existing literature on perinatal
regionalization and highlight the current research gaps.
As mentioned above, the national conversation regarding perinatal regionalization began
in earnest in 1976 with the publication of Toward Improving the Outcome of Pregnancy:
Recommendations for the Regional Development of Maternal and Perinatal Health
Services by the March of Dimes Committee on Perinatal Health. After the release of this
document demonstration projects were established to document the impact of
regionalized systems of perinatal care in applied settings18. In the years that followed,
observational studies in states establishing perinatal regionalization systems began to
consistently demonstrate positive impacts on neonatal mortality among VLBW infants8–
11, including studies specific to SC12,13.
Political environments, enabling legislation, and numbers of hospitals with
existing NICUs vary from state to state, which has led to a lack of consistency in the way
that regionalized systems of perinatal care are implemented among states that have some
form of regionalization14,19. Currently, some states have regulated perinatal
regionalization systems supported by legislation, some states have systems supported by
voluntary agreements among hospitals, and some states have no system of regionalized
10
regulated perinatal regionalization systems compared to states with no perinatal
regionalization has determined that states with CON programs are a major supporting
factor for perinatal regionalization20. CON programs require hospitals to demonstrate a
need in their service area before being approved to add or increase offerings in specified
services. Since the repeal of Federal legislation requiring CON programs in 1986, at least
20 states have abolished CON requirements for health facility construction and
expansion. This has led to “de-regionalization” of perinatal systems in some states and
allowed for NICUs to open in hospitals that have a low volume of VLBW deliveries.
Multiple studies have shown NICUs with a low volume of VLBW deliveries (<100
VLBW deliveries per year) have significantly increased risk of neonatal mortality among
VLBW infants than NICUs with a high-volume of VLBW deliveries11,17,21–28.
Additionally, the Patient Protection and Affordable Care Act has had unintended
consequences that increase the incentive to “de-regionalize,” emphasizing a need for
current, relevant studies to assess the effectiveness on perinatal regionalization systems29–
31.
The vast majority of studies on perinatal regionalization have focused on the
impact of these coordinated systems of care on neonatal mortality among VLBW infants
as a proxy for high-risk pregnancies. While neonatal mortality is an outcome of great
importance, there is also a need for studies on other important outcomes32. Outcomes
that have a clearly defined financial impact on health care payers are of particular
relevance to the ongoing policy discussion around perinatal regionalization. Recent
studies have examined outcomes such as necrotizing enterocolitis, neurological
11
deliveries occur in hospitals with NICUs compared to when deliveries occur in smaller
hospitals and were transferred to hospitals with NICUs31,33,34. Emerging issues that are
impacting the implementation, effectiveness, and assessment of perinatal regionalization
include the increasing use of telemedicine and emerging data analysis methodologies
such as instrumental variable analysis17,27,35.
Current gaps in perinatal regionalization literature include assessing the impact of
in-hospital fetal deaths on outcomes such as neonatal mortality and assessments of the
impact of birth in a Level III or higher hospital on NICU length of stay and overall
hospital length of stay. Phibbs et al. noted that in-hospital fetal deaths may result in bias
of the true impact of VLBW deliveries occurring in Level III or higher hospitals on
neonatal mortality in 200717. Instances where high-risk pregnancies that end in fetal
deaths are being cared for in Level III or higher hospitals are also products of perinatal
regionalization systems and, therefore should be included in analyses. There may be
little etiologic difference between many in-hospital fetal deaths and VLBW infants that
die in the neonatal period. However, fetal deaths have not been included in most studies
of perinatal regionalization to date because these studies are often based on data from
birth certificates, which are only filed in the event of a live birth. According to SC
hospital discharge data, there were 300 in-hospital fetal deaths in 2014. Annually there
are roughly 420 total infant deaths and 190 neonatal deaths among VLBW deliveries.
These fetal deaths should be considered lost-to-follow up, or censored outcomes. If the
primary outcome of interest is neonatal death, assessing hospital level of care without
12
should be accounted for in analyses, as there are a substantial number of these outcomes
and adjusting for them may substantially impact study results and implications.
One study to date assessed the association of hospital of birth and hospital length
of stay in the context of a regionalized system of perinatal care13. This study, published
by Sanderson et al. in 2000 evaluated length of stay as a continuous outcome using linear
regression with a log-transformed outcome to account for the lack of normality in the
length of stay variable. A variety of analysis methods are now available and used for
assessing length of stay outcomes. Therefore, the most appropriate analysis method for
assessing the impact on NICU length of stay and overall hospital length of stay for
VLBW infants delivered in Level III or higher hospital compared to those delivered in
13
CHAPTER 3
METHODS
The purpose of this chapter is to describe the methods that will be used for the analyses in
each of the three manuscripts presented in chapters four through six.
Manuscript 1
This study seeks to assess the association between hospital level of perinatal care and
neonatal mortality among VLBW infants and to quantify the impact on inference of
analyses of considering in-hospital fetal deaths as censored observations. Marginal
structural modelling will be used to assess the relative risk of neonatal mortality among
VLBW infants delivered in Level III hospitals compared to VLBW infants born in
hospitals with a lower perinatal care designation. This analysis will be conducted using a
linked data file that includes data on live births and fetal deaths occurring to SC residents
from 2008-2013. This linked file will include data on fetal deaths reported on the SC
Report of Fetal Death vital records certificate, live births from birth certificate data linked
to infant deaths from death certificate data, and hospital discharge uniform billing
(UB-04) data for all live births and fetal deaths occurring in a hospital.
Marginal structural modelling estimates counterfactual contrasts using stabilized
14
confounders by balancing those confounders across levels of the independent variable of
primary interest (delivery in a Level III hospital in this analysis for the present analysis).
Marginal structural models also account for censoring (in-hospital fetal deaths in this
analysis) by including a component in the stabilized inverse probability weight that
accounts for censoring by modeling the predictors of censored values. Therefore a
marginal structural model accounting for censoring can be estimated with the results
compared to those from a marginal structural model that does not account for censoring,
with the divisor of the relative risks indicating the impact of censoring.
The analyses presented in this manuscript will be restricted to fetal deaths and
VLBW deliveries occurring in SC hospitals. The outcome variable will be neonatal
mortality, defined as death from a live birth through the 27th day of life occurring in any
location. This outcome variable will be assessed from birth certificate and death
certificate data. The independent variable of primary interest will be the level of perinatal
care of the hospital of delivery. This variable will be coded as delivery or fetal death in a
Level III hospital compared to delivery or fetal death in a hospital with a lower
designation and will be assessed from birth certificate data. Illustrated in the directed
acyclic graph (DAG) in Figure 3.1 the following variables will be included as
confounders: maternal age (continuous; birth certificate data), maternal race
(non-Hispanic white, non-(non-Hispanic African American, (non-Hispanic and other; birth certificate
data), maternal education (less than high school, high school graduate, more than high
school; birth certificate data), initiation of prenatal care in the first trimester of pregnancy
(yes, no; birth certificate data), method of delivery payment (private insurance, Medicaid,
15
overweight, or normal/underweight; birth certificate data), gestational diabetes (yes, no;
birth certificate data), gestational hypertension or pre-eclampsia (yes, no; birth certificate
data), surfactant replacement therapy during pregnancy (yes, no; birth certificate data),
corticosteroid use during pregnancy (yes, no; birth certificate data), and assisted
ventilation for newborn (yes, no; birth certificate data). Furthermore, data will be
restricted to only singleton deliveries without indication of birth defects on the associated
birth certificate.
The DAG in Figure 3.1 indicates that fetal death is a common effect of several
variables that confound the association between hospital level of perinatal care and
neonatal mortality. This, along with the fact that fetal deaths occur before neonatal
deaths might occur (that is, fetal deaths are a competing risk for neonatal death), indicate
that fetal death is a suitable candidate for consideration as a censoring event.
Manuscript 2
A variety of statistical approaches have been used to analyze inpatient length of hospital
stay as an outcome of interest. The only study to date to analyze length of hospital stay
to assess the impact of delivery in a Level III hospital within a regionalized system of
perinatal care used linear regression with a log-transformed outcome variable to account
for the non-normal distribution of the length of stay13. Linear regression with a
log-transformed outcome approach has also been used to assess the impact of a variety of
characteristics associated with length of hospital stay36–39, however most of the studies
16
Studies have also considered length of hospital inpatient stay to be a count
outcome and have applied Poisson regression and negative binomial regression models in
these analyses40–43. A few studies have used survival analysis to examine length of
hospital stay as an outcome using both semi-parametric (Cox proportional hazards
regression)44–46 and parametric (accelerated failure time regression) models45,47,48. Some
recent studies used quantile regression models for which the length of hospital stay was
considered a continuous variable49–52 and have used other quantile regression models
extended for modeling count data53. Finally, at least one study used Laplace regression to
model hospital length of stay as a survival outcome for quantiles of interest54.
In this manuscript, data with a variety of potential length of stay distributions will
be generated with analysis conducted considering length of hospital stay as continuous
outcome (using linear regression and quantile regression), a count outcome (using
Poisson regression, negative binomial regression, and quantile regression), and a survival
outcome (using Cox proportional hazards regression, accelerated failure time regression,
and Laplace regression). The distribution of the simulated hospital length of stay
distributions will be varied by the location of the peak, length of the tail, and percentage
of censored data. Each distribution will be simulated and analyzed with each method
1,000 times with results evaluated based on the percentage of time that the true
association between the simulated length of stay outcome and the independent variable is
17 Manuscript 3
The distribution of the length of NICU stay among VLBW infants born in SC in 2013 is
presented in Figure 3.2. The analysis method that is identified as the most appropriate to
analyze the length of stay distribution observed in this population in manuscript 2 will be
applied to SC live births occurring from 2008 to 2013. Data for this analysis will include
birth certificate data linked to hospital discharge data.
Data for this analysis will be restricted to singleton live births occurring in SC
hospitals without congenital anomalies reported in birth certificate data. The outcome
variable will be length of NICU stay in days from hospital discharge data and the
independent variable of primary interest will be level of perinatal care of the delivery
hospital from birth certificate data. As illustrated in the DAG presented in Figure 3.3, the
following potential confounding variables will be included from birth certificate data:
maternal age (continuous), maternal race (non-Hispanic white, non-Hispanic African
American, Hispanic and other), maternal education (less than high school, high school
graduate, more than high school), initiation of prenatal care in the first trimester of
pregnancy (yes, no), method of delivery payment (private insurance, Medicaid, self-pay
or other), surfactant replacement therapy during pregnancy (yes, no), corticosteroid use
18
20
21
CHAPTER 4
ASSESSING THE ROLE OF CENSORING DUE TO FETAL DEATHS
ON THE ASSOCIATION BETWEEN DELIVERY HOSPITAL LEVEL
AND NEONATAL MORTALITY IN A REGIONALIZED SYSTEM OF
PERINATAL CARE
1
1Smith M.G., Fleischer N., Geraci M., Hale N., Hardin J. Submitted to American
22
The purpose of this chapter is to describe the motivation, methods, results, and
implications of an analysis examining the impact of the level of care of the hospital of
birth on neonatal mortality among very low birth weight deliveries in South Carolina.
Introduction
Perinatal regionalization is a system of care that seeks to ensure that women with
high-risk pregnancies receive care and deliver at facilities with the appropriate technology,
sub-specialty staff, and experience to provide care for those high-risk pregnancies and
resulting infants16. This system is often referred to as a system of risk-appropriate care.
Perinatal regionalization systems are often statewide and classify hospitals into different
levels of care based on factors such as specialist and sub-specialist staffing, technological
capability to provide infant care, and capability to perform complex cardiac surgeries on
newborns. These systems provide mechanisms to transfer the care of high-risk
pregnancies to appropriate hospitals equipped with the staffing, technology, and
experience to provide optimal care for the mother and fetus. Perinatal regionalization
systems have been shown to reduce the risk of neonatal mortality among very low birth
weight (VLBW; <1,500 grams) infants8–13. However, not all US states have perinatal
regionalization systems and there are many differences in the way these systems operate
among states that do have systems14.
In South Carolina (SC), hospitals licensed to care for pregnant women and deliver
infants were divided into the following levels from 2004-2013: Level I, Level II, Level II
Enhanced (commonly referred to as Level IIE), Level III, and Regional Perinatal Centers
23
uncomplicated pregnancies expected to result in normal birth weight births (≥2,500
grams). Level II hospitals are larger hospitals with special care nurseries which provide
appropriate care for some complex pregnancies expected to result in a normal birth
weight or moderately low birth weight births (1,500 - 2,499 grams). Level IIE hospitals
have special care nurseries with some additional capabilities to care for infants with a
birth weight down to 1,250 grams. Level III hospitals have 24-hour coverage by both
maternal-fetal medicine specialists and neonatologists as well as NICUs that are equipped
to provide appropriate care to normal or complex pregnancies and infants of any birth
weight. RPCs are Level III hospitals that accept high-risk pregnancies referred by other
hospitals in their region, provide transportation for these women and infants, and provide
educational programs to the other hospitals in their region. In SC, the criteria for hospitals
to operate at each level of care are codified in SC State Regulation 61-16 and approved
by the SC General Assembly55. In 2013 there were 17 Level I hospitals, 21 Level II
hospitals, one Level IIE hospital, and seven Level III hospitals. Five of the seven Level
III hospital were RPCs. These seven Level III hospitals delivered 35.8% of all live births
occurring in SC.
The majority of studies on perinatal regionalization have focused on the impact of
regionalization on neonatal mortality among VLBW infants as a proxy for high-risk
pregnancies8–13. Neonatal mortality is defined as the death of a live-born infant in the
first 27 days of life occurring in any location. However, high-risk pregnancies that are
transferred to Level III hospitals and end in fetal deaths (the death of a fetus prior to
delivery, also known as stillbirth) also represent instances of a perinatal regionalization
24
perinatal regionalization system should also take the impact of fetal deaths occurring
inside and outside Level III hospitals into consideration. There may be little etiologic
difference between many in-hospital fetal deaths and VLBW infants that die in the
neonatal period. However, fetal deaths are rarely (for exceptions, see references 11,17)
included in many studies of perinatal regionalization to date because these studies are
often based on data from birth certificates, which are only filed in the event of a live
birth.
This paper assesses the association between the level of perinatal care of the
delivery hospital and neonatal mortality among high-risk deliveries in order to evaluate
the impact of SC’s perinatal regionalization system. Furthermore, our investigation
explores whether treating fetal deaths as censored observations impacts the association
between the delivering hospital level of perinatal care and neonatal mortality among
VLBW live births.
Methods
Data
This analysis utilizes a linked data file that includes data on live births and fetal deaths
occurring among SC residents delivering in SC from 2004-2013. This linked file
includes data on fetal deaths reported on the SC Report of Fetal Death vital records
certificate, live births from the SC Certificate of Live Birth (2003 US Standard revision),
infant deaths from the SC Certificate of Death, and hospital discharge uniform billing
25
The primary outcome of interest in these analyses is neonatal mortality, which is
assessed from death certificate data. The primary independent variable of interest is the
level of perinatal care of the hospital of delivery. This variable is coded as delivery in a
Level III hospital (including RPCs as Level III hospitals) compared to delivery in a
hospital with a lower designation and is assessed from birth certificate data or report of
fetal death data, as applicable. The following variables are included as confounders, with
hypothesized associations with neonatal mortality and fetal mortality illustrated in the
directed acyclic graph (DAG) in Figure 4.1: maternal age (continuous; birth certificate
data, fetal death data), maternal race (non-Hispanic White, non-Hispanic Black, Hispanic
and other; birth certificate data, fetal death data), initiation of prenatal care in the first
trimester of pregnancy (yes, no; birth certificate data, fetal death data), method of
delivery payment (private insurance, Medicaid, self-pay or other; birth certificate data),
pre-pregnancy obesity status (obese [BMI≥30 kg/m2], overweight [25≤BMI<30 kg/m2, or
normal/underweight [BMI<25 kg/m2]; birth certificate data [height and weight for birth
and fetal death data are self-reported on the mother’s worksheet]), gestational diabetes
(yes, no; birth certificate data, fetal death data), gestational hypertension or pre-eclampsia
(yes, no; birth certificate data, fetal death data), surfactant replacement therapy during
pregnancy (yes, no; birth certificate data), corticosteroid use during pregnancy (yes, no;
birth certificate data), and assisted ventilation for newborn (yes, no; birth certificate data).
Gestational age at delivery was not included as a covariate because nearly all of
the live births and fetal deaths included in this study were delivered preterm with over
80% of all deliveries being early preterm (<32 weeks of gestation). However, sensitivity
26
variable (10-31 weeks, 32-36 weeks, ≥37 weeks), and a two-level categorical variable
(10-31 weeks, ≥32 weeks) were conducted.
The DAG in Figure 4.1 indicates that fetal death is a common effect of several
variables that confound the association between hospital level of perinatal care and
neonatal mortality. This, along with the fact that fetal deaths occur before neonatal
deaths might occur (that is, fetal deaths are a competing risk for neonatal death), indicate
that fetal death is a suitable candidate for consideration as a censoring event56.
Population
The analyses presented in this manuscript are restricted to fetal deaths and VLBW
deliveries occurring in SC hospitals between 2004 and 2013. Live births with a birth
weight less than 500 grams have been removed from all analyses so that these results are
comparable to other studies of perinatal regionalization and neonatal mortality, as these
births are generally considered to be non-viable and would likely result in neonatal death
no matter where they were delivered. Furthermore, data are restricted to singleton
deliveries without a birth defect indicated in birth certificate or fetal death data. For
multivariate analyses, only records without missing data on all covariates of interest were
included (a total of 353 records with missing pre-pregnancy height or weight). Figure 4.2
depicts the number of observations excluded due to each criteria and the composition of
the final analysis dataset (N=8,594).
A sensitivity analysis including deliveries weighing less than 500 grams was also
conducted with neonatal deaths occurring to infants born weighing less than 500 grams
27 Statistical Analysis
Each characteristic hypothesized to be associated with fetal death and/or neonatal death
was assessed by first examining the variable’s bivariate association with neonatal death
and fetal death (where appropriate). Bivariate associations were assessed for maternal
age as a continuous variable using F tests while bivariate associations with categorical
variables are assessed using χ2 tests.
Marginal structural modelling was used to assess the relative risk of neonatal
mortality among VLBW infants delivered in Level III hospitals compared to VLBW
infants born in hospitals with a lower perinatal care designation. Marginal structural
modelling estimates counterfactual contrasts using stabilized inverse probability
weighting to create a pseudo-population to account for potential confounders by
balancing those confounders across levels of the independent variable of primary interest
(delivery in a Level III hospital for the present analysis). Marginal structural models (see
Hernan and Robins (2015)57) also account for censoring (in-hospital fetal deaths in this
analysis) by including a component in the stabilized inverse probability weight that
accounts for censoring by modeling the predictors of censored values. The marginal
structural model that accounted for censoring due to fetal deaths was compared to the
marginal structural model that did not account for censoring, with the divisor of the
relative risks indicating the impact of censoring.
For the marginal structural models used in this analysis, stabilized inverse
probability weights (SWA) were developed based on the probability of being born in a
Level III hospital both with and without accounting for the covariates of interest. This
28
logistic regression model with hospital level of care as the outcome variable and all of the
covariates as independent variables. The results from equation (1) were used to derive
the denominator of the stabilized inverse probability weights. Equation (2) is the null
logistic regression model with hospital level of care as the outcome and no independent
variables. The results from equation (2) were used to derive the denominator of the
stabilized inverse probability weights. Equation (3) demonstrates how the results from
equation (1) and equation (2) were used to calculate the confounding component of the
stabilized inverse probability weights.
Equation 1:
𝑃(𝐴|𝐿) = 𝑃(𝑙𝑒𝑣𝑒𝑙3 = 1)
= 𝐿𝑜𝑔𝑖𝑡(𝛽0+ 𝛽1𝑎𝑔𝑒 + 𝛽2𝑟𝑎𝑐𝑒 + 𝛽3𝑝𝑟𝑒𝑛𝑎𝑡𝑎𝑙𝑐𝑎𝑟𝑒 + 𝛽4𝑜𝑏𝑒𝑠𝑖𝑡𝑦
+ 𝛽5𝑑𝑖𝑎𝑏𝑒𝑡𝑒𝑠 + 𝛽6ℎ𝑦𝑝𝑡𝑒𝑟𝑡𝑒𝑛𝑠𝑖𝑜𝑛 + 𝛽7𝑑𝑒𝑙𝑖𝑣𝑒𝑟𝑦𝑝𝑚𝑡 + 𝛽8𝑠𝑢𝑟𝑓𝑎𝑐𝑡𝑎𝑛𝑡
+ 𝛽9𝑠𝑡𝑒𝑟𝑜𝑖𝑑𝑠 + 𝛽10𝑣𝑒𝑛𝑡𝑖𝑙𝑖𝑎𝑡𝑖𝑜𝑛),
where A = independent variable of primary interest
L = the set of additional independent variables
Equation 2:
𝑃(𝐴) = 𝑃(𝑙𝑒𝑣𝑒𝑙3 = 1) = 𝐿𝑜𝑔𝑖𝑡(𝛽0)
Equation 3:
𝑆𝑊𝐴 = 𝑃(𝐴)
𝑃(𝐴|𝐿), 𝑤ℎ𝑒𝑟𝑒 𝑙𝑒𝑣𝑒𝑙3 = 1 𝑜𝑟
𝑆𝑊𝐴 = 1 − 𝑃(𝐴)
29
To account for censoring due to fetal deaths, a similar stabilized
inverse-probability weight balanced confounders across the censoring variable (fetal death).
Equations (4), (5), and (6) demonstrate the calculation used for the censoring stabilized
inverse-probability weight. Equation (4) is a logistic regression model where fetal death
(the censoring variable) is the outcome variable and the available covariates are included
as independent variables. Equation (5) is the null logistic regression model where fetal
death is the outcome variable and no independent variables are included. Similar to
equation (3) above, equation (6) demonstrates how the results from equations (4) and (5)
were used to calculate the censoring component of the stabilized inverse probability
weights.
Equation 4:
𝑃(𝐶|𝐿) = 𝑃(𝑓𝑒𝑡𝑎𝑙𝑑𝑒𝑎𝑡ℎ = 1) = 𝐿𝑜𝑔𝑖𝑡(𝛽0+ 𝛽1𝑎𝑔𝑒 + 𝛽2𝑟𝑎𝑐𝑒 + 𝛽3𝑝𝑟𝑒𝑛𝑎𝑡𝑎𝑙𝑐𝑎𝑟𝑒 +
𝛽4𝑏𝑚𝑖 + 𝛽5𝑑𝑖𝑎𝑏𝑒𝑡𝑒𝑠 + 𝛽6ℎ𝑦𝑝𝑡𝑒𝑟𝑡𝑒𝑛𝑠𝑖𝑜𝑛 + 𝛽7𝑙𝑒𝑣𝑒𝑙3),
where C = censoring variable
Equation 5:
𝑃(𝐶) = 𝑃(𝑓𝑒𝑡𝑎𝑙𝑑𝑒𝑎𝑡ℎ = 1) = 𝐿𝑜𝑔𝑖𝑡(𝛽0+ 𝛽1𝑙𝑒𝑣𝑒𝑙3)
Equation 6:
𝑆𝑊𝐶 = 𝑃(𝐶)
𝑃(𝐶|𝐿), 𝑤ℎ𝑒𝑟𝑒 𝑓𝑒𝑡𝑎𝑙𝑑𝑒𝑎𝑡ℎ = 1 𝑜𝑟
𝑆𝑊𝐶 = 1 − 𝑃(𝐶)
30
Lastly, the final stabilized inverse probability weight was constructed using
equation (7) by multiplying the confounding component weights and censoring
component weight and then plugged into a log-binomial regression model to predict
neonatal deaths from hospital level of perinatal care. All stabilized inverse probability
weights (including SWA, SWC, and SW) should have a mean at or near one as an
indication of appropriate model fit and specification. This criterion was checked for all
stabilized inverse probability weights used in the analysis.
Equation 7:
𝑆𝑊 = 𝑆𝑊𝐴∗ 𝑆𝑊𝐶
A sensitivity analysis was conducted to examine the impact of SWA and SWC
being constructed using the same predictors, which were restricted to variables available
from both birth certificates and fetal death reports. These results were compared to those
obtained from the primary analysis to investigate any meaningful differences in
interpretation. Results from the marginal structural models were also compared to
standard log-binomial regression results using neonatal mortality as the outcome
(excluding fetal deaths) and also using perinatal mortality as the outcome (including
in-hospital fetal deaths and neonatal deaths).
All data management and analyses were conducted in SAS 9.3 (Cary, NC). The
31 Results
Bivariate Results
Table 4.1 displays the bivariate associations between characteristics of interest and
neonatal mortality. Among VLBW deliveries in Level I or Level II hospitals, 15%
resulted in neonatal deaths, almost twice the percentage of neonatal death among VLBW
deliveries in Level III hospitals (p<0.0001). Furthermore, maternal age, gestational
diabetes, gestational hypertension, use of antenatal steroids, surfactant replacement
therapy for infants, and assisted ventilation for infants were also associated with
increased neonatal mortality. Many of these characteristics are related to very high risk
pregnancies and deliveries.
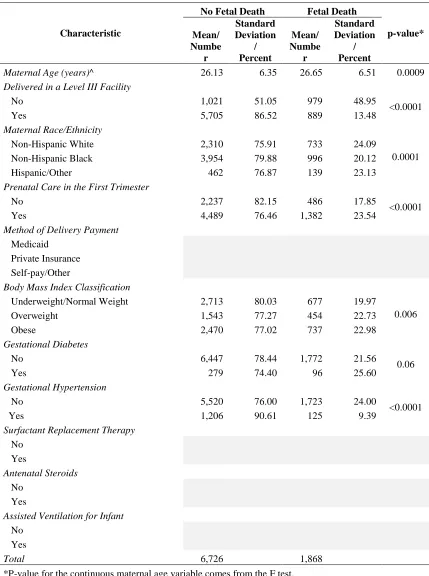
Table 4.2 displays the bivariate associations between characteristics of interest
and fetal mortality. Several variables available on the birth certificate are not available
on the report of fetal death certificate. These variables include method of delivery
payment, surfactant replacement therapy for infants, assisted ventilation for infants, and
antenatal steroids. Delivery in a Level III hospital, maternal age, maternal race/ethnicity,
receipt of prenatal care in the first trimester, pre-pregnancy obesity status, gestational
diabetes, and gestational hypertension were significantly associated with fetal mortality.
Multivariate Results
The results of the marginal structural models are displayed in Table 4.3. Model 1 utilizes
all of the available covariates to calculate the stabilized inverse probability weights.
32
born in non-Level III hospitals had 1.62 (95% confidence interval [CI]: 1.36 – 1.93)
times the risk of neonatal death compared to VLBW infants born in Level III hospitals.
When using model 1 to account for censoring due to fetal deaths, VLBW infants
born in non-Level III hospitals were again at increased risk of neonatal death.
Specifically, VLBW infants born in non-Level III hospitals had 1.81 (95% CI: 1.52 –
2.15) times the risk of neonatal death compared to VLBW infants born in Level III
hospitals. This indicates that accounting for censoring due to fetal deaths increases the
relative risk of neonatal deaths among VLBW infant born in non-Level III hospitals by
11.7%.
A sensitivity analysis in which only variables available on both the birth
certificate and the report of fetal death certificate were included in the calculation of the
stabilized inverse probability weights to ensure that the same covariates were used to
create the weight for the independent variable of primary interest (birth in a Level III
hospital) and the censoring variable (fetal death). This was done because many of the
variables that were excluded due to a lack of availability for fetal deaths were also
significantly associated with neonatal mortality in the bivariate analyses. Therefore, not
accounting for these variables may substantially influence the association between
hospital level of care and neonatal mortality. However, as shown in Table 4.3, the
direction and significance of the relative risks was found to be the same for model 2 as
for model 1 with the results from model 2 indicating slightly greater risk of neonatal
mortality for VLBW deliveries in non-Level III hospitals. This suggests that including
33
calculate the weight for delivery hospital level of care does impact the results, but makes
them slightly more conservative.
Table 4.4 presents the results from log-binomial regression models to estimate the
adjusted relative risk of neonatal mortality and perinatal mortality (combining in-hospital
fetal deaths and neonatal deaths into a single outcome). Based on the log-binomial
model, the risk of neonatal death among VLBW infants born in a non-Level III hospital is
1.71 (95% CI: 1.44, 2.04) times the risk of neonatal death among VLBW infants born in a
Level III hospital. This estimated relative risk is similar, though slightly larger than the
model 1 estimate for neonatal mortality using marginal structural modelling without
accounting for censoring due to fetal deaths. However, based on the log-binomial model,
the risk of perinatal death among VLBW deliveries in a non-Level III hospital is 2.63
(95% CI: 2.47, 2.79) times the risk of perinatal death among VLBW deliveries in Level
III hospitals. This estimated relative risk is substantially larger than the estimated risk of
neonatal death from the marginal structural model accounting for censoring due to fetal
deaths.
Sensitivity analyses including gestational age as a covariate produced relative risk
estimates slightly greater in magnitude, but did not impact our interpretations or
conclusions. Results of these sensitivity analyses are available in Table 4.5 (continuous
gestational age variable included), Table 4.6 (three-level categorical gestational age
variable included), and Table 4.7 (two-level categorical gestational age variable
included). Additionally, a sensitivity analysis including all deliveries weighing less than
500 grams resulted in similar relative risk estimates that also did not impact our
34 Discussion
This study estimates that VLBW deliveries occurring in non-Level III hospitals in SC
have 81% greater risk of neonatal death when compared to VLBW deliveries occurring in
Level III hospitals when accounting for pregnancies that ended in fetal death. This
indicates that the SC system of perinatal regionalization is working effectively and that
every effort should be made to assure that high-risk pregnancies are receiving care at
Level III hospitals at delivery. Failing to account for pregnancies that did not reach live
birth (i.e., fetal deaths as censoring events) may result in an underestimate of the true risk
of neonatal death.
The relative risk estimates for the association between delivery in a non-Level III
hospital and neonatal death using marginal structural models but without accounting for
censoring due to fetal mortality are in the same direction as those observed in other
studies using neonatal death as an outcome8,9,11. Although the magnitude of the
association varies across studies10, the estimated relative risk of neonatal death found in
our study without accounting for censoring due to fetal mortality is similar to that
observed in other studies conducted in SC12,13. However, the nearly 12% increase in the
magnitude of the relative risk when accounting for censoring due to fetal deaths indicates
that not accounting for fetal deaths as censored events when the event of interest is the
neonatal death of live born infants produces an underestimate of the true impact of the
effectiveness of perinatal regionalization. Furthermore, the large difference in the
magnitude of the relative risk estimates between considering fetal deaths as part of the
perinatal death outcome variable (RR=2.63 from the log-binomial regression models) and
35
(RR=1.81 from the marginal structural models) may indicate that neonatal death and
in-hospital fetal death have different magnitudes of risk given the level of prenatal care of
the delivering hospital.
It could be that VLBW infants delivered in non-Level III hospitals are
systematically different from those delivered in Level III hospitals with respect to risk
status. For example, the highest-risk pregnancies resulting in VLBW deliveries may be
more likely to be transferred to a Level III hospital prior to delivery, making Level III
deliveries systematically more high-risk. Alternatively, VLBW deliveries at non-Level
III hospitals may be more likely to be the result of emergency situations that prevent the
safe transport to a Level III hospital for delivery, making non-Level III deliveries
systematically more high-risk. Some studies have used instrumental variable analysis to
account for this unmeasured difference in risk status11,27. This paper accounts for
potential differences in the risk status of deliveries at hospitals with different levels of
perinatal care by restricting analyses to deliveries without reported congenital anomalies
and by adjusting for treatments associated with high-risk pregnancies, including assisted
ventilation for the infant, surfactant replacement therapy for the infant, and antenatal
steroid use.
This study is subject to several limitations. First, as with any observational study,
there may be uncontrolled confounding that could change the nature of the observed
association if appropriately considered. Only variables included on birth certificates,
fetal death reports, death certificates, and hospital discharge data were available. Since
neonatal death is a relatively rare outcome, we are limited by the number of variables that
36
zero observations in the dataset. An additional limitation is that most of the variables
used in this study are based on vital records data, primarily from birth certificates and
reports of fetal death. Data from birth certificates in SC have been shown to have low
sensitivity for some variables when compared to medical records; however, most of the
variables used in this study have been shown to have substantial or high sensitivity58.
This study assumes that the quality of data on report of fetal death certificates is similar
to that of corresponding variables from birth certificates.
South Carolina is a state with a regulated perinatal regionalization system that
defines the requirements for designation at the different perinatal levels of care and
licenses hospitals to function within the parameters of their perinatal level of care
designation. This makes the policy and practice environment with respect to the delivery
of VLBW infants within SC different than many other states14,19. Examining the
difference in perinatal outcomes among high-risk deliveries among different levels of
perinatal care in a state with a strong perinatal regionalization system is essential to
helping to inform whether perinatal regionalization systems are effectively preventing
37
Table 4.1: Bivariate associations between delivery characteristics and neonatal mortality among live births (n=6,726) occurring in SC hospitals, 2004-2013.
Characteristic
No Neonatal Death Neonatal Death
p-value* Mean/ Numbe r Standard Deviation / Percent Mean/ Numbe r Standard Deviation / Percent
Maternal Age (years)^ 26.20 6.33 25.51 6.52 0.01
Delivered in a Level III Facility
No 868 85.00 153 15.00 <0.000
1
Yes 5,258 92.16 447 7.84
Maternal Race/Ethnicity
Non-Hispanic White 2,087 90.35 223 9.65
0.30
Non-Hispanic Black 3,615 91.43 339 8.57
Hispanic/Other 424 91.77 38 8.23
Prenatal Care in the First Trimester
No 2,048 91.55 189 8.45
0.34
Yes 4,078 90.84 411 9.16
Method of Delivery Payment
Medicaid 3,741 91.36 354 8.64
0.50
Private Insurance 1,599 90.90 160 9.10
Self-pay/Other 786 91.14 86 9.86
Body Mass Index Classification
Underweight/Normal Weight 2,469 91.01 244 8.99
0.96
Overweight 1,404 90.99 139 9.01
Obese 2,253 91.21 217 9.79
Gestational Diabetes
No 5,856 90.83 591 9.17
0.0007
Yes 270 96.77 9 3.23
Gestational Hypertension
No 4,952 89.71 568 10.29 <0.000
1
Yes 1,174 97.35 32 2.65
Surfactant Replacement Therapy
No 4,699 90.52 492 9.48
0.003
Yes 1,427 92.96 108 7.04
Antenatal Steroids
No 5,081 90.46 536 9.54 <0.000
1
Yes 1,045 94.23 64 5.77
Assisted Ventilation for Infant
No 3,520 90.44 372 9.56
0.03
Yes 2,606 91.95 228 8.05
Total 6,126 600
38
Table 4.2: Bivariate associations between delivery characteristics and fetal deaths (n=8,594) occurring in SC hospitals, 2004-2013.
Characteristic
No Fetal Death Fetal Death
p-value* Mean/ Numbe r Standard Deviation / Percent Mean/ Numbe r Standard Deviation / Percent
Maternal Age (years)^ 26.13 6.35 26.65 6.51 0.0009
Delivered in a Level III Facility
No 1,021 51.05 979 48.95
<0.0001
Yes 5,705 86.52 889 13.48
Maternal Race/Ethnicity
Non-Hispanic White 2,310 75.91 733 24.09
0.0001
Non-Hispanic Black 3,954 79.88 996 20.12
Hispanic/Other 462 76.87 139 23.13
Prenatal Care in the First Trimester
No 2,237 82.15 486 17.85
<0.0001
Yes 4,489 76.46 1,382 23.54
Method of Delivery Payment
Medicaid
Private Insurance
Self-pay/Other
Body Mass Index Classification
Underweight/Normal Weight 2,713 80.03 677 19.97
0.006
Overweight 1,543 77.27 454 22.73
Obese 2,470 77.02 737 22.98
Gestational Diabetes
No 6,447 78.44 1,772 21.56
0.06
Yes 279 74.40 96 25.60
Gestational Hypertension
No 5,520 76.00 1,723 24.00
<0.0001
Yes 1,206 90.61 125 9.39
Surfactant Replacement Therapy
No Yes Antenatal Steroids No Yes
Assisted Ventilation for Infant
No
Yes
Total 6,726 1,868
*P-value for the continuous maternal age variable comes from the F test.
39
Table 4.3: Relative risk of neonatal death for delivery in a non-Level III hospital, compared to deliveries in a Level III hospital, from marginal-structural models with and without consideration of censoring due to fetal deaths.
Marginal-Structural Model ARR 95% CI
Live births only, no censoring by fetal deaths -- Model 1* 1.62 (1.36, 1.93)
All in-hospital deliveries, fetal deaths analyzed as censored -- Model 1* 1.81 (1.52, 2.15) Live births only, no censoring by fetal deaths -- Model 2** 1.72 (1.45, 2.05)
All in-hospital deliveries, fetal deaths analyzed as censored -- Model 2** 1.88 (1.55, 2.28)
*Model 1 adjusts for the following variables for live births: maternal age, maternal race, first trimester entry into prenatal care, pre-pregnancy body mass index, gestational hypertension, gestational diabetes, method of delivery payment, surfactant replacement therapy, antenatal steroids, and assisted ventilation for infant.
If fetal deaths are included as censored observations, fetal deaths are adjusted for maternal age, maternal race, first trimester entry into prenatal care, pre-pregnancy body mass index, gestational hypertension, and gestational diabetes.
40 Table 4.4: Relative risk of neonatal and perinatal death for delivery in a non-Level III hospital, compared to delivery in a Level III hospital, from log-binomial regression.
Outcome Variable ARR 95% CI
Neonatal death* 1.71 (1.44, 2.04)
Perinatal death** 2.63 (2.47, 2.79)
*Neonatal death model adjusts for the following variables for live births:
maternal age, maternal race, first trimester entry into prenatal care, pre-pregnancy body mass index, gestational
hypertension, gestational diabetes, method of delivery payment, surfactant replacement therapy, antenatal steroids, and assisted ventilation for infant.