International Journal of Nanomedicine
Dove
press
O r I g I N a l r e s e a r c h
open access to scientific and medical research
Open access Full Text article
Preparation and tumor cell model based
biobehavioral evaluation of the nanocarrier
system using partially reduced graphene oxide
functionalized by surfactant
Yimin Wang1
Kunping liu1,2
Zewei luo1
Yixiang Duan1
1research center of analytical
Instrumentation, Key laboratory of Bio-resource and eco-environment, Ministry of education, college of life science, sichuan University, 2Faculty
of Biotechnology Industry, chengdu University, chengdu, People’s republic of china
Background: Currently, surfactant-functionalized nanomaterials are tending toward development of novel tumor-targeted drug carriers to overcome multidrug resistance in cancer therapy. Now, investigating the biocompatibility and uptake mechanism of specific drug delivery systems is a growing trend, but usually a troublesome issue, in simple pharmaceutical research.
Methods: We first reported the partially reduced graphene oxide modified with poly(sodium 4-styrenesulfonate) (PSS) as a nanocarrier system. Then, the nanocarrier was characterized by atomic force microscope, scanning electron microscope, high-resolution transmission electron microscope, ultraviolet–visible (UV-vis) spectroscopy, Fourier transform infrared spectroscopy, X-Ray powder diffraction, and Raman spectroscopy. Epirubicin (EPI) was attached to PSSG via π–π stacking, hydrogen bonding, and physical absorption to form conjugates of PSSG–EPI. The adsorption and desorption profiles, cytotoxicity coupled with drug accumulation, and uptake of PSSG and PSSG–EPI were evaluated. Finally, the subcellular behaviors, distribution, and biological fate of the drug delivery system were explored by confocal laser scanning microscope using direct fluorescence colocalization imaging and transmission electron microscopy.
Results: The partially reduced graphene oxide sheets functionalized by surfactant exhibit good dispersibility. Moreover, due to much less carboxyl groups retained on the edge of PSSG sheets, the nanocarriers exhibit biocompatibility in vitro. The obtained PSSG shows a high drug-loading capacity of 2.22 mg/mg. The complexes of PSSG–EPI can be transferred to lysosomes in 2 hours through endocytosis, then the drug is released in the cytoplasm in 8 hours, and ultimately EPI is delivered into cell nucleus to exhibit medicinal effects in 1 day.
Conclusion: The comprehensive exploration of the biological uptake mechanism of functional graphene-mediated tumor cell targeting model provides a typical protocol for evaluation of drug delivery system and will benefit the discovery of new surfactant-modified nanocarriers in nanomedicine.
Keywords: biocompatibility, cytotoxicity, drug delivery, controlled release, fluorescence colocalization, epirubicin
Introduction
An effective chemotherapeutic drug should specifically and highly accumulate in tumor tissues and target the tumor cells,1,2 since drugs in the family of anthracyclines, includ-ing doxorubicin (DOX), daunorubicin (DNR), idarubicin (IDA), and epirubicin (EPI), can only operate in the nucleus of tumor cells through the following mechanisms: 1) by inhibiting the DNA synthesis; 2) by inhibiting topoisomerase II and inducing cell
correspondence: Yixiang Duan research center of analytical
Instrumentation, college of life science, sichuan University, 29 Wangjiang road, chengdu 610064, People’s republic of china
Tel +86 28 8541 8180 Fax +86 28 8541 8180 email [email protected]
Journal name: International Journal of Nanomedicine Article Designation: Original Research
Year: 2015 Volume: 10
Running head verso: Wang et al
Running head recto: Biobehavioral evaluation of partially reduced graphene oxide DOI: http://dx.doi.org/10.2147/IJN.S82354
International Journal of Nanomedicine downloaded from https://www.dovepress.com/ by 118.70.13.36 on 23-Aug-2020
For personal use only.
Number of times this article has been viewed
This article was published in the following Dove Press journal: International Journal of Nanomedicine
Dovepress
Wang et al
apoptosis; and 3) by damaging DNA through production of free radicals.3,4 Among these anthracycline drugs, EPI is an intercalating agent to DNA synthesis that results in lower cardiotoxic accumulation than DOX.5 However, many of current drugs still have permission to be used at low dose due to their cardiotoxicity and other side effects such as bone marrow suppression and multidrug resistance (MDR), which limit their applications.6 Thus, it is necessary to seek a selective delivery and uptake drug carrier.
As a two-dimensional monolayer sheet of carbon atoms, graphene and its related derivatives have been widely explored in material science during the past 10 years. Graphene-based nanomaterials play an important role in drug development due to their outstanding chemical and biological properties such as large surface area, easy cellular uptake, and relatively low toxicity.7–9 As newly developed nanocarriers in biomedicine, the roles of graphene and its derivatives have been reviewed by Liu et al.10 Among these drug carriers, reduced graphene oxide (rGO) can be obtained through a chemical method using sodium borohydride11 or hydrazine hydrate12 to remove or decrease the oxygen-containing groups, thus attenuating the cytotoxicity, genotoxicity, and tissue toxic reaction in the lungs of mice compared with
GO.13–17 However, unmodified rGO is hydrophobic, tends
to aggregate, and exhibits poor dispersibility in water as it contains much less hydrophilic functional groups. All these disadvantages largely limit their applications in biomedicine. To obtain an aqueous dispersion of rGO, a suitable modi-fied reagent was required.18 In the previous reports, various polymers or polyelectrolytes were used to attach onto the surface of the rGO sheets through noncovalent bonds without damaging the surface structure of graphene sheets. Liu et al reported the example of poly(diallyldimethylammonium chloride) (PDDA) functionalized graphene as a biosensor.19 Feng et al20 developed polyethyleneimine (PEI)-modified GO with reduced toxicity and applied it in intracellular gene transfection. Depan et al21 decorated graphene with folate and used it as a drug delivery system. Miao et al22 proposed the tumor cell-recognizing regent of cholesteryl hyaluronic acid (CHA) to enhance the tumor-specific nanocarrier of rGO. Among these modification reagents, a functional dispersant of poly(sodium 4-styrenesulfonate) (PSS) showed nontoxic and water dispersibility, which can be employed as a spacer via π–π stacking interaction to prevent the restacking of rGO through electrostatic interaction.23 Furthermore, the polymer of PSS can supply more 2D aromatic planes to rGO, thus significantly enhancing its drug loading efficiency.24 Therefore, the PSS-decorated nanographene (PSSG) has
attracted more and more attention recently.25–27 However, almost all of those works concentrated on the capacitance performance, the electrochemical, and dielectric properties of PSS-functionalized rGO,28 but less attention has been paid to the biological applications of PSSG, especially in the field of drug carrier development. The only reported work is that the PSS-modified graphene was conjugated with quantum dots for cell imaging,29 while the antitumor efficacy as a drug carrier and biobehavioral study of PSSG in tumor cells were neglected. Additionally, the phenomenon of partial deoxygenation process of GO via chemical reduction has never been paid enough attention.30,31
Considering the gaps in the field of the drug delivery system mentioned above, a partially rGO functionalized by PSS (PSSG) with good dispersibility and biocompatibility was prepared in this study. Then a typical anticancer drug, EPI, which is commonly used in clinical chemotherapy, was attached onto PSSG via strong π–π stacking, hydrogen bonding, and physical absorption to form the drug delivery system named PSSG–EPI. Three human carcinoma cell lines, including MCF-7 (human breast cancer cell lines), HCT116, and SW620 (human colorectal cancer cell lines), were selected to perform the assessments of cytotoxicity, cellular uptake, subcellular distribution, and accumulation of this drug delivery system.
Experimental section
reagents and instruments
PSS (average Mw ~70,000), natural graphite powder, and Hoechst33342 were acquired from Sigma-Aldrich (St Louis, MO, USA). Hydrazine hydrate (80%), concentrated sulfuric acid (98%), H2O2 (30%) were purchased from Kelong Chemical Co., Ltd. (Chengdu, People’s Republic of China). EPI was obtained from Meilun Biology Technology Co., Ltd. (Dalian, People’s Republic of China). Dulbecco’s Modified Eagle’s Medium (DMEM, Hyclone) and fetal bovine serum (FBS, Hyclone) were received from Aoke Biotechnology Co., Ltd (Chengdu, People’s Republic of China). Trypsin–EDTA (ethylene diamine tetraacetic acid) (0.25%), and penicillin and streptomycin (100 units/mL and 100 μg/mL, respectively) were from Solarbio Co., Ltd. (Beijing, People’s Republic of China). Cell Counting Kit-8 (CCK-8) and Lyso-Tracker Red (LTR; 1 mM; Invitrogen Life Technologies, Inc.) were obtained from Beyotime Insti-tute of Biotechnology Co., Ltd (Nanjing, People’s Republic of China). Other chemicals are of analytical grade, and ultrapure water of 18.2 MΩ cm (Ulupure, Chengdu, People’s Republic of China) was used for all the experiments.
International Journal of Nanomedicine downloaded from https://www.dovepress.com/ by 118.70.13.36 on 23-Aug-2020
Dovepress Biobehavioral evaluation of partially reduced graphene oxide
Fluorescence measurements were conducted on an LS-55 spectrometer (PerkinElmer, Waltham, MA, USA). Ultraviolet–visible (UV-vis) spectra were obtained from a Lambda 25 spectrometer (PerkinElmer). Fourier transform infrared (FTIR) spectra were recorded on a Frontier FT-IR/ NIR spectrometer (PerkinElmer). Raman shifts were recorded on a LabRAM HR (HORIBA, Les Ulis, France). To analyze the surface topography, size, and thickness of samples, atomic force microscopy (AFM) and scanning electron microscopy (SEM) were performed on a MFP-3D-BIO (Oxford Instru-ments, Abingdon, UK) and a JSM-7500F (JEOL, Tokyo, Japan), respectively. High-resolution transmission electron microscopy (HR-TEM) was conducted on a Tecnai G2 F20S-TWIN (FEI, Hillsboro, OR, USA) at 200 kV. X-ray powder diffraction (XRD) was performed on an X-Max 51-XMX0019 (Oxford Instruments). Confocal laser scanning microscope (CLSM) and fluorescent microscopy were carried out on a FV1000 and a BX53 (Olympus, Tokyo, Japan), respectively. All the cell culture and observation work were finished by using a MCO-15AC CO2 incubator (Sanyo, Osaka, Japan) and inverted phase contrast microscope (MI-12, Guangzhou Ming-Mei Technology, Co., Ltd, Guangzhou, People’s Republic of China). The cell concentrations were measured by a handheld automated cell counter (Scepter™, Millipore, Billerica, MA, USA). A microplate reader (MULTISKAN MK3, Thermo Scientific, Waltham, MA, USA) was utilized to test the absorbance in cytotoxicity assays.
synthesis and characterization of Pssg
PSSG was obtained from GO, which was prepared using a slightly modified Hummer method32 based on our previous work.33 To produce the PSS-functionalized graphene as the
experimental group, GO was reduced using the procedure shown in Figure 1. Typically, stable GO solution (66 mL, 0.5 mg/mL) was sonicated for 20 minutes and centrifuged at 3,000 rpm for 30 minutes to remove large flakes. Then, 33.3 mL water and 1 mL PSS (30 wt%) was added into the GO aqueous dispersion. After continuously stirring for 30 minutes, the mixtures were heated to 60°C. Then 3.3 mL hydrazine hydrate (80%, vol/vol in H2O) was added, and the whole dispersions were maintained at 95°C under reflux for 3 hours. To explore the reduction degree of GO in the control groups, the dose of hydrazine hydrate was increased to five times that of the experimental group, and the refluxing time was extended to 4 or 12 hours. The obtained black suspen-sion was washed with water three times and centrifuged at 14,000 rpm for 15 minutes to discard the spare hydrazine and PSS. The resuspended aqueous dispersion was named PSSG. For synthesis of pure graphene as the control group, the obtained GO nanosheets were reduced directly by hydra-zine hydrate without PSS.
adsorption and desorption of Pssg
with ePI
EPI was loaded onto PSSG by mixing it with PSSG in water solution. In the experiment, various amounts of PSSG (10, 30, 50, 70, 90, 110, 130, 150, 160, 170, and 180 μL of 100 μg/mL) were added into 2 mL of 20 μg/mL EPI to explore the maximum adsorption capacity of EPI. The mixtures were incubated in a shaking table (120 rpm) at room temperature for 2 hours followed by centrifugation at 14,000 rpm for 15 minutes to remove the sediments. The unbound EPI in the supernatant was quantified by its fluo-rescence intensity at 595 nm, with an excitation wavelength
2+ 2+ 2+ 2+ 2+ 2+ 2+ 2+ 2+ 2+ 2+ 2+ 2+
+1
+K 'UXJUHOHDVH 1XFOHXV &\WRSODVP K ++ + ++ + + + + ++ + + + + + + + + + + +² ++ (QGRF\WRVLV ,QFXEDWLRQ K 2+ 2+ 2+ 2+ 2+ 2+
1++2UHIOX[K 2+ 2+ 2+ 2+ +2 +2 +2 +2 +2 +2 *2 366* 366*(3, 366 (3, /\VRVRPH /\VRVRPH 7XPRUFHOO 2 2 2 2 2 2 2 2 2 2 2 2 2 2 2 2 2 2 2 2 2 2 2 2 2 2
Figure 1 Preparation and bio-application diagram of the partially reduced graphene oxide sheets mediated drug carrier system.
Abbreviations: gO, graphene oxide; Pssg, Pss-decorated nanographene; Pss, poly(sodium 4-styrenesulfonate); ePI, epirubicin; h, hours.
International Journal of Nanomedicine downloaded from https://www.dovepress.com/ by 118.70.13.36 on 23-Aug-2020
Dovepress
Wang et al
at 488 nm. Then, the maximum loading capacity (MLC) of EPI on PSSG was defined based on the amount of PSSG, which made the fluorescence intensity of the supernatant unchanged at a low level. Finally, the resultant conjugates, PSSG–EPI, were resuspended in water and re-stored at 4°C for further use. According to the maximum adsorption pro-file, 2 mL of 400 μg/mL PSSG–EPI was synthesized exactly under the saturation condition of PSSG to EPI. Finally, the obtained PSSG–EPI was stored at 4°C for all the following experiments. Note that all the concentrations of PSSG–EPI mentioned in this paper were calculated as the correspond-ing content of EPI.
For the release of EPI, the complexes of PSSG–EPI (20 μg/mL) were divided into eight aliquots, and then incu-bated for different periods of time (0, 5, 10, 15, 20, 25, 30, 60, 90, 120, 180, 300, and 480 minutes). The EPI release experiments were carried out in ethanol, water, phosphate, or acetate buffer at different pH values (2.0, 4.6, and 7.4) using the same protocol as described above. The amount of free EPI in the supernatant at different time points and the pH values were measured again using fluorescence spectrom-eter. UV-vis spectra of the released EPI from PSSG–EPI were also measured to evaluate the different release rates between water and ethanol solutions.
cell culture, proliferation, and uptake
along with changes of morphology
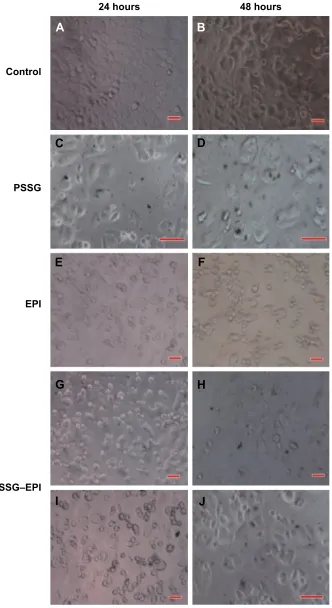
Three human carcinoma cell lines, MCF-7, HCT116, and SW620 were selected to assess cytotoxicity of PSSG and the PSSG–EPI complex on tumor cells. All the cells were cultured in DMEM containing 10% FBS and 1% penicillin– streptomycin solution at 37°C in a humidified atmosphere supplemented with 5% CO2. The effects of different materials on morphology of the MCF-7 cells were observed in real time at 24 and 48 hours using an inverted phase contrast microscope. Typically, the living cells were cocultured with DMEM containing PSSG (5 μg/mL), EPI (2 μg/mL), and PSSG–EPI (2 and 10 μg/mL), and the control groups were treated with PBS.
In vitro cellular toxicity evaluation
Cell densities of HCT116, SW620, and MCF-7 were measured by a handheld automated cell counter. Then cells were seeded in a 96-well cell culture plate at 1.0×10⁴ for cytotoxicity test of PSSG and 5.0×10³ for cell killing test of EPI/PSSG–EPI per well. Specifically, various concentrations of PSSG (1, 2, 5, 10, 20, 40, 50, and 100 μg/mL) were incubated with three kinds of cell lines for 24 and 48 hours, respectively. Furthermore, EPI
and PSSG–EPI (2 and 10 μg/mL, according to the concentra-tions of EPI in PSSG–EPI) were incubated with MCF-7 for 24 and 48 hours, respectively. Each concentration was tested for three independent replications. After that, the DMEM was replaced with 100 μL fresh culture medium containing 10 μL CCK-8 and incubated at 37°C for 4 hours, the absorption val-ues were measured on a microplate reader at 450 nm.
Drug delivery, tracking, and fluorescence
colocalization imaging
MCF-7 was used to verify the specific uptake of PSSG–EPI in the following steps. First, cells were seeded on a coverslip in a six-well plate (2 mL cell suspension liquid per well) at a density of 2.0×10⁵ cells/mL. After 24 hours, the cells were treated with 35 μL PSSG–EPI (400 μg/mL) for the experimental group and 30 μL EPI (500 μg/mL) for the posi-tive control group. Second, the cells was incubated with drug for 12 hours and fixed with 2.5% glutaraldehyde for 15 min-utes. After that, cells were stained with Hoechst33342 (10
μg/mL) for 10 minutes. Finally, the coverslips were washed slightly with PBS three times to remove the unbound dye and observed by CLSM. For fluorescence colocalization analysis, cells were treated with free EPI or PSSG–EPI for 2, 8 and 24 hours, respectively, using a similar protocol as mentioned above and incubated with LTR (a fluorescence probe for lysosome-targeted imaging, 100 nM) for 30 minutes before observing fluorescence under confocal microscopy.
subcellular behavior observation under
TeM
MCF-7 cells were exposed to 10 μg/mL of PSSG for 3 or 24 hours. For the control group, cells were cultured in DMEM for 3 hours. Then, the cells were harvested and fixed with 2.5% glutaraldehyde overnight at 4°C. After that, the cell suspensions were centrifuged at 5,000 rpm for 10 minutes. Finally, the obtained precipitates were embedded in epoxy resin followed by cutting the clumps into ultrathin sections before TEM observations.
Results and discussion
synthesis and characterization of Pssg
To obtain the water dispersible rGO, PSS, a dispersant that played the role of spacer, was used to prevent the nanosheets from aggregating.34 In our experiment, the reduction time of PSSG was optimized briefly by monitoring the FTIR spectra of PSSG. We found that the oxygen-containing groups such as epoxy group, hydroxyl group, and most of the carboxyl groups on the edge of GO sheets had been removed, within
International Journal of Nanomedicine downloaded from https://www.dovepress.com/ by 118.70.13.36 on 23-Aug-2020
Dovepress Biobehavioral evaluation of partially reduced graphene oxide
the reduction time of 3 hours. The partially rGO obtained exhibits good water dispersibility. We also found in the reduction process that when the refluxing time of PSSG was extended to 12 hours and the dosage of the reductant was increased to five times the ratio used in the partially reduced GO, the peak of C=O in carbonyl groups at 1,735 cm-1 dis-appeared (Figures S1 and S2), which is distinctly different from previous work,35 while the corresponding completely reduced GO shows poor water solubility. For the sake of biological use, we selected the partially rGO for all the fol-lowing experiments.
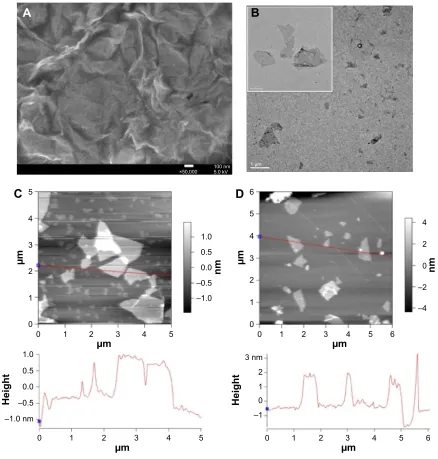
The sizes and morphological characteristics of PSSG were observed through SEM, TEM, and AFM. SEM imaging shows the undulating surface of PSSG (Figure 2A), which could pro-vide a rough view of the nanomaterial. As a nanocarrier, the average size is important for systemic circulation. The TEM images in Figure 2B showed that the paper-like single-layer or partially folded rGO sheets appear transparent and that more than 90% of the PSSG sheets were smaller than 500 nm. Also, the exact size and thickness of GO and PSSG were compared with AFM images. Measurements in and Figure 2C and D illustrate that after reduction and ultrasonication, due to the
$
&
P P
P
P
QP
± ±
QP
±
±
+HLJKW +HLJKW
± ±QP
P
P QP
±
'
î QP P N9
%
Figure 2 Microscopic morphology investigations of Pssg.
Notes: (A) seM image of the undulating surface of Pssg. (B) Paper-like, single-layer or partially folded rgO sheets. (C) AFM images with height profiles of GO; (D) and Pssg.
Abbreviations: Pssg, Pss-decorated nanographene; Pss, poly(sodium 4-styrenesulfonate); seM, scanning electron microscopy; TeM, transmission electron microscopy;
aFM, atomic force microscopy; rgO, reduced graphene oxide.
International Journal of Nanomedicine downloaded from https://www.dovepress.com/ by 118.70.13.36 on 23-Aug-2020
Dovepress
Wang et al
π–π noncovalent interaction between PSS and rGO,31,34 the average thickness of PSSG changed from 1 to 1.8 nm, while the size reduced to less than 1 μm, which was accordant with the reported literatures.27,36
The reduction degree of the PSS-functionalized GO was investigated using UV-vis (Figure 3A) and FTIR spectros-copy (Figure 3B). In Figure 3A, a strong absorption peak at 231 nm was observed in GO (curve c), which was attributed to π–π* transitions of C=C in aromatic ring. In addition, the shoulder peak at 302 nm indicated the n–π* transitions of the C=O groups. After reduction, the absorption peak of PSSG red-shifted to 271 nm (curve a), which was due to an increas-ing π-electron density and ordered structure, corresponding to the sp2 carbon restoration and possible rearranging of aromatic structure.37 As presented in curve d, PSS has an intense characteristic absorption peak of the aromatic ring at 225 nm and a weak peak at 262 nm,38 while PSSG has the corresponding peaks at 231 and 271 nm with a slight
red-shift, which indicates that PSS has been successfully introduced onto the surface of rGO. The shoulder peak of GO also completely disappeared, with the color changing from black to brown (inserted picture in Figure 3A), which also illustrates the reduction of GO.
FTIR spectrum further confirmed the results obtained above. In Figure 3B, GO has characteristic peaks such as C–O bending at 1,400 cm-1, the C=O stretching in carboxyl groups at 1,735 cm-1,39 and the stretching vibrations of C–O in hydroxyl groups at 1,160 cm-1.40 On the contrary, after reduction, most of the oxygen functional groups, includ-ing the epoxy group stretchinclud-ing vibration at 1,095 cm-1 and the stretching peak of C–O at 1,160 cm-1, disappeared completely, which illustrates the removal of these oxygen-containing groups in PSSG.41 In addition, the characteristic peak of stretching vibration at 1,735 cm-1 in carboxyl groups decreased dramatically, but was still retained in PSSG, dem-onstrating that the carbonyl groups on the edge of graphene
$
D
*2 366*
' *
,QWHQVLW\ ,QWHQVLW\
D
'
θ°
E
'*
G F
D
E
F
:DYHOHQJWKQP
$EVRUEDQFH
:DYHQXPEHUFP±
7UDQVPLWWDQFH
E
F G
%
&
'
5DPDQVKLIWFP±
±2+
±&22+
& & ±2+
&±2±& &±2
±62
±
D
E
F
G
Figure 3 chemical characterizations of Pssg.
Notes: (A) UV-vis absorbance spectra of Pssg (a), pure g ([b], gO directly reduced by hydrazine hydrate), gO (c) and Pss (d). (B) FTIr spectra of gO (a), Pss (b), Pssg (c)
and pure g (d). The characteristic peak stretching vibration at 1735 cm-1 in carboxyl groups decreased dramatically but still faintly existed in Pssg (curve c). The characteristic
adsorption peaks at 1497 cm-1, 1180 cm-1, 1129 cm-1 and 670 cm-1 in Pss were also found in Pssg. (C) raman spectra of Pssg (a), (pure g) (b), gO (c) and graphite power
(d). (D) XrD patterns of gO (a), graphite (b) and Pssg (c).
Abbreviations: Pss, poly(sodium 4-styrenesulfonate); gO, graphene oxide; UV-vis, ultraviolet–visible; FTIr, Fourier transform infrared; XrD, X-ray powder diffraction.
International Journal of Nanomedicine downloaded from https://www.dovepress.com/ by 118.70.13.36 on 23-Aug-2020
Dovepress Biobehavioral evaluation of partially reduced graphene oxide
sheets were hard to be reduced, which led to partial reduction of GO. Decreasing the oxidation degree of GO and blocking the aggregation of graphene nanosheets could significantly reduce tissue toxic reaction in the lungs of mice,15 and the remaining carboxyl groups on the edge of PSSG sheets achieve a balance between water dispersion and nontoxicity. The characteristic adsorption peaks of PSS at 1,497, 1,180, 1,129, and 670 cm-1 also suggested that PSS was successfully introduced to the complexes of PSSG.
The reduction process of GO was also confirmed using Raman spectroscopy. In Figure 3C, the PSSG (curve a) exhibits two characteristic peaks at 1,350 cm-1 (D band) and 1,597 cm-1 (G band), which correspond to the structural disorder and graphitic component.42 The intensity ratio (ID/IG) of PSSG is 1.14, which is higher than that of GO (ID/IG =1.07) (curve c). These results suggest that more aromatic domains formed after the reduction of GO. Thus, the obtained PSSG has a high drug-loading capacity through
π–π stacking.24,35
XRD patterns of the prepared PSSG were also performed to investigate the interlayer distance between the nanosheets and the deoxygenation process of GO.41 In Figure 3D, the strong peak at 2θ=26.6° of graphite (curve b) and the weak peak at 2θ=11.1° of GO (curve a) indicate an increasing distance between the interlayers of GO, which is due to the
existence of water molecules and oxygenous groups in the spacing of graphene sheets.35 No obvious diffraction peak was found in PSSG (curve c), demonstrating the formation of exfoliated single-layer graphene after reduction.
ePI loading and release from the drug
carrier
ePI loading on Pssg
The drug loading efficiency of PSSG was quantified by evalu-ating the concentration of free drug in the supernatants of PSSG–EPI according to the fluorescence intensity of EPI at 595 nm via an excitation wavelength at 488 nm. In Figure 4A, with the increased addition volumes (from a to k) of PSSG (100 μg/mL), the intensity of fluorescence emission peaks at 595 nm of the supernatants gradually decrease from 500 to below 50 and remain constant at the volume of 180 μL (curve k), which indicate that PSSG has reached its saturation adsorption value. Since 2 mL of 20 μg/mL EPI was exactly absorbed on 180 μL of 100 μg/mL PSSG, the MLC of PSSG to EPI can be calculated as the mass ratio of EPI to PSSG (40–18 μg). Therefore, for our drug carrier system, the MLC is 2.22 mg/mg, which is much higher than that of GO in the reported literatures (with corresponding values of 0.815,43 1,21 1.436 and 2 mg/mg,22 respectively). This is mainly due to the π–π stacking
D
D
E
:DYHOHQJWKQP :DYHOHQJWKQP
7LPHPLQXWHV
:DYHOHQJWKQP
,QWHQVLW\ ,QWHQVLW\
5HOHDVHG(3,
&
$
%
'
$EVRUEDQFH
D E
D
E
D E
F
N
Figure 4 Drug loading and controlled release.
Notes: (A) Real time monitoring fluorescence spectra of the released free EPI in the supernatants after a sequentially increased volumes of 100 μg/ml Pssg (from a to k,
10, 30, 50, 70, 90, 110, 130, 150, 160, 170 and 180 μl, respectively), was added into 2 ml of 20 μg/ml ePI and incubated for 2 hours. Fluorescence spectra (B), and UV-Vis absorption spectra (C) of Pssg-ePI (20 μg/ml) after incubating in ethanol (a) and water (b) for 2 hours. Inserted graph in (C) shows the different colors of supernatants of Pssg-ePI released in ethanol (a) and water (b). (D) The relative released proportion of ePI from Pssg-ePI in different buffer solutions at ph 2.0 (a), ph 4.6 (b) and ph 7.4 (c). All data were normalized to the fluorescence intensity of EPI released from PSSG in ethanol under the same concentration.
Abbreviations: Pssg, Pss-decorated nanographene; Pss, poly(sodium 4-styrenesulfonate); ePI, epirubicin.
International Journal of Nanomedicine downloaded from https://www.dovepress.com/ by 118.70.13.36 on 23-Aug-2020
Dovepress
Wang et al
interaction between PSSG and EPI and sp2 hybridized structure of graphene nanosheets. Moreover, the hydrogen bonding interaction between the residual carboxyl groups on rGO and the sulfonic acid groups of PSS compromised the flexible polymer and the rigid nanosheets. In short, the polymer of PSS can supply more 2D aromatic planes to rGO, thus significantly enhancing its loading efficiency to aromatic drug molecules.21,44
ePI release from Pssg
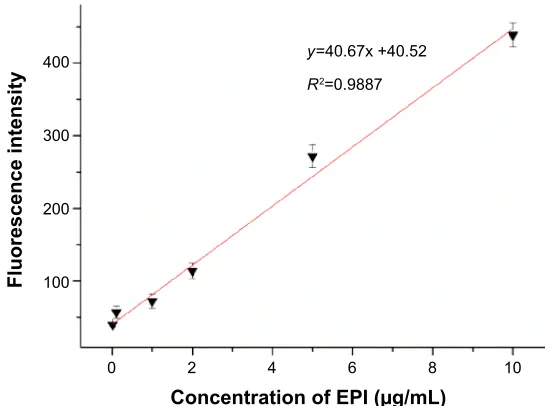
The release rate is an important parameter of a drug delivery system.36 First, the maximum release ratio of EPI from PSSG was evaluated by fluorescence spectroscopy and UV-vis absorption in ethanol. In Figure 4B, the fluorescence intensity of PSSG–EPI released in ethanol (curve a) is about ten times higher than that of PSSG–EPI released in water (curve b). On the other hand, in Figure 4C, the characteristic UV-vis absorp-tion peaks at 501 nm attributed to PSSG–EPI releasing in ethanol (a) and water (b) also indicate a higher releasing rate in ethanol. The release profiles of EPI from the PSSG were also carried out in PBS (pH 7.4) and acetate buffer (pH 4.6 and 2.0). Considering the fluorescent standard curve of EPI in water in Figure S3 and as presented in Figure 4D, only about 27% of the total initial EPI released as free drug at pH 7.4 (curve c), even after 8 hours. However, about 37% and 64% of total EPI released from PSSG during the first 30 minutes at pH 4.6 (curve b) and pH 2.0 (curve a), respectively. After incubating for 8 hours, the corresponding releasing rates were 61% at pH 4.6 and 81% at pH 2.0, indicating that EPI released much more quickly from PSSG at acidic pH than that in neutral or alkaline solution. It should be noted that the effect of fluorescent quantum yields of EPI in different solvents was excluded via a calibration curve of EPI in Figure S4, in which the corresponded correction factors of different solvents were presented. The pH-controlled and time-dependent release of the nanocarrier is useful in drug delivery since the tumor tissue and intracellular lysosomes have an acidic environment, too.44 In short, a nanocarrier system with high drug-loading ratio and quick release speed heavily depends on pH values.
Morphology monitoring in tumor cells
and antitumor efficacy assessment
in vitro
During the coculture process of cell-EPI and cell-PSSG–EPI, the morphologic changes of cells were observed and recorded in real time using a phase contrast microscope. As shown in Figure 5, comparing with the control group (Figure 5A
and B), after MCF-7 cells were exposed to PSSG (5 μg/mL) for 24 hours (Figure 5C) and 48 hours (Figure 5D), the cel-lular outlines still remained, and the density of cells were quite high compared with the control group (Figure 5A and B), indicating that the nanocarrier itself almost has no effect on the growth of living cells in vitro, which makes it possible to be a promising low toxic drug carrier system. On the contrary, after 24 or 48 hours incubation with pure EPI (2 μg/mL in [Figure 5E] and [Figure 5F]) or PSSG–EPI (with corresponding concentration of EPI at 2 μg/mL in [Figure 5G] and [Figure 5H], 10 μg/mL in [Figure 5I] and [Figure 5J]), cells grew slowly with a low density.
The cytotoxicity of the nanocarrier itself and antitumor effect of the PSSG–EPI complexes were tested by CCK-8 assay to confirm the results of the morphology observations above. In Figure 6, the relative viability of different tumor cell lines including HCT116, SW620, and MCF-7 treated with various concentrations of PSSG (Figure 6A), EPI/PSSG–EPI (Figure 6B) were evaluated. Cell viability was assessed by the relative value to the control group (treated with PBS). In Figure 6A, after 24 and 48 hours incubation with increasing concentrations of PSSG, the changes of relative viability of cells are negligible. The results obtained from the three cell lines give the conclusion that no obvious cytotoxicity was found for the drug carrier, even at a concentration of 100 μg/mL, which is much higher than that currently used in formal drug delivery. On the other hand, when cells were cultured with free EPI or the corresponding concentrations in PSSG–EPI (Figure 6B), the cell killing capacity is evi-dent. In addition, Figure 6B also shows that PSSG–EPI has a higher cell killing capacity than that of free EPI after 24 hours incubation, which is attributed to the targeted releasing characteristic of the drug carrier. Compared with 24 hours, MCF-7 cells incubated with PSSG–EPI for 48 hours show a more evident cell killing ability than that of free EPI, which is mainly due to the pH and time-dependent high release efficiency of EPI from PSSG.
cellular uptake and controlled release
in tumor cells by fluorescence imaging
The uptake efficiency and specific biodistribution of PSSG– EPI in MCF-7 cells was investigated by confocal micro-scope. In Figure 7, MCF-7 cells were treated with free EPI (Figure 7A) and equivalent concentration of PSSG–EPI (Figure 7B) for 12 hours. The blue fluorescence channel of Hoechst33342 shows the locations of nucleus and the red channel indicates the distribution of EPI. For cells treated with free EPI in Figure 7A, strong red fluorescence was
International Journal of Nanomedicine downloaded from https://www.dovepress.com/ by 118.70.13.36 on 23-Aug-2020
Dovepress Biobehavioral evaluation of partially reduced graphene oxide
KRXUV
$
&
'
(
*
+
,
-)
%
&RQWURO
366*
(3,
366*±(3,
KRXUV
Figure 5 real time morphology observations of McF-7 cells.
Notes: control group (A and B). after McF-7 cells were exposed to Pssg (5 μg/ml) for 24 hours (C) and 48 hours (D), the cellular outlines still remained, and the density
of cells were quite high compared with the control group (A and B), indicating that the nanocarrier itself almost has no effect on the growth of living cells in vitro, which makes it possible to be a promising low toxic drug carrier system. On the contrary, after 24 or 48 hours incubation with pure ePI (2 μg/ml in (E) and (F)) or Pssg–ePI (with corresponding concentration of ePI at 2 μg/ml in (G) and (H), 10 μg/ml in (I) and (J)), cells grew slowly with a low density. scale bar, 40 μm.
Abbreviations: ePI, epirubicin; Pssg, Pss-decorated nanographene; Pss, poly(sodium 4-styrenesulfonate).
International Journal of Nanomedicine downloaded from https://www.dovepress.com/ by 118.70.13.36 on 23-Aug-2020
Dovepress
Wang et al
observed in MCF-7 cells after 12 hours incubation, even in the nucleus, while for the cells treated with PSSG–EPI, a relatively high amount of EPI is still concentrated in the cytoplasm, which is attributed to the different uptake mechanisms of free EPI and PSSG–EPI. According to our current knowledge from previous research work,45 free EPI could enter tumor cells through diffusion, whereas for the nanocarrier system, PSSG–EPI is mainly internalized by the endosome-mediated endocytosis pathway,46 which is much
slower than direct diffusion. Moreover, the pH dependent controlled release experiment of PSSG–EPI in this work also demonstrates that the sustained release process took more time than that in the first transport route. Thus, the reliable results were obtained here by direct fluorescence imaging with low fluorescence background using EPI/PSSG-EPI, which could be significantly superior to the fluorescein isothiocyanate (FITC)-labeled nanomaterial localization in previous work.24,47
&RQWURO
&RQWURO &RQWURO &RQWURO
KRXUV KRXUV
KRXUV
KRXUV
&RQFHQWUDWLRQRI366*JP/ &RQFHQWUDWLRQRI(3,JP/
&HOOYLDELOLW\RIFRQWURO &HOOYLDELOLW\RIFRQWURO
+&7 6: 0&)
%
(3, 366*±(3,$
Figure 6 cytotoxicity of the nanocarrier and antitumor effect of Pssg–ePI.
Notes: The relative viability of different tumor cell lines hcT116, sW620, and McF-7 treated with various concentrations of Pssg (A), ePI and Pssg–ePI (B) were
evaluated. cell viability was assessed by the relative value to the control group (treated with PBs). The error bars represent the standard deviation.
Abbreviations: ePI, epirubicin; Pssg, Pss-decorated nanographene; Pss, poly(sodium 4-styrenesulfonate); PBs, phosphate buffer solution.
(3, +RHFKVW 0HUJH %ULJKWILHOG
D D
E E
$
%
Figure 7 The uptake efficiency and specific biodistribution of PSSG–EPI in MCF-7 cells was investigated by confocal microscope.
Notes: McF-7 cells were treated with free ePI (A) and equivalent concentration of PSSG–EPI (B) for 12 hours. Nucleus was stained blue with hoechst 33342. scale bar,
40 μm. local regions of (a) and (b) contain representative cells pointed to by the white arrows were correspondingly presented with partial higher resolution views (scale bar, 10 μm) in a1 a2, b1 and b2. laser excitation wavelengths were 488 nm and 405 nm for ePI and hoechst, respectively.
Abbreviations: ePI, epirubicin; Pssg, Pss-decorated nanographene; Pss, poly(sodium 4-styrenesulfonate).
International Journal of Nanomedicine downloaded from https://www.dovepress.com/ by 118.70.13.36 on 23-Aug-2020
Dovepress Biobehavioral evaluation of partially reduced graphene oxide
cellular uptake mechanism and
time-dependent subcellular fluorescence
colocalization
To further investigate the cellular uptake mechanism, the biodistribution and the fate of internalization biobehaviors of drug carrier system, a fluorescence colocalization assay by confocal microscopy was conducted. As shown in Figure 8, MCF-7 cells were treated with free EPI (control a, b, and c in Figure 8) or PSSG–EPI for 2 hours (A), 8 hours (B), and 24 hours (C), respectively. To track the release of EPI, the
lysosomes were stained with red by LTR. The green channel shows the distribution of EPI (treated with pseudocolor to distinguish from the color in LTR channel), while the cell nucleus appears blue. The bright-field images indicate the external profile of tumor cells. As shown in the green chan-nel, both the intensity of cells treated with free EPI (control groups) and PSSG–EPI became stronger as time went by. Among these results, with an incubation time of 2 hours (Figure 8A), cells treated with PSSG–EPI show weaker fluorescence than do cells treated with free EPI for the same (3,
&RQWUROE &RQWUROD
&RQWUROF
KRXUV KRXUV KRXUV
/75 +RHFKVW 0HUJH %ULJKWILHOG
P P P P P
P P P P P
P P P P P
P P P P P
P P P P P
P P P P P
$
%
&
Figure 8 Fluorescence colocalization assay by confocal microscopy to determine biodistribution.
Notes: MCF-7 cells were treated with free EPI (controls a, b, and c) or PSSG–EPI for 2 hours, showing weak fluorescence (A), 8 hours, showing stronger green fluorescence
at the perinuclear region (B), and 24 hours, showing strong fluorescence in the nucleus (C), respectively.
Abbreviations: ePI, epirubicin; Pssg, Pss-decorated nanographene; Pss, poly(sodium 4-styrenesulfonate); lTr, lyso-Tracker red.
International Journal of Nanomedicine downloaded from https://www.dovepress.com/ by 118.70.13.36 on 23-Aug-2020
Dovepress
Wang et al
time, which corresponds to the sustained release of EPI from the nanocarrier and the slower speed of endocytosis path-way than that of the diffusion pathpath-way. The merged images of EPI and LTR clearly indicate that the drug adsorbed on nanosheets was entrapped in lysosomal vesicles and partially releases in cytosol. Then, when the incubation time was extended to 8 hours (Figure 8B), interestingly, stronger green fluorescence was found accumulating at the perinuclear region, especially in cells treated with PSSG– EPI, which was demonstrated by the cellular recruitment mediated by the cell nucleus.48,49 Finally, after coculture for 24 hours (Figure 8C), striking fluorescence appears in the cell nucleus, both for pure EPI and PSSG–EPI. Moreover, at 24 hours, fluorescence intensity in cells treated with PSSG-EPI is even stronger than the control groups. Therefore, this significant difference shows that the sustained release system of PSSG–EPI can more effectively deliver the drug into the targeted cell nucleus, which will induce the biobehavior of cell apoptosis.50 Briefly, the results presented above show that EPI could be delivered to the cytosol through lysosomal vesicles using our prepared nanocarrier system and then enter
the cell nucleus in 24 hours. Therefore, the partially rGO could be a promising candidate for a drug carrier system in biomedical application.
Uptake of the nanocarrier under TeM
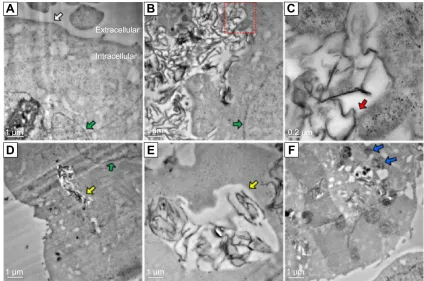
Details of cellular uptake and internalization of nanomaterial with a submicro horizon were observed with TEM. MCF-7 cells were untreated (Figure 9A) or treated with PSSG (10 μg/mL) for 3 hours (B and C) and 24 hours (D–F) before TEM examination. As presented in Figure 9B and C, the nanomaterial was recruited and gathered together near the cell membrane, but outside the cell, showing that no rejec-tion reacrejec-tion occurred between tumor cells and nanomaterial. In addition, some nanosheets of PSSG were trapped by the pseudopod-like structures and surrounded by cell membrane, which indicates that the cellular uptake of PSSG initiated through the endocytic pathway, while in Figure 9D and E, the nanomaterial was found inside the phagocytic vesicles in the cytoplasm, showing evident uptake of nanocarriers. Finally, in Figure 9F, small amounts of PSSG sheets (blue arrows) escaped from phagocytic vesicles and were released
$
'
(
)
&
%
([WUDFHOOXODU
,QWUDFHOOXODU
P P P
P P P
Figure 9 cellular uptake and internalization of nanomaterial observed with TeM.
Notes: McF-7 cells were untreated (A) or treated with Pssg (10 μg/ml) for 3 hours (B and C) and 24 hours (D–F) before TeM examination. as seen in (B) and (C),
the nanomaterial was recruited and gathered together near the cell membrane, but outside the cell, showing that no rejection reaction occurred between tumor cells and nanomaterial. In addition, some nanosheets of Pssg were trapped by the pseudopod-like structures and surrounded by cell membrane, which indicates that the cellular uptake of Pssg initiated through the endocytic pathway, while in (D) and (E), the nanomaterial was found inside the phagocytic vesicles in the cytoplasm, showing evident uptake of nanocarriers. Finally, in (F), small amounts of Pssg sheets (blue arrows) escaped from phagocytic vesicles and were released in the cytoplasm. green and white arrows indicate the cell nucleus and membrane, respectively. red arrows point to the interface of nanomaterial and cell membrane. Yellow arrows point to the phagocytic vesicles in cytoplasm.
Abbreviations: Pssg, Pss-decorated nanographene; Pss, poly(sodium 4-styrenesulfonate); TeM, transmission electron microscopy.
International Journal of Nanomedicine downloaded from https://www.dovepress.com/ by 118.70.13.36 on 23-Aug-2020
Dovepress Biobehavioral evaluation of partially reduced graphene oxide
in the cytoplasm. Based on these TEM observations, we could confirm that the submicron nanocarrier sheets could be smoothly internalized by tumor cells, which was due to cell macropinocytosis response to foreign materials.51 These observations are consistent with the results obtained from fluorescence imaging under CLSM.
Conclusion
In short, the partially rGO functionalized by surfactant with good biocompatibility was successfully prepared. Due to a few retained carboxyl groups on the edge of PSSG sheets, the nanomaterial exhibits favorable dispersibility and bio-compatibility in vitro and can be a useful nanoplatform for drug delivery. The drug delivery system was prepared and evaluated for targeted drug delivery and direct subcellular imaging. Compared with previously reported methods using GO as a drug carrier, the obtained PSSG shows much higher drug loading efficiency. In addition, the easy uptake nano-carrier can be transferred to lysosomes in 2 hours through endocytosis by tumor cells, then released in the cytoplasm in 8 hours, and eventually be delivered into the cell nucleus to exhibit medicinal effects in 1 day (Figure 1). Furthermore, the comprehensive exploration of the biological uptake mecha-nism and delivery differences between free anticancer drug and the modified graphene-mediated tumor-cell killing model will benefit the discovery of new surfactant-functionalized drug carrier systems in biomedicine.
Acknowledgments
The authors acknowledge the financial assistance from National Natural Science Foundation of China (21275105), China Postdoctoral Science Foundation (2013M531961), National Recruitment Program of Global Experts (NRPGE), and the Hundred Talents Program of Sichuan Province (HTPSP). The authors also appreciate the professional opera-tion guidance for CLSM from Olympus engineers.
Disclosure
The authors report no conflicts of interest in this work.
References
1. Rasheed A, Kumar A, Sravanthi V. Cyclodextrins as drug carrier mol-ecule: a review. Sci Pharm. 2008;76:567–598.
2. Yang H-W, Lu Y-J, Lin K-J, et al. EGRF conjugated PEGylated nano-graphene oxide for targeted chemotherapy and photothermal therapy. Biomaterials. 2013;34(29):7204–7214.
3. Bonadonna G, Gianni L, Santoro A, et al. Drugs ten years later: epiru-bicin. Ann Oncol. 1993;4(5):359–369.
4. Minotti G, Menna P, Salvatorelli E, Cairo G, Gianni L. Anthracyclines: molecular advances and pharmacologic developments in antitumor activity and cardiotoxicity. Pharmacol Rev. 2004;56(2):185–229.
5. Nussbaumer S, Bonnabry P, Veuthey J-L, Fleury-Souverain S. Analysis of anticancer drugs: a review. Talanta. 2011;85(5):2265–2289. 6. Qin M, Lee YE, Ray A, Kopelman R. Overcoming cancer multidrug
resistance by codelivery of doxorubicin and verapamil with hydrogel nanoparticles. Macromol Biosci. 2014;14(8):1106–1115.
7. Geim AK. Graphene: status and prospects. Science. 2009;324(5934): 1530–1534.
8. Geim AK, Novoselov KS. The rise of graphene. Nat Mater. 2007;6(3): 183–191.
9. Vila M, Portolés M, Marques P, et al. Cell uptake survey of pegylated nanographene oxide. Nanotechnology. 2012;23(46):465103. 10. Liu J, Cui L, Losic D. Graphene and graphene oxide as new
nano-carriers for drug delivery applications. Acta Biomater. 2013;9(12): 9243–9257.
11. Si Y, Samulski ET. Synthesis of water soluble graphene. Nano Lett. 2008;8(6):1679–1682.
12. Moon IK, Lee J, Ruoff RS, Lee H. Reduced graphene oxide by chemical graphitization. Nat Commun. 2010;1:73.
13. Li Y, Feng L, Shi X, et al. Surface coating – dependent cytotoxicity and degradation of graphene derivatives: towards the design of non – toxic, degradable nano – graphene. Small. 2014;10(8):1544–1554. 14. Liu Y, Luo Y, Wu J, et al. Graphene oxide can induce in vitro and
in vivo mutagenesis. Sci Rep. 2013;3:3469.
15. Duch MC, Budinger GS, Liang YT, et al. Minimizing oxidation and stable nanoscale dispersion improves the biocompatibility of graphene in the lung. Nano Lett. 2011;11(12):5201–5207.
16. Ding Z, Zhang Z, Ma H, Chen Y. In vitro hemocompatibility and toxic mechanism of graphene oxide on human peripheral blood T lympho-cytes and serum albumin. ACS Appl Mater Interfaces. 2014;6(22): 19797–19807.
17. Wu S, Zhao X, Cui Z, et al. Cytotoxicity of graphene oxide and graphene oxide loaded with doxorubicin on human multiple myeloma cells. Int J Nanomedicine. 2014;9:1413.
18. Wang H, Gu W, Xiao N, Ye L, Xu Q. Chlorotoxin-conjugated graphene oxide for targeted delivery of an anticancer drug. Int J Nanomedicine. 2014;9:1433.
19. Liu K, Zhang J, Yang G, Wang C, Zhu JJ. Direct electrochemistry and electrocatalysis of hemoglobin based on poly (diallyldimethylammonium chloride) functionalized graphene sheets/room temperature ionic liquid composite film. Electrochem Commun. 2010;12(3):402–405. 20. Feng L, Zhang S, Liu Z. Graphene based gene transfection. Nanoscale.
2011;3(3):1252–1257.
21. Depan D, Shah J, Misra R. Controlled release of drug from folate-decorated and graphene mediated drug delivery system: synthesis, loading efficiency, and drug release response. Mater Sci Eng C. 2011;31(7):1305–1312. 22. Miao W, Shim G, Kang CM, et al. Cholesteryl hyaluronic acid-coated,
reduced graphene oxide nanosheets for anti-cancer drug delivery. Biomaterials. 2013;34(37):9638–9647.
23. Bai H, Xu Y, Zhao L, Li C, Shi G. Non-covalent functionalization of graphene sheets by sulfonated polyaniline. Chem Commun. 2009;(13): 1667–1669.
24. Chen J, Liu H, Zhao C, et al. One-step reduction and PEGylation of graphene oxide for photothermally controlled drug delivery. Biomateri-als. 2014;35(18):4986–4995.
25. Jeong H-K, Jin MH, An KH, Lee YH. Structural stability and vari-able dielectric constant in poly sodium 4-styrensulfonate intercalated graphite oxide. J Phys Chem C. 2009;113(30):13060–13064. 26. Lin L, Li M, Jiang L, et al. A novel iron (II) polyphthalocyanine
cata-lyst assembled on graphene with significantly enhanced performance for oxygen reduction reaction in alkaline medium. J Power Sources. 2014;268:269–278.
27. Li Y, Tang J, Huang L, et al. Facile preparation, characterization and performance of noncovalently functionalized graphene/epoxy nano-composites with poly(sodium 4-styrenesulfonate). Compos Pt A Appl Sci Manuf. 2015;68:1–9.
28. Luo J, Jiang S, Liu R, Zhang Y, Liu X. Synthesis of water dispersible polyaniline/poly(styrenesulfonic acid) modified graphene composite and its electrochemical properties. Electrochim Acta. 2013;96:103–109.
International Journal of Nanomedicine downloaded from https://www.dovepress.com/ by 118.70.13.36 on 23-Aug-2020
Dovepress
Wang et al
29. Chen M-L, He Y-J, Chen X-W, Wang J-H. Quantum-dot-conjugated graphene as a probe for simultaneous cancer-targeted fluorescent imag-ing, trackimag-ing, and monitoring drug delivery. Bioconjug Chem. 2013; 24(3):387–397.
30. Xu C, Yuan R-S, Wang X. Selective reduction of graphene oxide. New Carbon Mater. 2014;29(1):61–66.
31. Yang K, Wan J, Zhang S, Tian B, Zhang Y, Liu Z. The influence of surface chemistry and size of nanoscale graphene oxide on photothermal therapy of cancer using ultra-low laser power. Biomaterials. 2012;33(7): 2206–2214.
32. Hummers WS Jr, Offeman RE. Preparation of graphitic oxide. J Am Chem Soc. 1958;80(6):1339.
33. Liu K, Zhang J-J, Cheng F-F, Zheng T-T, Wang C, Zhu J-J. Green and facile synthesis of highly biocompatible graphene nanosheets and its application for cellular imaging and drug delivery. J Mater Chem. 2011;21(32):12034.
34. Yan W, Yu W-J, Wang L, et al. Preparation of partially reduced graphene oxide nanosheets/poly(sodium 4-styrenesulfonate) composite with high capacitance. Electrochim Acta. 2014;147:257–264.
35. Tran DNH, Kabiri S, Losic D. A green approach for the reduction of graphene oxide nanosheets using non-aromatic amino acids. Carbon. 2014;76:193–202.
36. Justin R, Chen B. Characterisation and drug release performance of biodegradable chitosan–graphene oxide nanocomposites. Carbohydr Polym. 2014;103:70–80.
37. Eda G, Chhowalla M. Chemically derived graphene oxide: towards large area thin film electronics and optoelectronics. Adv Mater. 2010; 22(22):2392–2415.
38. Li J, Miao D, Yang R, Qu L, Harrington PDB. Synthesis of poly(sodium 4-styrenesulfonate) functionalized graphene/cetyltrimethylammonium bromide (CTAB) nanocomposite and its application in electrochemical oxidation of 2,4-dichlorophenol. Electrochim Acta. 2014;125:1–8. 39. Liu Z, Duan X, Zhou X, Qian G, Zhou J, Yuan W. Controlling and
formation mechanism of oxygen-containing groups on graphite oxide. Ind Eng Chem Res. 2013;53(1):253–258.
40. Li L, Ma R, Iyi N, Ebina Y, Takada K, Sasaki T. Hollow nanoshell of layered double hydroxide. Chem Commun. 2006;29:3125–3127. 41. Chen D, Li L, Guo L. An environment-friendly preparation of reduced
graphene oxide nanosheets via amino acid. Nanotechnology. 2011; 22(32):325601.
42. Ferrari A, Meyer J, Scardaci V, et al. Raman spectrum of graphene and graphene layers. Phys Rev Lett. 2006;97(18):187401.
43. Wu H, Shi H, Wang Y, et al. Hyaluronic acid conjugated graphene oxide for targeted drug delivery. Carbon. 2014;69:379–389. 44. Liu Z, Sun X, Nakayama-Ratchford N, Dai H. Supramolecular
chem-istry on water-soluble carbon nanotubes for drug loading and delivery. ACS Nano. 2007;1(1):50–56.
45. Siegfried JM, Burke TG, Tritton TR. Cellular transport of anthracy-clines by passive diffusion: implications for drug resistance. Biochem Pharmacol. 1985;34(5):593–598.
46. Tang Y, Lei T, Manchanda R, et al. Simultaneous delivery of chemo-therapeutic and thermal-optical agents to cancer cells by a polymeric (PLGA) nanocarrier: an in vitro study. Pharm Res. 2010;27(10): 2242–2253.
47. Huang X, Zhuang J, Teng X, et al. The promotion of human malignant melanoma growth by mesoporous silica nanoparticles through decreased reactive oxygen species. Biomaterials. 2010;31(24):6142–6153. 48. Görlich D, Kutay U. Transport between the cell nucleus and the
cyto-plasm. Annu Rev Cell Dev Biol. 1999;15(1):607–660.
49. Dundr M, Misteli T. Functional architecture in the cell nucleus. Biochem J. 2001;356:297–310.
50. Sun W-L, Chen J, Wang Y-P, Zheng H. Autophagy protects breast can-cer cells from induced apoptosis and facilitates epirubicin-resistance development. Autophagy. 2011;7(9):1035–1044.
51. Chowdhury SM, Manepalli P, Sitharaman B. Graphene nanoribbons elicit cell specific uptake and delivery via activation of epidermal growth factor receptor enhanced by human papillomavirus E5 protein. Acta Biomater. 2014;10(10):4494–4504.
International Journal of Nanomedicine downloaded from https://www.dovepress.com/ by 118.70.13.36 on 23-Aug-2020
Dovepress Biobehavioral evaluation of partially reduced graphene oxide
Supplementary materials
+2 +2 +2
+2
+2 +2
2+ 2+
2+ 2
2 2 2
2 2
2 2
2
2
2 2+
2+
2+
2+
2+
2+
1++2UHIOX[K°&
366
366* *2
Figure S1 schematic illustration of the Pssg preparation with 12-hour reduction.
Abbreviations: gO, graphene oxide; Pssg, Pss-decorated nanographene; Pss, poly(sodium 4-styrenesulfonate); h, hours.
:DYHQXPEHUFP±
7UDQVPLWWDQFH
D E F
G ±&22+ &2&
Figure S2 FTIr spectral monitoring of the Pssg preparation at different reduction time.
Notes: spectra of Pssg were measured with 3-hour (a), 4-hour (b), and 12-hour (c) reduction, respectively. The characteristic peak at 1,735 cm–1 in carboxyl groups
disappeared in (c) only. gO (d) was used as control.
Abbreviations: FTIr, Fourier transform infrared; gO, graphene oxide; Pssg, Pss-decorated nanographene; Pss, poly(sodium 4-styrenesulfonate).
International Journal of Nanomedicine downloaded from https://www.dovepress.com/ by 118.70.13.36 on 23-Aug-2020
International Journal of Nanomedicine
Publish your work in this journal
Submit your manuscript here: http://www.dovepress.com/international-journal-of-nanomedicine-journal
The International Journal of Nanomedicine is an international, peer-reviewed journal focusing on the application of nanotechnology in diagnostics, therapeutics, and drug delivery systems throughout the biomedical field. This journal is indexed on PubMed Central, MedLine, CAS, SciSearch®, Current Contents®/Clinical Medicine,
Journal Citation Reports/Science Edition, EMBase, Scopus and the Elsevier Bibliographic databases. The manuscript management system is completely online and includes a very quick and fair peer-review system, which is all easy to use. Visit http://www.dovepress.com/ testimonials.php to read real quotes from published authors.
Dovepress
Dove
press
Wang et al
:DWHU S+ S+ S+ (WKDQRO
&DOLEUDWLRQVROXWLRQ
&RUUHFWLRQIDFWRU
5HODWLYHIOXRUHVFHQFH
RIZDWHU
Figure S4 Calibration of relative fluorescence intensity of EPI in different solvents.
Notes: To exclude the fluorescent quantum yields of EPI dissolved in ethanol and other buffer solutions, the released EPI from PSSG–EPI (20 μg/ml) in the supernatants
was also measured with a fluorescence spectrometer. EPI was dissolved at concentration of 20 μg/ml in water, ethanol, and buffer solutions with ph 7.4, 4.6, and 2.0. left Y-axis shows the relative fluorescence percentages of EPI in different solvents referring to the EPI in water (control group). Right Y-axis shows the corresponding correction factors of different solvents.
Abbreviations: ePI, epirubicin; Pssg, Pss-decorated nanographene; Pss, poly(sodium 4-styrenesulfonate).
&RQFHQWUDWLRQRI(3,JP/
)OXRUHVFHQFHLQWHQVLW\
\ [
5
Figure S3 Standard calibration curve of EPI fluorescence in water solutions.
Abbreviation: ePI, epirubicin.
International Journal of Nanomedicine downloaded from https://www.dovepress.com/ by 118.70.13.36 on 23-Aug-2020

![Figure 3 chemical characterizations of Pssg.Notes: (A) UV-vis absorbance spectra of Pssg (a), pure g ([b], gO directly reduced by hydrazine hydrate), gO (c) and Pss (d)](https://thumb-us.123doks.com/thumbv2/123dok_us/8275489.1376393/6.612.74.522.328.677/figure-chemical-characterizations-absorbance-spectra-directly-hydrazine-hydrate.webp)