1
Application of Poisson Autoregressive and Poisson Exponential Weighted Moving Average Models on the Prevalence of some Infectious Diseases in Jos, Nigeria.
Monday Osagie
1,2Adenomon & Esther Temidayo
1Fagbemi
1. Department of Statistics & NSUK-LISA Stat Lab Nasarawa State University, Keffi, Nigeria
2. Foundation of Laboratory for Econometrics and Applied Statistics of Nigeria (aka FOUND-LEAS-IN-NIGERIA)
[email protected]; [email protected]
Tel: +2347036990145; +2348133605036 2. https://orcid.org/0000-0002-9523-8032
Abstract
This research work examined the trend of HIV/AIDS, Tuberculosis, and Hepatitis diseases in Plateau state. Annual data from 2003 to 2018 was collected from the department of biostatistics at Plateau State Specialist Hospital (PSSH), Jos. The methods of analysis used are the Poisson Autoregressive Model (PAR(1)) and the Poisson Exponentially Weighted Moving Average Model (PEWMA). The results revealed a significant annual decrease of 23.9% and 4% in Tuberculosis and HIV/AIDS respectively. Furthermore, the results showed a significant annual increase of 46% in Hepatitis. The PEWMA model used revealed that TB increased by 0.02% when there is an increase in HIV but not significant, while Hepatitis significantly aggravates TB by at least 0.24%. Also, there is a significant rise in HIV by 0.85% when TB increases but Hepatitis has no such effect on HIV. Lastly, PEWMA model indicated a rise of 0.5% in Hepatitis cases when there is an increase in TB, but a surge in HIV has no such effect on Hepatitis cases in Jos. The study recommended that fight against TB should be intensified since TB cases significantly affect both HIV and Hepatitis in Jos, Nigeria.
Keywords: Tubercolusis (TB), Poisson Autoregressive (PAR), Poisson Exponentially
Weighted Moving Average Model (PEWMA), Hepatitis, Human Immunodeficiency Virus (HIV), Acquired Immune Deficiency Syndrome (AIDs).
1. Introduction
Hepatitis and Tuberculosis are the two most common co-infections in people infected with HIV/AIDS. Infection with hepatitis B (HBV) and hepatitis C viruses (HCV) are especially more
2
common and significant in HIV patients. (Padmapriyadarsini et al., 2006). Tuberculosis is the commonest coinfections amongst HIV/AIDS positive people in Nigeria. Globally, an estimated number of 1.4 million people are living with HIV/AIDS and also have TB, with 2-4 million living with both HIV/AIDS and HBV, likewise 4-5 million having HIV/AIDS and HCV coinfection (WHO, 2011). Disease such as tuberculosis, HIV/AIDs and Hepatitis falls into the class of epidemiology and number of affected patient do follow a counting process. Standard epidemiological and mathematical models have been proposed to studying disease dynamics; some of which can be implemented using deterministic or stochastic approaches. Most natural phenomenon such as disease dynamics are stochastic in nature and in view of that, studying them deterministically may not always be appropriate. The dynamics of such deterministic and stochastic models are described by system of differential equations which requires initial conditions of the disease states before modeling (Twumasi, 2018). Aalen et al (1997) anticipated the use of Markov modeling for HIV incidence taking into accounts the effect of HIV diagnosis and treatment in England and Wales. A major limitation of some Markov chain models is the problem of lack of memory or “memorylessness” (Twumasi, 2018). Verma et al (1983) estimated some epidemiological parameters of malaria transmission using stochastic process or first-order Markov chain from a longitudinal data.
The Poisson distribution is used to describe discrete quantitative data such as counts in which the population size n is large, the probability of an individual event is small, but the expected number of events, n, is moderate (say five or more).
3
were used to determine the trend of the diseases, the effect and relationship among the diseases under study.
2. Model Specification
A. Poisson Autoregressive Model PAR(p)
This is a model for count data. It is an autoregressive AR(p) model for event counts and it is constructed based on an approach similar to the PEWMA. Instead of employing the multiplicative transition equation used in the PEWMA model, one then replace the transition with a linear autoregressive process (AR(p)) of which this can be extended by Kalman filter for the PAR(p) and its likelihood function which are discussed in Grunwald et al (1997a) and Grunwald et al (1997b).
Consider Pr[yt|Yt-1] and that E[Y0] =µ < .
Let the conditional expectation E[yt|Yt-1] =mt at time t have a finite mean.
Then yt is a p–th order linear autoregressive process if
Where, pi and λ are any real numbers. This specification of a linear AR(p) process places
no restriction on the density Pr[yt|Yt-1]. The choice of this density for yt places constraints on
the admissible values of λ and p.
This can be generalized by
(2)
(3)
E[yt|Yt-1] = (1)
E [E[yt|Yt-1] ]=E[ ]
4 Noting that (3) is a geometric series for pi, then
(4)
Since E[Yt] = µ (by definition), equation (1) can be written as
(5)
This is a stationary linear AR(p) process.
This Poisson autoregressive or PAR(p) model can be defined as follows:
1.
Suppose that the observed event counts, yt for t=1,2,...,T are drawn from a Poisson distribution
conditional on mt with a prior, so
With mt-1= E[yt|Yt-1] and =Var[yt|Yt-1].
The prior is constructed using the observed data. The prior distribution follows a gamma distribution with mean mt-1 and variance. These computations demands filtering the data as
in the PEWMA model using equations (5),(6),and(7).
Since the prior is a gamma distribution, using an extended Kalman filter, the conditional distribution at t i m e t given t —1 is also gamma:
This provides an estimate of the posterior for time t:
= =
E[yt|Yt-1] = µ
Pr(yt/mt) = (6)
Pr[mt|Yt-1] = Γ( ) >O, >O, (7)
5
Where Γ(.) denotes the gamma function. This is a negative binomial
distribution. Based on this distribution, we can construct the log–likelihood for the PAR(p) as follows:
Substituting the linear AR (1) process for mt yields a PAR(1) model with a negative
binomial predictive distribution.
The one–step ahead conditional forecast function for the PAR(p) model is given as ,
The forecast variance is:
(8)
(mt-1, σt-1 yt,…, yT; Yt-1) = In
= (9)
6
· For the PAR(p), this derivative is
where the instantaneous (and long–run) estimated effect would be . Then the long run multiplier is
B. The Poisson Exponentially Weighted Moving Average Model (PEWMA)
To address the problem of modeling persistent time series event counts, one can use a structural time series model. In general, a structural time series model specifies two equations;
1) The measurement density or system equation and
2) The state density or transition equation to describe the evolution of a time series. The specification and estimation of the model is done using Kalman filter (Harvey 1989; Hamilton 1994).
= (11)
= (1- (12)
7
For event count data, specifying a structural time series is more problematic. To deal with such problems, the approach of Harvey and Fernandes (1989) can be adopted. They employ natural conjugate densities to simplify the development of the model and numerical calculation to specify a functional form as the likelihood function (Judge et.al (1988), DeGroot (1970)). Also see Gelman et al. (1995).
The Poisson-gamma exponentially weighted moving average model for count data (PEWMA) is built around the following three assumptions that characterize the mean and dynamics of the process.
1. measurement Equation: We assume the observed counts at time t are drawn from Poisson marginal distribution,
2. Transition Equation (Smith and Miller 1986; Shephard 1994).
(3)
Where ηt~ Beta (ωα t-1, (1- ω) at-1).
The parameter 0 < ω≤ 1, captures discounting of the observations in computing the mean and ηt
and rt parameterize the growth rate in period t. the beta distributed variable ηt captures the
proportional stochastic shift in the mean form t-1 to time t. From the properties of the beta distribution, E[ηt] = ωⱯ t. The parameter rt describes the growth in the series and insures that µt
> 0.
P
r(y
t/µ
t) =
(14)
8 3. Conjugate Prior: The gamma ƒ density is given by;
Where a = at-1, and µ= µ*t-1. These values are computed from the previous t-1 observations, Yt-1.
Application of PEWMA model can be seen in modeling political dynamics (Brandth et al. 2000) and modeling of human environmental interaction (Carleton et al. 2018) and in modeling infectious diseases of which this study falls into.
3. Method, Source and presentation of Data
For this research, dataset on HIV/AIDS, TB and Hepatitis was sourced from Plateau State Specialist Hospital (PSSH) Jos, Plateau State from 2003 to 2018. The data used in this research work is a secondary data presented below in Figures 1, 2 and 3.table 1 below.
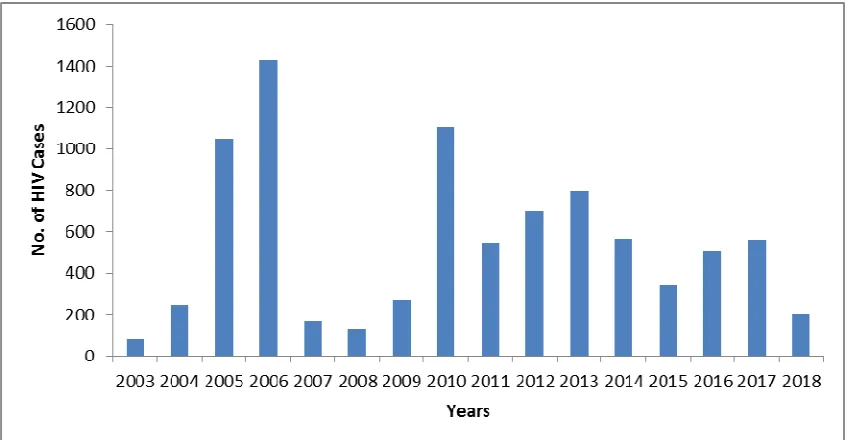
Fig. 1: Bar Chart on Annual Cases of HIV in Jos from 2003 to 2018
9
The Fig. 1 shows the distribution of HIV cases in Jos from 2003 to 2018. The highest case of HIV is recorded in 2006 while the lowest case of HIV is recorded in 2003.
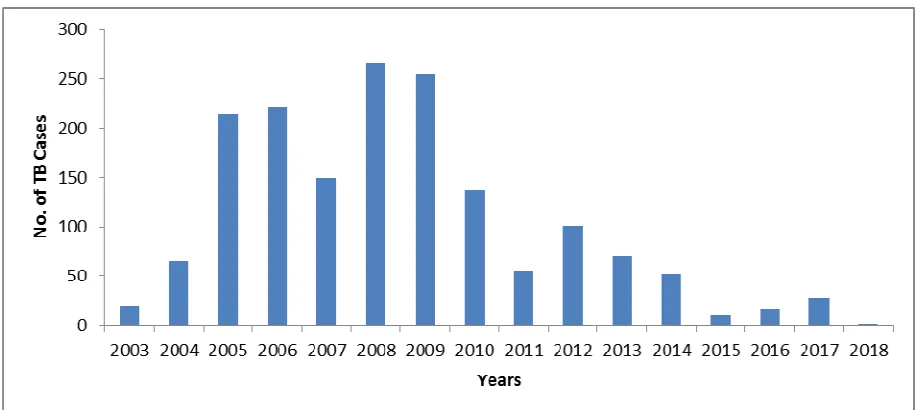
Fig. 2: Bar Chart on Annual Cases of TB in Jos from 2003 to 2018
10
Fig. 3: Bar Chart on Annual Cases of Hepatitis in Jos from 2003 to 2018
The Fig. 3 shows the distribution of Hepatitis cases in Jos from 2003 to 2018. The highest case of Hepatitis was recorded in 2017 while the lowest case of Hepatitis was recorded in 2003.
4. Data Analysis and Results
This section present results and interpretation of trend analysis using Poisson Autoregressive (PAR) model and the dynamic interrelationship among the infectious diseases using Poisson Exponential Weighted Moving Average (PEWMA) model.
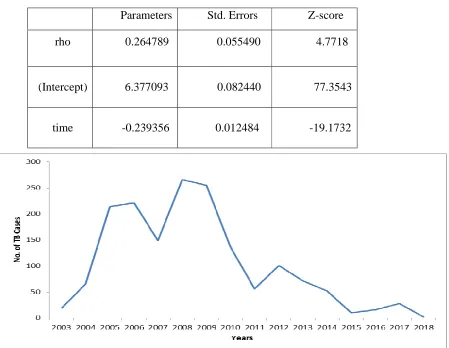
Table 1: Trend analysis of Tuberculosis using PAR(1)
Parameters Std. Errors Z-score
rho 0.264789 0.055490 4.7718
(Intercept) 6.377093 0.082440 77.3543
11
Fig 4: Graphical representation of TB Cases in Jos from 2003 to 2018.
From Table 1 above present the result from PAR(1) of TB cases which shows a significant annual decrease of 23.9% in tuberculosis cases in Plateau State Specialist Hospital, Jos from 2003 to 2018, (|Z-score|= 19.17>1.96). This result is further amplified by Fig 4 above. In addition, the intercept and the autoregressive coefficient are significant in the PAR model.
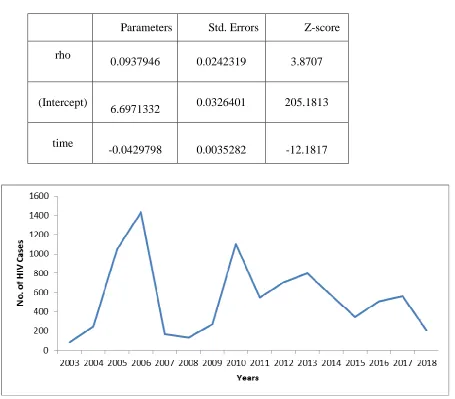
Table 2: Trend analysis of HIV using PAR(1)
Fig 5: Graphical representation of HIV Cases in Jos from 2003 to 2018. Parameters Std. Errors Z-score rho
0.0937946 0.0242319 3.8707
(Intercept)
6.6971332 0.0326401 205.1813
time
12
From Table 2 above presented the result from PAR(1) of HIV cases which shows a significant annual decrease of 4% in HIV cases in Plateau State Specialist Hospital, Jos from 2003 to 2018 (|Z-score|= 12.18>1.96). This is result is further amplified in Fig 5 above. In addition, the intercept and the autoregressive coefficient are significant in the PAR(1) model.
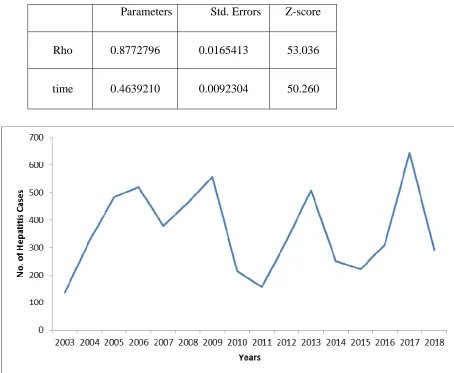
Table 3: Trend analysis of Hepatitis using PAR(1)
Fig 6: Graphical representation of Hepatitis Cases in Jos from 2003 to 2018. Parameters Std. Errors Z-score
Rho 0.8772796 0.0165413 53.036
13
The Table 3 above presented the result from PAR(1) model of Hepatitis which shows an annual increase of 46% in Hepatitis cases in Plateau State Specialist Hospital, Jos from 2003 to 2018 which is very significant (|Z-score| = 50.26 > 1.96). This result is amplified by fig 6 above.
Table 4.: Effect of HIV and Hepatitis on Tuberculosis using PEWMA
Parameters Std. Errors Z-Score Omega
0.05710687 0.01889756 3.0219 Time
-0.01451032 0.10132390 -0.1432 HIV/AIDS
0.00021422 0.00014316 1.4964 HPT
0.00244513 0.00058743 4.1624
The Table 4 above presented the dynamics of the effects of time, HIV and Hepatitis on TB cases using the PEWMA. The results shows negative trend of 1.4% in tuberculosis cases in Plateau State Specialist Hospital, Jos from 2003 to 2018, although not significant (|Z-score|= 0.14<1.96). Furthermore, there was increase in TB cases by 0.02% when there is an increase in HIV, although not significant (|Z-score|= 1.496<1.96), likewise there was a significant increase in TB cases by 0.24% when there is increase in Hepatitis cases (Z-score= 4.16>1.96).
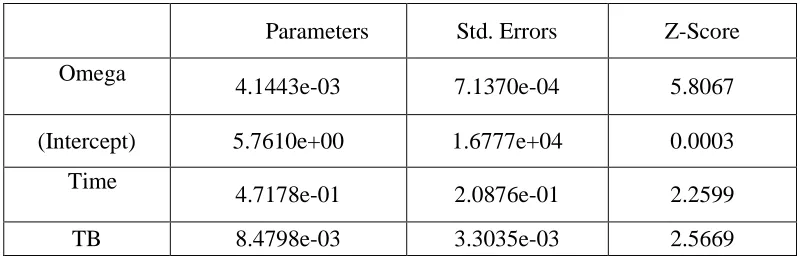
Table 5: Effect of TB and Hepatitis cases on HIV using PEWMA
Parameters Std. Errors Z-Score Omega
4.1443e-03 7.1370e-04 5.8067
(Intercept) 5.7610e+00 1.6777e+04 0.0003
Time
4.7178e-01 2.0876e-01 2.2599
14
HPT -1.5550e-03 1.1706e-03 -1.3284
The Table 5 shows positive significant trend of 47.2% in HIV cases in Plateau State Specialist Hospital, Jos from 2003 to 2018 (|Z-score|= 2.26>1.96). There was a significant increase in HIV cases by 0.85% when there is an increase in TB (|Z-score|= 2.57>1.96), likewise a negative relationship exists with HIV by 0.16% when there is increase in Hepatitis cases although not significant (|Z-score|= 1.3284<1.96).
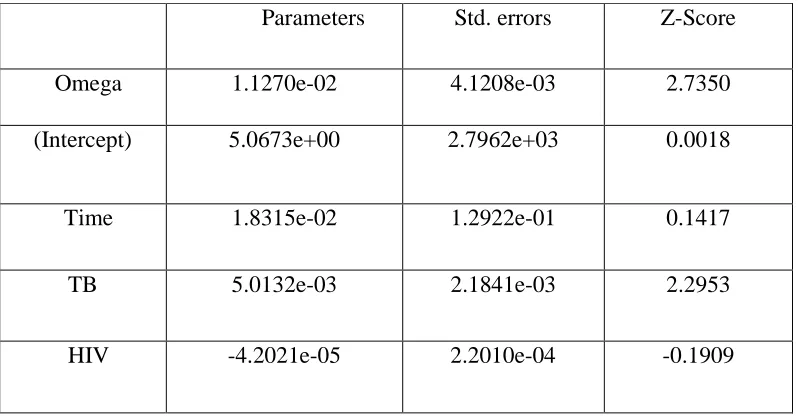
Table 6: Effect of HIV and TB cases on Hepatitis using PEWMA
Parameters Std. errors Z-Score
Omega 1.1270e-02 4.1208e-03 2.7350
(Intercept) 5.0673e+00 2.7962e+03 0.0018
Time 1.8315e-02 1.2922e-01 0.1417
TB 5.0132e-03 2.1841e-03 2.2953
HIV -4.2021e-05 2.2010e-04 -0.1909
15
5. Discussion of Results
The trend analysis from PAR(1) model shows a significant annual decrease of 23.9% in tuberculosis cases (|Z-score|= 19.17>1.96) in Plateau State Specialist Hospital, Jos from 2003 to 2018. This agrees with WHO Global TB report, 2017 which indicated that TB globally is dropping at about 2% per year. Similarly, the result from PAR(1) shows a significant annual decrease of 4% in HIV cases in Plateau State Specialist Hospital, Jos from 2003 to 2018 (|Z-score|= 12.18>1.96). This is also in line with UNAIDS 2014 Global Report on AIDS with 3.2% decline and Nigeria National HIV/AIDS Indicator and Impact Survey (NAIIS) 2018 which showed a decrease of 1.4% in prevalence rate. Also the result from PAR(1) shows an annual increase of 46% in Hepatitis cases in Plateau State Specialist Hospital, Jos from 2003 to 2018 which is very significant (Z-score = 50.26 > 1.96). This is contrary to research work by Musa et al (2015) which suggested a sustained decline in the prevalence of hepatitis.
The PEWMA model used revealed that TB increased by 0.02% when there is an increase in HIV but not significant, while Hepatitis significantly aggravates TB by at least 0.24%. Also, there is a significant rise in HIV by 0.85% when TB increases but Hepatitis has no such effect on HIV. Lastly, PEWMA model indicated a rise of 0.5% in Hepatitis cases when there is an increase in TB, but a surge in HIV has no such effect on Hepatitis cases in Jos. These results are similar to the study of Sama et al. (2017).
6. Conclusion and Recommendations
16
in Hepatitis cases in Jos. Lastly Hepatitis cases significantly affect TB patient, TB cases significantly affects HIV patients and TB cases significantly affect Hepatitis patient.
Based on the findings, the following is recommended;
1. Since Hepatitis rate isn’t declining as reflected in the data set, the government and stakeholders in the health sector should create enlightenment campaigns on vaccination and possible preventive measures.
2. Fight against TB should be intensified since TB cases significantly affect both HIV and Hepatitis in Jos.
3. Fight against HIV should be maintain to ensure permanent reduction in the cases of HIV in Jos, Nigeria.
References
Aalen, O. O., Farewell, V. T., De Angelis, D., Day, N. E., & Gill, O. N. (1997). A Markov Model for HIV Disease Progression including the effect of HIV diagnosis and treatment: Application To AIDS Prediction In England And Wales. Statistics in Medicine, 16(19), 21912210. Retrieved from http://www.ncbi.nlm.nih.gov/pubmed/9330428
Brandt PT, Williams JT, Fordham BO, Pollins B.( 2000): Dynamic Modeling for Persistent Event-Count Time Series. Am J Polit Sci., 44: 823–843. https://doi.org/10.2307/2669284
Carleton, W. C., Campbell, D. & Collard, M. (2018): Radiocarbon dating uncertainty and the reliability of the PEWMA method of time- series analysis for research on long-term human-environment interaction. PLoS ONE 13(1): e0191055. https://doi.org/10.1371/journal. pone.0191055
Chib, S. and Winkelmann, R. (2001). Markov chain Monte Carlo analysis of correlated count data. Journal of Business & Economic Statistics 19(4), 428–435.
17
Fahimeh, B. A., Ehsan, M. and Ali M. (2016). HIV, HBV and HCV Coinfection Prevalence in Iran - A Systematic Review and Meta-Analysis,5PLOS ONE | DOI:10.1371/journal.pone.0151946
Fauci, A.S. and Folkers, G. K. (2012). Toward an AIDS-free generation. Jama 308: 343–344. Grunwald, G.K., Hamza K., R.J Hyndman.(1997a). "Some Properties and Generalization of
Non-negative Bayesian Time Series Models." Journal of the Royal Statistical Society, Series B59(3):615-626
Grunwald, G.K., Hyndman R.J., Tedesco L., and Tweedis R.L. (1997b). "A unified view of linear AR(1) models." Monash University.
Hamilton J.D. 1994. Time Series Analysis. Princeton:Princeton University Press. Harvey A.C. 1989. Forecasting, structural time series models and the Kalman filter.
Cambridge:Cambridge University Press
Harvey A.C., and Fernandes C.1989. "Time Series Models for Count or Qualitative Observations." Journal of Business and Economic Statistics 7(4): 407-417
Javadi, A., Ataei, B., Kassaian, N., Nokhodian, Z and Yaran, M (2014). Co-infection of human immunodeficiency virus, hepatitis C and hepatitis B virus among injection drug users in Drop in centers. Journal of research in medical sciences: 19:17.
Judge G.G., Hill R.C., William E.G., Helmut L., and Lee T.C. (1988). Introduction to the Theory and Practice of Econometrics, 2nd Ed. New York: John Wiley.
Mallory, K. F., Churchyard, G.J., Kleinschmidt, I., De Cock, K. M. and Corbett, E.L. (2000). The impact of HIV infection on recurrence of tuberculosis in South African gold miners. Int J Tuberc Lung Dis;4(5):455–462.
Musa B, Bussell S, Borodo M M, Samaila A A, Femi O L. (2015): Prevalence of hepatitis B virus infection in Nigeria, 2000-2013: A systematic review and meta-analysis. Niger J Clin Pract ;18:163-72. Available
from: http://www.njcponline.com/text.asp?2015/18/2/163/151035
Omonkhelin, J. and Owolabi, E.A.G. (2010). A review of viral hepatitis in HIV positive patients using UBTH as a case study. African Journal of Health Sciences, 17: 3-4.
18
Sama LF, Nganou Djinou OI, Wam EC, Bamou R, Ali IM, et al. (2017): Sero-prevalence of Hepatitis B and C virus and High Risk of Hepatotoxicity among TB/HIV Positive and HIV Negative Population in Western Cameroon. Glob J Infect Dis Clin Res 3(1): 001 -008. DOI: http://doi.org/10.17352/2455-5363.000011
Twumasi, C. (2018). Markov Chain Modelling of HIV, Tuberculosis and Hepatitis-B Transmission: A study of a Regional Hospital in Ghana.
UNAIDS (2014). Islamic Republic of Iran AIDS Progress Report On Monitoring of the United Nations General Assembly Special Session on HIV and AIDS.
Verma, B. L., Ray S. K., & Srivastava, R. N. (1983). A stochastic model of malaria transition rates from longitudinal data: considering the risk of lost to follow-up. J Epidemiol Community Health, 37:153-156.
World Health Organization (2011). Stop TB Department. Global Tuberculosis Control. WHO Report. Geneva, Switzerland. 262pp.