Volume 6, No. 8, Nov-Dec 2015
International Journal of Advanced Research in Computer Science
RESEARCH PAPER
Available Online at www.ijarcs.info
ISSN No. 0976-5697
Layered approach for Intrusion Detection using PSO
B. Ben Sujitha Associate Professor, Department of CSE, Ponjesly College of Engineering,
Nagercoil, India
Dr.V.Kavitha Associate Professor, Department of CSE, University College of Engineering,
Kanchipuram India
Abstract: Intrusion Detection Systems (IDS) is a key part of system defense, where it identifies abnormal activities happening in a computer system. Intrusion detection system (IDS) provides a layer that monitors the network traffic for predefined suspicious patterns and inform about the unauthorized activity. In this paper, we address the effective feature selection method and combined with the layered approach. To safeguard the networks from known vulnerabilities and at the same time take steps to detect new and unseen, but possible, system abuses by developing more reliable and efficient intrusion detection systems. Any intrusion detection system has some inherent requirements. Its prime purpose is to detect as many attacks as possible with minimum number of false alarms, i.e., the system must be accurate in detecting attacks. However, an accurate system that cannot handle large amount of network traffic and is slow in decision making will not fulfill the purpose of an intrusion detection system. We desire a system that detects most of the attacks, gives very few false alarms, copes with large amount of data, and is fast enough to make real-time decisions.
Keywords: feature, Particle, Optimization, attack.
1. INTRODUCTION
The information communication infrastructure has highly improved the lives of modern society. However, this infrastructure is always under the threats of intrusion and misuse. In order to prevent such threats the research and industry community have come up with different threat detection and prevention technologies. One of such technologies is Intrusion Detection Systems (IDS). An intrusion detection system monitors and analyzes the events occurring in a computer system or network environment and alerts a human operator to the presence of possible incidents that violate standard security practices [1]. Based on the deployment area intrusion detection technologies could be categorized as Host-based IDS (deployed at individual computers) or Network-based IDS (deployed at network level). According to the methods used for analyzing the collected data, IDS can also be categorized into two broad categories: Misuse based detection and anomaly based detection.
Misuse based (signature based) intrusion detection system tries to detect malicious activities based on patterns or signatures of known attacks. If a pattern match is detected, an alarm is reported to the network administrator. Since misuse based detection system is specifically designed for detecting known attacks, it generates low number of false alarms. However, misuse based intrusion detection systems could not detect novel attacks [2]. Anomaly based intrusion detection refers to identifying events that are anomalous with respect to the normal system behavior. If the incoming network traffic patterns do not follow the normal network traffic behavior, an alarm will be reported and such patterns are called anomalies or outliers [2]. Despite their capability in detecting novel attacks anomaly based intrusion detection systems suffer from high false positive rate.
2 FEATURE SELECTION
Feature selection is the most critical step in building intrusion detection models [3], [4], [5]. During this step, the set of attributes or features deemed to be the most effective attributes is extracted in order to construct suitable detection algorithms (detectors). A key problem that many researchers face is how to choose the optimal set of features, as not all features are relevant to the learning algorithm, and in some cases, irrelevant and redundant features can introduce noisy data that distract the learning algorithm, severely degrading the accuracy of the detector and causing slow training and testing processes. Feature selection was proven to have a significant impact on the performance of the classifiers. So we have observed , particle swarm optimization technique for feature selection is good and provides in the reduction of feature .
2.1. Particle Swarm Optimization (PSO)
topological neighbours, the best value is a global best and is called ggood.In this concept ,at each time step changing the velocity of (accelerating) each particle toward its pgood and lbes t locations. Consider Swarm of particles is flying through the parameter space and searching for optimum. Each particle is characterized by Position vector (xi (t) ) and Velocity vector (vi (t) )
During the process, each particle will have its individual knowledge pgood, i.e.,its own best-so-far in the position and social knowledge ggood i.e., pgood of its best neighbour. the velocity will be updated using the formula(1).Thus particles have a tendency to fly towards the better and better search area over the course of search process [41]. The calculation of velocity is:
𝑉𝑉𝑖𝑖(𝑡𝑡+ 1) =𝛼𝛼𝑉𝑉𝑖𝑖+ 𝐶𝐶1 𝑥𝑥 𝑟𝑟𝑟𝑟𝑟𝑟𝑟𝑟 𝑥𝑥 �𝑝𝑝𝑝𝑝𝑝𝑝𝑝𝑝𝑡𝑡(𝑡𝑡)− 𝑥𝑥𝑖𝑖(𝑡𝑡)�
+𝐶𝐶2 𝑥𝑥 𝑟𝑟𝑟𝑟𝑟𝑟𝑟𝑟 𝑥𝑥 �𝑔𝑔𝑝𝑝𝑝𝑝𝑝𝑝𝑡𝑡(𝑡𝑡)− 𝑥𝑥𝑖𝑖(𝑡𝑡)� (1)
where α is the inertia weight that controls the exploration and
exploitation of thesearch space c1 and c2, the cognition and social components respectively are the acceleration constants which changes the velocity of a particle towards the pgood and ggood. randis a random number between 0 and 1. Usually c1 and c2 values areset to 2. Performing the position update using eq .(2),
𝑋𝑋𝑖𝑖𝑟𝑟 =𝑋𝑋𝑖𝑖𝑟𝑟 +𝑉𝑉𝑖𝑖𝑟𝑟 (2)
Even though PSO is an efficient method to do the feature selection it has drawback.
1. The method suffers from the partial optimism, which leads for the less exact at the regulation of its speed and the direction. 2. The method cannot work out the problems of scattering. 3. The method cannot work out the problems of non-coordinate
system. To overcome the drawback multi objective PSO algorithm is used.
Three pre-processing stages are
1. Convert Symbolic features to numeric value.
2. Convert Attack names to its category, 0 for Normal, 1 for DoS (Denial of service) , 2 for U2R (user-to-root), 3 for R2L (remote-to-local) and 4 for Probe.
3. Normalize the features values, since the data have significantly varying resolution and ranges. The features values are scaled to the range [0, 1], using the following equation:
𝑋𝑋𝑟𝑟=𝑋𝑋𝑋𝑋 − 𝑋𝑋𝑚𝑚𝑖𝑖𝑟𝑟
𝑚𝑚𝑟𝑟𝑥𝑥 − 𝑋𝑋𝑚𝑚𝑖𝑖𝑟𝑟 −1 (3)
Where 𝑋𝑋𝑚𝑚𝑟𝑟𝑥𝑥,𝑋𝑋𝑚𝑚𝑖𝑖𝑟𝑟 are the minimum and maximum value of a specific feature . 𝑋𝑋𝑟𝑟is a normalized output.The algorithm is initialized with a random population (swarm) of individuals (particle) , where each particle of the swarm represents a candidate solution in the d- dimensional search space. To find the best solution, each particle changes its searching direction according to: the best previous position of its individual memory (pgood) , represented by Pi = (Pi1, Pi2 ,… Pid); the global best position gained by the swarm ( ggood) Gi = (Gi1, Gi2 ,… Gid)nn
The d- dimensional position for the particle i at iteration t can be represented as:
𝑥𝑥𝑖𝑖𝑡𝑡 =𝑥𝑥𝑖𝑖𝑡𝑡1,𝑥𝑥𝑖𝑖𝑡𝑡2, . .𝑥𝑥𝑖𝑖𝑟𝑟𝑡𝑡 ` (4)
While the velocity ( the rate of the position change) for the particle i at iteration t is given by
𝑉𝑉𝑖𝑖𝑡𝑡=𝑉𝑉𝑖𝑖𝑡𝑡1,𝑉𝑉𝑖𝑖𝑡𝑡2, . .𝑉𝑉𝑖𝑖𝑟𝑟𝑡𝑡` (5)
All of the particles have function have fitness values, which are evaluated based on a function as in eq (6):
Fitness = 𝛼𝛼.𝛾𝛾𝛾𝛾(𝐷𝐷) +𝛽𝛽|𝐶𝐶|+|𝛾𝛾|
|𝐶𝐶| (6)
Where 𝛾𝛾𝛾𝛾(𝐷𝐷) is the classification quality of condition attribute set R relative to decision D and |𝛾𝛾| is the length of selected feature subset.|𝐶𝐶|is the total number of features. While , the subset parameters α and β are correspond to the importance of classification quality and subset length.
α=[0,1]and β=[1− 𝛼𝛼].
2.2. IEM Discretization Phase
Discretization is a process of converting the continuousspace of feature into a nominal space [8]. The goal ofdiscretization process is to find a set of cut points, thesecut points partition the range into a small number ofintervals [9].In this model, the 11 features output from the PSOwhere discretised by the Information EntropyMinimization (IEM) discretization method.
Let T partition set S into subsets S1 and S2, for k classesC1, ...,Ckthe class entropy of a subset S is given by
𝐸𝐸𝑟𝑟𝑡𝑡 (𝑆𝑆) = − � 𝑃𝑃(𝐶𝐶𝑖𝑖,𝑆𝑆) log�𝑃𝑃(𝐶𝐶𝑖𝑖,𝑆𝑆)� (7) 𝑘𝑘
𝑖𝑖=1
Where 𝑃𝑃(𝐶𝐶𝑖𝑖,𝑆𝑆) is the proportion of examples in S that have class Ci. For an attribute A , the class information entropy of the partition induced by partition T is define as
E(A,T,S) = |𝑆𝑆1|
|𝑆𝑆|Ent(S1) + |𝑆𝑆2|
|𝑆𝑆|Ent(S2) (8)
2.3.F-score
F-score is a simple technique which measures the discrimination of two sets of real numbers. Given training vectors Xk, k = 1.2,…,m, if the number of positive and
negative instances are n+ and n−, respectively, then the F -score of the ith feature is defined as follows[10]:
𝐹𝐹𝑖𝑖 =
∑𝑙𝑙𝑗𝑗=1(𝑥𝑥̅𝑖𝑖(𝑗𝑗)−𝑥𝑥̅𝑖𝑖)2
∑ 𝑟𝑟 𝑗𝑗 −11∑𝑟𝑟 𝑗𝑗 (𝑥𝑥𝑘𝑘(𝑗𝑗,1)−𝑥𝑥𝑖𝑖(𝑗𝑗))2 𝑘𝑘=1
𝑙𝑙 𝑗𝑗=1
(9)
Where 𝑥𝑥̅𝑖𝑖,𝑥𝑥̅𝑖𝑖(𝑗𝑗) are the average of the ith feature of the whole dataset and the jth data set respectively . 𝑥𝑥𝑘𝑘(𝑗𝑗,1)is the ith feature of the kth instance in the jth dataset . From the observation of the result it is found the feature is discriminative if the F value is larger. F score is used to calculate the score of each attribute in order to get the weights of the features according to equation (10) is responsible for calculating the scores of the feature masks . ifthe ith feature is selected (“1” represents that feature i is selected and “0” represents that feature i is not selected. FS(i) equals the instance of feature i, otherwise FS(i) equals 0.
FS(i)=�𝑖𝑖𝑟𝑟𝑝𝑝𝑡𝑡𝑟𝑟𝑟𝑟𝑎𝑎𝑝𝑝 𝑖𝑖 ,𝑖𝑖𝑖𝑖 𝑖𝑖 𝑖𝑖𝑝𝑝 𝑝𝑝𝑝𝑝𝑙𝑙𝑝𝑝𝑎𝑎𝑡𝑡𝑝𝑝𝑟𝑟
Objective function is the evaluation criteria for the selected features. To get accuracy rate, we need to train and test the dataset according to the selected features.
Fitness i =𝜃𝜃𝑟𝑟 𝑋𝑋 𝑟𝑟𝑎𝑎𝑎𝑎𝑐𝑐𝑟𝑟𝑟𝑟𝑎𝑎𝑐𝑐𝑖𝑖 +𝜃𝜃𝑝𝑝𝑋𝑋 �
∑𝑁𝑁𝑝𝑝𝑗𝑗=1𝐹𝐹(𝐹𝐹𝑆𝑆(𝑖𝑖))
∑𝑁𝑁𝑝𝑝𝑘𝑘=1𝐹𝐹(𝑘𝑘) � (11)
∑𝑵𝑵𝒃𝒃 𝑭𝑭(𝒌𝒌)
𝒌𝒌=𝟏𝟏 and∑𝑁𝑁𝑗𝑗=1𝑝𝑝 𝐹𝐹(𝐹𝐹𝑆𝑆(𝑖𝑖))
the fitness of individual feature was obtained and thus that feature can be decided to be added or removed from the feature subset used.
In Eq. (11), θais the weight for SVM classification accuracy
rate, accuracyithe classification accuracy rate for the selected
features, θbthe weight for the score of selected features,
F(FS(i)) the function for calculating the score of the current features, and the total score of the selected features and all features.However, most existing feature selection algorithms
treat the task as a single objective problem. MSPSO is
proposed, which holds a number of swarms scheduled by the multi-swarm schedulingmodule. Each swarm controls its iteration procedure, position updates, velocity updates, and other parameters respectively. The scheduling module monitors all the sub-swarms and gathers the results from the sub-swarms. Each sub-swarm contains a number of particles. The multi-swarm scheduler can send commands or data to sub-swarms, and vice versa.
(1) The swarm request rule: If the current sub-swarm meets the condition according to Eq. (12), it sends the results which correspondpgoodand ggoodvalues to the multi-swarm scheduler. If Si = 1, the current swarm sends records which contain the pgoodand ggoodvalues, otherwise the current swarm does not send the results
Si=�
1,𝑖𝑖𝑖𝑖 𝑟𝑟𝑖𝑖 <𝑡𝑡𝑖𝑖𝑡𝑡𝑡𝑡𝑖𝑖𝑡𝑡𝑖𝑖−𝑖𝑖𝑡𝑡𝑖𝑖 𝑖𝑖𝑥𝑥 𝑟𝑟𝑟𝑟𝑟𝑟𝑟𝑟()𝑥𝑥 𝐹𝐹𝑖𝑖𝑡𝑡ness
0, 𝑖𝑖𝑖𝑖 𝑟𝑟𝑖𝑖 ≥𝑡𝑡𝑖𝑖𝑡𝑡𝑡𝑡𝑖𝑖𝑡𝑡𝑖𝑖−𝑖𝑖𝑡𝑡𝑖𝑖 𝑖𝑖 𝑥𝑥 𝑟𝑟𝑟𝑟𝑟𝑟𝑟𝑟()𝑥𝑥 𝐹𝐹𝑖𝑖𝑡𝑡ness
(12)
In Eq. (12), direpresents a threshold, tit isthe maximal iteration
number, it is the current iteration number and rand( ) is a random number uniformly distributed in U (0, 1).
(2) The multi-swarm scheduler request rule: The multi-swarm scheduler monitors each subswarm, and sends a request in order to obtain a result from current sub-swarm when the current sub-swarm is valuable. If sub-swarm has sent the swarm request rules more than k × n times, where k = 3, n = 1, 2, 3, ... ,100, the multi-swarm scheduler will send the r1ule. The multi-swarm scheduler request rule is touched off according to evaluating the activity level of the current sub-swarm.
(3) The multi-swarm collection rule :The multi-swarm scheduler collects results from the alive sub-swarm and updates pgood and ggoodfrom storage table.
(4) The multi-swarm destroying rule:
a. If the swarm sends the swarm request rule k times and k <fi according to Eq. (13), then the multi-swarm scheduler destroys the current sub-swarm.
b. If the swarm does not change the ggoodin pniterations, then the
multi-swarm scheduler destroys the current sub-swarm. We set pnin the initialization of PSO.
𝑖𝑖𝑖𝑖 =∑ 𝑖𝑖𝑡𝑡𝑝𝑝(𝑙𝑙)𝑋𝑋 𝑚𝑚 𝑟𝑟
𝑙𝑙=1
𝑝𝑝𝑙𝑙 (13)
In Eq. (13), ite( ) is the function for calculating how many times the sub-swarm sends swarm request rule, m a threshold, plthe alive sub-swarm size.
3. LAYERED APPROACH FOR INTRUSION
DETECTION
The reason to use the layered approach is to reduce computation and the overall time required to detect anomalous events. This can be achieved by making the layers autonomous and self-sufficient to block an attack without the need of a central decision-maker. Every layer in the LIDS[10] framework is trained separately and then deployed sequentially. We define four layers that correspond to the four attack groups mentioned in the data set as given in table 1 .They are Probe layer, DoS layer, R2L layer, and U2R layer. Each layer is then separately trained with a small set of relevant features. Feature selection is significant for Layered Approach and discussed in the previous section. The layers essentially act as filters that block any anomalous connection, thereby eliminating the need of further processing at subsequent layers enabling quick response to intrusion. The effect of such a sequence of layers is that the anomalous events are identified and blocked as soon as they are detected. Our second goal is to improve the speed of operation of the system. Hence, we implement the LIDS and select a small set of features for every layer rather than using all the41 features. This results in significant performance improvement during both the training and the testing of the system.
3.1. INTEGRATING LAYERED APPROACH WITH PSO
In Section 1, we discussed two main requirements for an intrusion detection system; accuracy of detection and efficiency in operation. As discussed in Sections 2 , the PSO can be effective in improving the attack detection accuracy by reducing the number of false alarms, while the Layered Approach can be implemented to improve the overall system efficiency. Hence, a natural choice is to integrate them to build a single system that is accurate in detecting attacks and efficient in operation. Given the data, we first select four layers corresponding to the four attack groups (Probe, DoS, R2L, and U2R) and perform feature selection for each layer, which is described next.
3.1.1 Feature Selection
Ideally, we would like to perform feature selection automatically. In this section, we describe our approach for selecting features for every layer and why some features were chosen over others. In our system, every layer is separately trained to detect a single type of attack category. We observe that the attack groups are different in their impact, and hence, it becomes necessary to treat them differently. Hence, we select features for each layer based upon the type of attacks that the layer is trained to detect.
3.1.2 Probe Layer
“numberof files accessed” are not expected to provide information for detecting probes.
3.1.3 DoS Layer
The DoS attacks are meant to force the target to stop the service(s) that is (are) provided by flooding it with illegitimate requests. Hence, for the DoS layer, traffic features such as the “percentage of connections having same destination host and same service” and packet level features such as the “source bytes” and “percentage of packets with errors” are significant. To detect DoS attacks, it may not be important to know whether a user is “logged in or not.”
3.1.4 R2L Layer
The R2L attacks are one of the most difficult to detect as they involve the network level and the host level features. We therefore selected both the network level features such as the “duration of connection” and “service requested” and the host level features such as the “number of failed login attempts” among others for detecting R2L attacks.
3.1.5 U2R Layer
The U2R attacks involve the semantic details that are very difficult to capture at an early stage. Such attacks are often content based and target an application. Hence, for U2Rattacks, we selected features such as “number of file creations” and “number of shell prompts invoked,” while we ignored features such as “protocol” and “source bytes.”We used domain knowledge together with the practical significance and the feasibility of each feature before selecting it for a particular layer. Thus, from the total 41 features, we selected only 5 features for Probe layer,9 features for DoS layer, 14 features for R2L layer, and 8 features for U2R layer.
We now give the algorithm for integrating PSO with the Layered Approach.
Algorithm Training
Step 1: Select the number of layers, n, for the complete system.
Step 2: Separately perform features selection for each layer. Step 3: Train a separate model with PSO for each layer using the features selected from Step 2.
Step 4: Plug in the trained models sequentially such that only the connections labeled as normal are passed
to the next layer.
Testing
Step 5: For each (next) test instance perform Steps 6through 9.
Step 6: Test the instance and label it either as attack or normal.
Step 7: If the instance is labeled as attack, block it and identify it as an attack represented by the layer
name at which it is detected and go to Step 5Else pass the sequence to the next layer.
Step 8: If the current layer is not the last layer in the system, test the instance and go to Step 7. Else go to Step 9.
Step 9: Test the instance and label it either as normal or as an attack. If the instance is labeled as an attack, block it and identify it as an attack corresponding to the layer name.
Our final goal is to improve both the attack detection accuracy and the efficiency of the system. Hence, we integrate the PSO and the Layered Approach to build a single system. We perform detailed experiments and show that our integrated system has dual advantage. First, as expected, the
efficiency of the system increases significantly. Second, since we select significant features for each layer, the accuracy of the system further increases. This is because all the 41 features are not required for detecting attacks belonging to a particular attack group. Using more features than required can result in fitting irregularities in the data, which has a negative effect on the attack detection accuracy of the system.
4 EXPERIMENTS
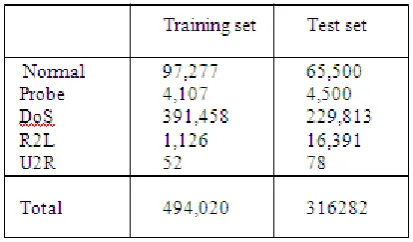
[image:4.595.314.521.435.556.2]For our experiments, we use the benchmark KDD ’99intrusion data set [6]. This data set is a version of the original1998 DARPA intrusion detection evaluation program, which is prepared and managed by the MIT Lincoln Laboratory. The data set contains about five million connection records as the training data and about two million connection records as the test data. In our experiments, we use10 percent of the total training data and 10 percent of the test data (with corrected labels), which are provided separately. This leads to 494,020 training and 311,029 test instances. Each record in the data set represents a connection between two IP addresses, starting and ending at some well defined times with a well-defined protocol. Further, every record is represented by 41 different features. Each record represents a separate connection and is hence considered to be independent of any other record. The training data is either labeled as normal or as one of the 24 different kinds of attack. These 24 attacks can be grouped into four classes; Probing, DoS, R2L, and U2R.Similarly, the test data is also labeled as either normal or as one of the attacks belonging to the four attack groups Table 1gives the number of instances for each group of attack in the data set.
Table 1: Dataset taken for experiment
system. However, if the DoS attacks are detected as Probe, it must be considered as an advantage since the attack is detected at an early stage. Similarly, if some Probe attacks are not detected at the Probe layer; they may be detected at subsequent layers. Hence, for four attack classes, we have four independent models, which are trained separately with specific features to detect attacks belonging to that particular group. For our experiments, we report the best, the average, and the worst cases.
Table 2. Detection rate
DoS Probe U2R R2L
PSO with layered
98.0 89.8 89 50
Multi-SVM 96.8 75 5.3 4.2
PN rule 96.9 73.2 6.6 10.7
Layered CRF
97.4 98.6 86.3 29.6
PSO with SVM
97.9 98.6 68.9 19.5
Table 3. False Alarm rate
DoS Probe U2R R2L
PSO with layered
0.06 6.05 0.032 0.6
Multi-SVM 0.1 11.7 47.8 35.4
PN rule 0.05 7.5 89.5 12.0
Layered CRF 0.07 0.91 0.05 0.35
PSO with SVM
0.07 3.1 0.05 0.35
5. CONCLUSION
Our integrated system also has the advantage that any method can be used in the layers of the system. This gives flexibility to the user to decide between the time and accuracy trade-off. Furthermore, we can increase or decrease the number of layers in the system depending upon the task requirement. Finally, our system can be used for performing analysis on attacks because the attack category can be inferred from the layer at which the attack is detected. Our proposed has very
good improvement in the detection and false alarm rate. The training time is reduced, so the new system has good computation facility.
6. REFERENCES
[1]. Overview of Attack Trends,
http://www.cert.org/archive/pdf/attack_trends.pdf, 2002.
[2]. SANS Institute—Intrusion Detection FAQ, http://www.sans.org/resources/idfaq/, 2010.
[3]. J.P. Anderson, Computer Security Threat Monitoring
and Surveillance,
http://csrc.nist.gov/publications/history/ande80.pdf, 2010.
[4]. R. Bace and P. Mell, Intrusion Detection Systems, Computer Security Division, Information Technology Laboratory, Nat’l Inst. of Standards and Technology, 2001.
[5]. R. Bace and P. Mell, Intrusion Detection Systems, Computer Security Division, Information Technology Laboratory, Nat’l Inst. of Standards and Technology, 2001.
[6]. KDD Cup 1999 Intrusion Detection Data, http://kdd.ics.uci.edu/databases/kddcup99/kddcup99.h tml, 2010.
[7]. Yuanning Liu1,2, Gang Wang1,2, Huiling Chen1,2, Hao Dong1,2, Xiaodong Zhu1,2, Sujing Wang1,2 An Improved Particle Swarm Optimization for Feature Selection. Journal of Bionic Engineering 8 (2011) [8]. E. Tombini, H. Debar, L. Me, and M. Ducasse, “A
Serial Combination of Anomaly and Misuse IDSes Applied to HTTP Traffic,” Proc. 20th Ann. Computer Security Applications Conf. (ACSAC ’04), pp. 428-437, 2004.
[9]. D. Boughaci, H. Drias, A. Bendib, Y. Bouznit, and B. Benhamou, “Distributed Intrusion Detection Framework Based on Mobile Agents,” Proc. Int’l Conf. Dependability of Computer Systems (DepCoS-RELCOMEX ’06), pp. 248-255, 2006.