DOI: http://dx.doi.org/10.26483/ijarcs.v10i6.6489
Volume 10, No. 6, November-December 2019
International Journal of Advanced Research in Computer Science RESEARCH PAPER
Available Online at www.ijarcs.info
ISSN No. 0976-5697 ISSN No. 0976-5697
EMOTION DETECTION USING AUDIO DATA SAMPLES
Ameya Ajit Mande
Mechanical Engineering Department Maharashtra Institute of Technology
Aurangabad
Sukrut Dani Information Technology
Marathwada Mitra Mandal College of Engineering Pune
Shruti Telang Zongru Shao (Ph.D)
Computer Science Engineering Senior R&D Engineer, Spectronn
Fr. C. Rodrigues Institute of Technology New Jersey, USA
Navi Mumbai
Abstract:A person’s speech can be altered by various changes in the autonomic nervous system and effective technologies can process this information to recognize emotion. As an example, speech produced in a state of fear, anger, or joy becomes loud and fast, with a higher and wider range in pitch, whereas emotions such as sadness or tiredness generate slow and low-pitched speech. Detection of human emotions through voice-pattern and speech-pattern analysis has many applications such as better assisting human-machine interactions. This paper aims to detect emotions from audio. Several machine learning algorithms including K-nearest neighbours (KNN) and decision trees were implemented, based on acoustic features such as Mel Frequency Cepstral Coefficient (MFCC). Our evaluation shows that the proposed approach yields accuracies of 98%, 92% and 99% using KNN, Decision Trees and Extra-Tree Classifiers, respectively, for 7 emotions using Toronto Emotional Speech Set (TESS) Dataset.
Keywords: emotion detection, acoustic features, machine learning, KNN, decision tree, extra-tree, MFCC
I. INTRODUCTION
Emotions primarily govern living beings and it has been an active area of research in academic fields such as psychology, neuroscience, psychiatry, cognitive sciences, etc. It also finds use in numerous practical applications in various fields like Business Process Outsourcing (BPO) Centre and Call Centre to detect the emotion useful for identifying the happiness of the customer about the product, to enhance the speech interaction, to solve various language ambiguities and adaption of computer systems according to the mood and emotion of an individual. Speech is one of the most fundamental abilities of humans, that allow us to bond with each other, express ourselves and
more importantly gives us a sense of existence. It is one of the key factors for mental and physical well-being. Owing to the fact that emotions may define how we behave and perceive the situations we are going through, speech made by a speaker conveys its linguistic meaning as well as the feeling with which the speech is delivered. Emotion detection is the task of recognizing a person’s emotional state – for example, anger, fear, neutral, happiness, disgust, or sad. According to Paul Ekman, each emotion has particular external signs manifested both in facial mimics and in voice [1]. Ekman considers that the voice rarely delivers false emotional messages. This offers strong arguments for the necessity of voice-based emotion recognition. More so because humans have not yet fully tapped into the domain of emotion detection using speech and have many times failed to recognize emotions from voice,
there is a wide scope for improvement and it calls for a deeper study. This research attempts to establish a human-machine interaction, analogous to the human-human interaction and achieve a significant accuracy.
Researchers are trying to broaden the applications of detection and expression of human emotions in various fields. Many thoughts that it would be a daunting task to simulate human emotions believing that they are too complicated to replicate and is difficult to understand the range of human emotions. Human emotions have a long evolutionary purpose for our survival as a species. These are external causes that trigger the emotions inside our brain.
This necessitates for developing some methods for processing and expressing human emotions. Emotional intelligence, as well as technical knowledge, is used to decide the treatment options. Of course, machines could never feel emotions as well as humans do. Nevertheless, they could simulate emotions that enable them to interact with humans in more appropriate ways [2].
II.LITERATURE REVIEW
Speech Emotion Detection is challenging to implement among the other components due to its complexity. Furthermore, the definition of an intelligent computer system requires the system to mimic human behavior[1]. Tejesh Batapati said to detect the emotions in the literature there are two different methods, one is by using the acoustic and spectral features of speech and other is by converting speech to word and applying natural language processing techniques on it. This research is based on the former one i.e. using acoustic and spectral features as this has an advantage over speech to word conversion method in which it overcomes the problems of multilingual personalities, speaking styles and cultural differences [2].Emotions exhibited by a speaker can be detected by analyzing his/her speech, facial expressions and gestures or by combining these properties. This paper concentrates on determining the emotional state from speech signals. Various acoustic features such as energy, zero crossing rate(ZCR), fundamental frequency, Mel Frequency Cepstral Coefficients (MFCCs), etc are extracted for short term, overlapping frames derived from the speech signal. A feature vector for every utterance is then constructed by analyzing the global statistics (mean, median, etc) of the extracted features over all frames [4].
Salamon, J., & Bello, J. P. (2015)explored the application of the spherical k-means algorithm for feature learning from audio signals, here in the domain of urban sound classification. Spherical k-means is a relatively simple technique that has recently been shown to be competitive with other more complex and time-consuming approaches[5].
Anurag Kumar, Pranay Dighe, Rita Singh, Sourish Chaudhuri, Bhiksha Raj, have developed a technique for detecting signature audio events, that is based on identifying patterns of occurrences of automatically learned atomic units of sound, which they call Acoustic Unit Descriptors or AUDs. Experiments show that the methodology works as well for detection of individual events and their boundaries in complex recordings[8]. After collecting terrestrial information on trees in the 101 samples, the volume, basal area and tree number per hectare were calculated in each plot. In the k-NN implementation using different distance measures and k, the cross-validation method was used to find the best distance measure and optimal k. In SVR, the best regularized parameters of four kernel types were obtained using leave-one-out cross-validation. RF was implemented using a bootstrap learning method with regularized parameters for decision tree model and stopping. The validity of performances was examined using unused test samples by absolute and relative root mean square error (RMSE) and bias metrics [9].Chauhan, P. M., & Desai, N. P. (2014, March). a comparative analysis of the Mel frequency cepstral coefficients, extracted from samples of voiced and silent speech is exposed. The classical methodology for extracting Mel frequency
cepstral coefficient is evaluated to show the
implementation steps and the robustness of such kind of features representing in a unique form the statistical and representative information of time varying signals[10]. Cowie, R., Douglas-Cowie, E., Savvidou*, S., McMahon,
E., Sawey, M., & Schröder, M.FEELTRACE is an instrument
developed to let observers track the emotional content of a stimulus as they perceive it over time, allowing the emotional dynamics of speech episodes to be examined. It is based on
activation-evaluation space, a representation derived from psychology. The activation dimension measures how dynamic the emotional state is; the evaluation dimension is a global measure of the positive or negative feeling associated with the state[11].Their model is based on a principled probabilistic framework for learning automatically the distribution of codewords and the intermediate-level themes, which might be thought to be akin to texture descriptions[12].Zhang, X., Xu, C., Xue, W., Hu, J., He, Y., & Gao, M.proposed a comprehensive nonlinear method to solve this problem. On the one hand, as traditional feature reduction may cause the loss of significant amounts of feature information, Kernel Principal Component Analysis (KPCA) based on radial basis function (RBF) was introduced to map the data into a high-dimensional space, extract the nonlinear information of the features, and then reduce the dimension. This method can provide many features carrying information about the structure in the physiological dataset[13].Ellis, Daniel PW, experimented with different encoding methods, namely the LASSO, vector quantization (VQ) and cosine similarity (CS). They evaluate the representations' quality in two music information retrieval applications: query-by-tag and query-by-example. Their results show that concise representations can be used for successful performance in both applications. They recommend using top-τ VQ encoding, which consistently performs well in both applications, and requires much less computation time than the LASSO[14].
Neural networks is an advanced way in detection of emotion as it is more efficient and accurate there's research on [15] speech emotion recognition based on neural networks by Kamran Soltani and Raja Ainon. They have used speech fundamental frequency, voicing rate, format, energy as an extracted features. The Berlin Database of emotional speech is used for this experiment. For different experiments in order to get the best results features are selected manually. The selected features are used as input for different neural network
classifier.
segmentation[18].Benzeghiba, M., De Mori, R., Deroo, O., Dupont, S., Erbes, T., Jouvet, D., & Rose, R. [19] Their paper gathers important references to literature related to the endogenous variations of the speech signal and their importance in automatic speech recognition. Important references addressing specific individual speech variation sources are first surveyed. This covers accent, speaking style, speaker physiology, age, emotions. General methods for diagnosing weaknesses in speech recognition approaches are then highlighted.Gajarla, V., & Gupta, A. [21]results show that deep learning does provide promising results with a performance comparable to some methods using handcrafted features on emotion classification task, and also a few methods using deep learning for sentiment analysis.Anagnostopoulos, C. N., Iliou, T., & Giannoukos, I. [22] speaker emotion recognition is achieved through processing methods that include isolation of the speech signal and extraction of selected features for the final classification. In terms of acoustics, speech processing techniques offer extremely valuable paralinguistic information derived mainly from prosodic and spectral features.
Breiman (2001) proposed random forests, which add an additional layer of randomness to bagging. In addition to constructing each tree using a different bootstrap sample of the data, random forests change how the classification or
regression trees are constructed. In standard trees, each node is split using the best split among all variables. In a random forest, each node is split using the best among a subset of predictors randomly chosen at that node. This somewhat counterintuitive strategy turns out to perform very well compared to many other classifiers, including discriminant analysis, support vector machines and neural networks, and is robust against overfitting (Breiman, 2001). In addition, it is very user-friendly in the sense that it has only two parameters (the number of variables in the random subset at each node and the number of trees in the forest), and is usually not very sensitive to their values[23].
III.MATERIAL AND METHODS
The dataset used was collected from Toronto University’s website“Toronto Emotional Speech Set (TESS)” [2]. The dataset consists of recordings of a set of 200 target words ( for example: dime, deep, ditch) spoken in the carrier phase “Say the word ___” by two Canadian actresses: Kate Dupuis (age 26) and M. Kathleen Pichora-Fuller (age 64).
The dataset consists of seven emotions: anger, disgust, fear, happiness, surprise, sadness, neutral. There are 2651 audio samples in both young and old female voices. The audio samples are of .wav format. Duration of each audio sample is about 3-4 secs. We initially performed Feature Extraction of the data, starting with an initial set of measured data and building derived values (features) intended to be informative and non-reductant., facilitating the subsequent learning and generalization steps, and in cases leading to better human
interpretations [3]. The selected features contained relevant information from the input data, so that the desired task could be performed using this reduced representation instead of the complete initial data.The features that were extracted in the process were MFCC, Tonnetz, Contrast Chroma and Mel
Mel Frequency Cepstral Coefficient (MFCC) is the coefficient that collectively make up an MFC [3][10][17]. The Mel Frequency Cepstrum (MFC) is a representation of the short-term power spectrum of a sound. In MFC, the frequency bands are equally spaced on the mel scale which approximates the human auditory system’s response more closely.[4] The Mel-frequency cepstral coefficients (MFCC) are widely used in audio classification experiments due to its good performance. It extracts and represents features of speech signal. The Mel-cepstra takes short-time spectral shape with important data about the quality of voice and production effects. To calculate these coefficients the cosine, transform of real logarithm of the short-term spectrum of energy must be done.
In musical tuning and harmony, Tonnetz is a conceptual lattice diagram representing tonal space [5]. It was first described by Leonhard Euler. Contrast is the difference between the peaks and valleys in the spectrum. In the music context, the term chroma feature or Chroma gram closely relates to the twelve different pitch classes. Chroma-based features, which are also referred to pitch class profiles, are a powerful tool for analysing music whose pitches can be meaningfully categorized (often into twelve categories) and whose tuning approximates to the equal-tempered scale. Mel creates an mel-scale spectrogram.
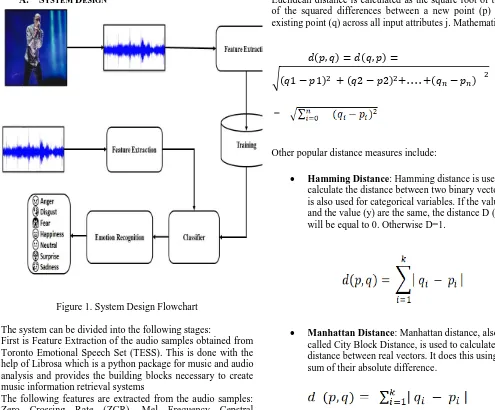
A. SYSTEM DESIGN
Figure 1. System Design Flowchart
The system can be divided into the following stages:
First is Feature Extraction of the audio samples obtained from Toronto Emotional Speech Set (TESS). This is done with the help of Librosa which is a python package for music and audio analysis and provides the building blocks necessary to create music information retrieval systems
The following features are extracted from the audio samples: Zero Crossing Rate (ZCR), Mel Frequency Cepstral Coefficient (MFCC), Tonnetz, Contrast, Mel, Chroma. The selected features are expected to contain the relevant information from the input data, so that the desired task can be performed.
Second, Training of audio samples with the above extracted features.
Third, testing of an unknown audio sample and classifying it into the emotion i.e. recognising the emotion.
B. ALGORITHMS
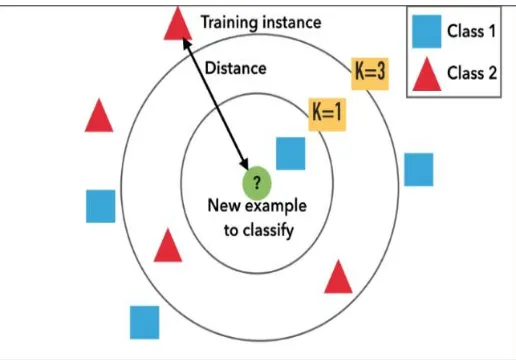
The algorithm applied on the audio dataset is KNN algorithm. KNN stands for K-Nearest Neighbours. It is a simple supervised machine learning algorithm that stores all available cases and classifies new cases based on a similarity measure (e.g., distance functions). The algorithm directly makes predictions using the training dataset. Predictions for a new instance are made by searching through the entire training set for the K most similar instances and summarizing the output variable for those K instances [7]. Distance measure is used to determine the K instances in the training data set that are most similar to the new input given to the system. Euclidean distance is the most widely used distance measure for real valued input variables.[8]
Euclidean distance is calculated as the square root of the sum of the squared differences between a new point (p) and an existing point (q) across all input attributes j. Mathematically,
=
Other popular distance measures include:
Hamming Distance: Hamming distance is used to calculate the distance between two binary vectors. It is also used for categorical variables. If the value (x) and the value (y) are the same, the distance D (say) will be equal to 0. Otherwise D=1.
Manhattan Distance: Manhattan distance, also called City Block Distance, is used to calculate the distance between real vectors. It does this using the sum of their absolute difference.
Following are some of the distance measures that can be used:Tanimoto, Jaccard, Mahalanobis and Cosine Distance. The best distance metric can be chosen based on the properties of the data. Being unsure, one can experiment with different distance metrics and different values of K together and see which mix results in the most accurate models.
Euclidean distance can be termed as a good distance measure to use if the type of the input variables is the similar e.g. all measured widths and heights). Manhattan distance is another distance measure which is a good too except that it can be used if the input variables are not similar in type (such as age, gender, height, etc.).[8]
In KNN, algorithm tuning can be used for finding the value for K can be found by algorithm tuning. It is a trial-and-error process by which the parameters used in an algorithm can be changed every time it is run on the data set.The computational complexity of KNN increases with the size of the training dataset. For very large training sets, KNN can be made stochastic by taking a sample from the training dataset from which to calculate the K-most similar instances.
K is the number of neighbours and is used as a similarity measure. KNN can be used for classification as well regression predictive problems. However, it is more widely used in classification problems in the industry.
Figure 2. KNN example
The accuracy of the K-NN Classification Model was compared with 2 more classification models, Decision Tree Classifier
and Extra Tree Classifier.
Decision Trees are supervised learning algorithms. They are assigned to the information-based learning algorithms which use different measures of information gain for learning. We can use decision trees for issues where we have continuous but also categorical input and target features.
Extremely Randomized Tree Classifier (Extra-trees) differs from classic decision trees in the way they are built. The algorithm builds an ensemble of regression trees according to the classical top-down procedure. Its two main differences with other tree-based ensemble methods are that it splits nodes by choosing cut-points [8] fully at random and that it uses the whole learning sample to develop the trees. When looking for the best split to separate the samples of a node into two groups, random splits are drawn for each of the randomly selected features and the best split among those is chosen. When the random feature is set 1, a totally random decision tree is built.[9]
Extra tree classifier selects a random value for the split instead of computing locally optimal feature/split combination which is done in Random Forest and this is the main difference between the two.
Cross-validation: It can be defined as a technique to evaluate predictive models. It does this by partitioning the original sample into a training set to train the model, and a test set to evaluate it.
In k-fold cross-validation, the sample, initially is randomly partitioned into k equal size subsamples. Out of these k subsamples, asingle subsample is retained and is considered as the validation data. This validation data is used for testing the
model and the remaining k-1 subsamples are used as training data. The cross-validation process is then repeated k times (the folds), with each of the k subsamples used exactly once as the validation data [16]. Theresults from the folds (k in total) can then be averaged or combined to produce a single estimation. This method is useful as all the observations are used for both training and validation Given that each observation is used for validation exactly once. We use k-fold cross-validation for evaluation, in which the folds are randomly selected and each fold contains the same proportions of class labels.
IV.EXPERIMENTALRESULTS
[image:5.595.38.296.100.280.2]A. ACOUSTIC FEATURES:
Figure 3. Wave Plots of Emotions
The analysis of audio signals is necessary to know which features are to be extracted from the audio files to successfully classify the audio emotions. Audio analysis is also necessary to visualize the audio in the form of waves and chromogram so that to identify the change in emotions visually. Figure 2 shows the wave plot representation of the audio signals in each emotion, it is plotted by using the amplitude of the signal and plotting it along the timeframe.” librosa. display. wave plot” library is used to get the plots. By analysing the wave plots of different emotions it is found that each emotion is uttered with a specific pattern of amplitude along its time frame[9]. For example in the wave plot of neutral emotions amplitude is very less when compared to happy emotion’s plot at the time [8][11].
Figure 4. Learning curve for KNN
Figure 5. Learning curve for Extra Trees Classifier
Figure 6. Learning Curve for Decision Tree
B. MACHINE LEARNING RESULTS
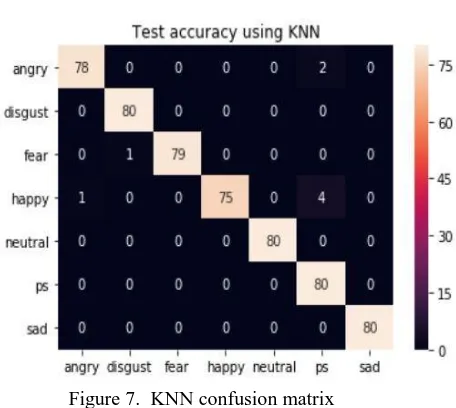
The results were obtained in the form of Confusion Matrix. Confusion Matrix is defined as a table that is used to describe the performance of a classification model on a set of test data. The true values for this data are known.
The KNN classification model gave the following results:
1. Using K Nearest Neighbours (KNN)
Figure 7. KNN confusion matrix
The KNN accuracy 10-fold cross validation on each emotion as: Anger (97%), Disgust (100%), Fear (98%), Happiness (93%), Neutral (100%), Surprise (100%), Sad (100%). The accuracy achieved by the KNN model is 98%.
2. Using Decision Tree classifier
Figure 8. Decision Tree confusion matrix
The Decision Tree Classifier accuracy of each emotions with 10-fold cross validation: Anger (87%), Disgust (95%), Fear (98%), Happiness (92%), Neutral (92%), Surprise (85%), Sadness (95%). The mean accuracy that KNN model predicted is 92%. (structure this sentence better)
[image:6.595.325.553.116.320.2] [image:6.595.313.555.409.606.2] [image:6.595.51.274.485.647.2]Figure 9. Extra Tree confusion matrix
The Extra Tree Classifier accuracy of each emotion with 10-fold cross validation: Anger (100%), Disgust (100%), Fear (100%), Happy (100%), Neutral (100%), Surprised (98%), Sad (100%). The accuracy achieved by the KNN model is 99%.
Emotion KNN
model
Extra Tree Classifier
Decision Tree Classifier
Anger 75 80 74
Disgust 80 80 76
Fear 78 80 70
Happiness 79 80 79
Neutral 80 80 68
Surprise 80 79 76
Sadness 80 80 74
[image:7.595.47.295.77.258.2]Accuracy 98% 99% 92%
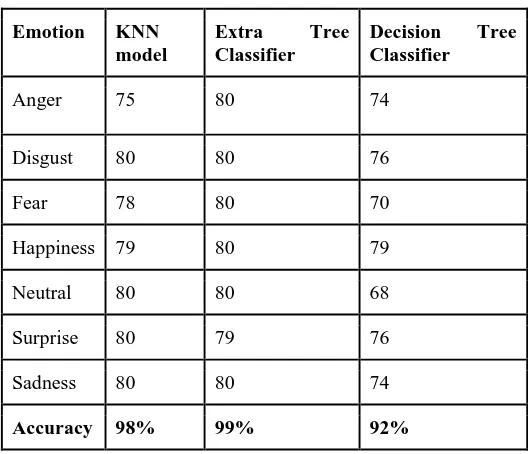
Table I : Results Comparison chart:
V. CONCLUSIONANDFUTURESCOPE
The paper has hence given an idea of detecting the emotions of a person by processing the speech data as the input. It was observed that there are distinguishable features in a speech that characterizes each emotion state. The system designed for emotion detection from voice described in this paper is intended for hardware implementation and particular applications in companion robots and pet robots.
In this research, we observed the fact thata greater number of features being extracted increased the accuracy of the model
significantly as compared to the systems which make use of 2 or 3 acoustic features. The KNN model predicted an accuracy of 98%. An accuracy of 92% is predicted by the Decision Tree classifier. The Extra Tree Classifier predicted an accuracy of 99%. Hence, it can be concluded that the accuracy of KNN classification model and Extra Tree Classifier is the best. Our method is designed to be scalable to multi-party setting with more than two speakers, which we plan to explore in future work, using Neural Networks. Also, we are working on combining the audio system with emotion detection using facial or gestural system to optimize the task of emotion detection and generate even more accurate results.
VI.REFERENCES
[1].Sundarprasad, N. (2018). Speech Emotion Detection Using Machine Learning Techniques.
[2]. Detection of Audio Emotional Intelligence Using Machine Learning Algorithms, Tejesh Batapati x17108811 MSc Research Project in Data Analytics(2018)
[3].Crowder, J., and Shelli Friess. "Artificial psychology: The psychology of AI." In Proceedings of the 3rd Annual International Multi-Conference on Informatics and Cybernetics. Orlando, FL. 2012.
[4]. Semwal, N., Kumar, A., & Narayanan, S. (2017, February). Automatic speech emotion detection system using multi-domain acoustic feature selection and classification models. In 2017 IEEE International Conference on Identity, Security and Behavior Analysis (ISBA) (pp. 1-6). IEEE.
[5]Salamon, J., & Bello, J. P. (2015, April). Unsupervised feature learning for urban sound classification. In 2015 IEEE International Conference on Acoustics, Speech and Signal Processing (ICASSP) (pp. 171-175). IEEE
[6]Sudhakar, R. S., & Anil, M. C. (2015, February). Analysis of speech features for emotion detection: a review. In 2015 International Conference on Computing Communication Control and Automation (pp. 661-664). IEEE.
[7]Harari, Y. N. (2016). Homo Deus: A brief history of tomorrow. Random House.
[8]Anurag Kumar, Pranay Dighe, Rita Singh, Sourish
Chaudhuri, Bhiksha Raj, "Audio event detection from acoustic unit occurrence patterns", Acoustics Speech and Signal Processing (ICASSP) 2012 IEEE International Conference on, pp. 489-492, 2012
.
[9] Kozma, L. (2008). k Nearest Neighbors algorithm (kNN). Helsinki University of Technology.
[10].Chauhan, P. M., & Desai, N. P. (2014, March). Mel frequency cepstral coefficients (mfcc) based speaker identification in noisy environment using wiener filter. In 2014 International Conference on Green Computing Communication and Electrical Engineering (ICGCCEE) (pp. 1-5). IEEE.
[11].
Cowie, R., Douglas-Cowie, E., Savvidou*, S.,McMahon, E., Sawey, M., & Schröder, M. (2000). 'FEELTRACE': An instrument for recording perceived emotion in real time. In ISCA tutorial and research workshop (ITRW) on speech and emotion.
[12].Fawcett T(2006) An introduction to ROC analysis. Pattern Recognition Letters, 27(8):861-874 – Fei.L and Perona,.P (2006) – A Bayesian Hierarchical Model for Learning Natural Scene Categories
[image:7.595.30.294.348.575.2]Physiological Signals with Comprehensive Nonlinear Processing. Sensors, 18(11), 3886.
[14] Ellis, Daniel PW. "Classifying music audio with timbral and chroma features." (2007): 339-340.
[15] Soltani, K., & Ainon, R. N. (2007, February). Speech emotion detection based on neural networks. In 2007 9th international symposium on signal processing and its applications (pp. 1-3). IEEE.
[16] El Ayadi, M., Kamel, M. S., & Karray, F. (2011). Survey on speech emotion recognition: Features, classification schemes, and datasets. Pattern Recognition, 44(3), 572–587..
[17]Nicolaou, M. A., Gunes, H., & Pantic, M. (2011). Continuous prediction of spontaneous affect from multiple cues and modalities in valence-arousal space. IEEE Transactions on Affective Computing, 2(2), 92-105.
[18] Batliner, A., Schuller, B., Seppi, D., Steidl, S., Devillers, L., Vidrascu, L., & Amir, N. (2011). The automatic recognition of emotions in speech. In Emotion-oriented systems (pp. 71–99). Berlin Heidelberg: Springer.
[19]Benzeghiba, M., De Mori, R., Deroo, O., Dupont, S., Erbes, T., Jouvet, D., & Rose, R. (2007). Automatic speech recognition and speech variability: A review. Speech Communication, 49(10), 763–786.
[20] Karthik, R., Satapathy, P., Patnaik, S., Priyadarshi, S., Bharath, K. P., & Kumar, M. R. (2019). Automatic Phone Slip Detection System. In Microelectronics, Electromagnetics and Telecommunications (pp. 327-336). Springer, Singapore.
[21] Gajarla, V., & Gupta, A. (2015). Emotion detection and sentiment analysis of images. Georgia Institute of Technology.
[22]Anagnostopoulos, C. N., Iliou, T., & Giannoukos, I. (2015). Features and classifiers for emotion recognition from speech: a survey from 2000 to 2011. Artificial Intelligence Review, 43(2), 155-177.