Evaluating Summaries Automatically – a system proposal
Paulo C F de Oliveira
*, Edson Wilson Torrens
*, Alexandre Cidral
*, Sidney Schossland
+,
Evandro Bittencourt
+*
Department of Informatics, University of Joinville
+
Department of Foreign Trade, University of Joinville Joinville, SC - Brazil
E-mail: {pc.oliveira,edson.wilson,alexandre.cidral, sidney.schossland,evandro.bittencourt}@univille.net
Abstract
We propose in this paper an automatic evaluation procedure based on a metric which could provide summary evaluation without human assistance. Our system includes two metrics, which are presented and discussed. The first metric is based on a known and powerful statistical test, the χ2
goodness-of-fit test, and has been used in several applications. The second metric is derived from three common metrics used to evaluate Natural Language Processing (NLP) systems, namely precision, recall and f-measure. The combination of these two metrics is intended to allow one to assess the quality of summaries quickly, cheaply and without the need of human intervention, minimizing though, the role of subjective judgment and bias.
1. Introduction
The summarization of a text consists in extracting the chief points of an original document in terms of its key sentences and/or clauses, and displaying the summary in a readable form. In general terms, this definition leads to a very important question: what constitutes a good summary? Or, more simply: how to evaluate a summary? Research on summary evaluation over the last decades has tried to respond to these complex questions. In acknowledgment of this fact, a series of conferences like Text Retrieval Conferences (TREC) (Voorhees and Harman, 1999), Message Understanding Conferences (MUC) (Chinchor et al, 1993), TIPSTER SUMMAC Text Summarization Evaluation (Mani et al, 1998), Document Understanding Conference (DUC) (DUC, 2004), and Text Summarization Challenge (TSC) (Fukushima and Okumura, 2001), have attested the importance of this topic. The main difficulty in evaluating a summarization system is that there is not as yet, a clear definition for what constitutes a good summary. Another difficulty related to summary evaluation comes from the fact that each text can have more than one correct summary as may be seen in the work of Edmundson (1969), Hand (1997) and Paice (1990). The majority of evaluation methods developed so far have depended on human intervention, and therefore have the drawbacks of being time consuming and expensive. On the other hand, if a researcher, for example, needs an evaluation method which is fast and is not influenced by human error or subjectivity, an automatic evaluation method could be the answer. Many approaches have been developed on this topic, using a variety of metrics such as sentence recall, sentence ranking, content-based, and so on (e.g. Donaway et al (2000); Radev et al (2000); Saggion et al (2002)).
In this paper, we present an efficient automatic summary evaluation procedure. The fundamental characteristic of such a procedure is that primarily it should be based on a
new metric which could provide summary evaluation without human assistance. Second, it should be based on insights derived from research in summary evaluation, statistics and NLP. To sum up, our intention is to establish a novel automatic procedure which may be used to evaluate the content of a summary, quickly, cheaply and without the need of human intervention.
This paper is organized as follows: Section 2 describes the development of our evaluation procedure. Section 3 presents the performance analysis of our procedure. Finally, the conclusions are summarized in Section 4.
2. Method´s description
We have developed a system called VERT1, which has two methods or metrics: one deals with content bearing words in both the reference text and candidate summaries using correlation and χ2
statistics. The second deals with the matching between sentences, based again in content words using a graph theory method. This graph theory method, based on bipartite matching, leads to the well-known precision and recall that form the basis of Information Retrieval (IR)-metrics. The first method is called VERT-C and the second is called VERT-F. The idea for the name is derived from two previous systems, namely BLEU2 (Papineni et al, 2001) and ROUGE3 (Lin, 2004).
2.1 VERT-C: Chi-Square (
χ
χ
χ
χ
2) Statistics
This metric is based on the Chi-Square (χ2
) goodness-of-fit test. This test measures whether or not
1
VERT stands for Valuation using Enhanced Rationale Technique
2
BLEU stands for BiLingual Evaluation Understudy 3
3. DOING THE EVALUATION OF
EVALUATION
The major goal of the experiment reported in this section, is to investigate the performance of a new automatic summary evaluation system, called VERT. In addition, the evaluation procedure must not depend on human intervention; it should be carried out automatically. For us, the efficacy of an automatic evaluation metric must be assessed through correlation comparison between the automatic metric scores and human scores. This means that the automatic scores should correlate highly with human scores (Lin, 2004). If they do correlate, we can affirm that the automatic metric can be used to evaluate summaries. We believe that this criterion forms the fundamental ‘ground-truth’ for the evaluation of our two metrics (VERT-C and VERT-F).
We have used DUC data in order to evaluate VERT, because such a corpus contains 3 years of human judgements, and this would make our efficacy assessment possible and feasible. From DUC data we have used the following corpus for this study:
• Summaries of single documents of about 100 words for DUC 2001 and DUC 2002. In total, 15 systems submitted 3,304 summaries for DUC 2001. For DUC 2002, 17 systems submitted 7,359 summaries.
• Very short summaries of single documents of about 10 words for DUC 2003, where 14 systems submitted in total 8,050 summaries.
As we said earlier, the assessment of an automatic evaluation metric should be carried out through correlation analysis. In the statistical literature, this type of analysis makes use of measures of correlation, which are, according to Sheskin (2000), ‘descriptive statistical measures that represent the degree of relationship between two or more variables’. These descriptive measures are known as correlation coefficients. Those coefficients, when calculated, produce a value within the range of –1 to +1. If a value of +1 is obtained, there is a perfect positive correlation; if a value of –1 is obtained, there is a perfect negative correlation, and a value of zero indicates no correlation at all. This range (–1 to +1), in fact, denotes the strength of the relationship between the two variables.
A question arises at this point: is it possible to determine if one metric is “better” than another through correlation analysis? In other words, how to proceed in comparative evaluations, like ROUGE versus VERT, for instance? In comparative evaluations we believe that the answer is ranking correlation (Voorhees (2000); Voorhees and Tice (2000)). What we mean is the rankings produced by a particular scoring method (an evaluation metric, in our context) are more important than the scores themselves. This insight is given by Kendall’s Tau (τ) correlation coefficient (Sheskin, 2000). Kendall’s τ calculates the “distance” between two rankings as the minimum number of pairwise adjacent swaps necessary to convert one ranking into the other. The “distance” value, which is normalized by the number of items being ranked, is the
correlation coefficient. In other words, Kendall’s τ
depends on the number of inversions in the rank order of one variable when the other variable is ranked in order. If the correlation is 1.0, we have two identical rankings; if it is -1.0, we have a correlation between a ranking and its perfect inverse; and if it is 0.0, there is no correlation. We then computed, for each set of DUC data (i.e. 2001, 2002 and 2003), the Kendall’s τ correlation coefficient. This correlation coefficient was computed between the systems’ average VERT-C and VERT-F scores, and their respective mean coverage scores as assigned by NIST assessors. The mean coverage scores were assigned by human judges, where they examined the percentage of content overlap between a manual summary and the candidate summary using Summary Evaluation Environment5 developed by the University of Southern California’s Information Sciences Institute.
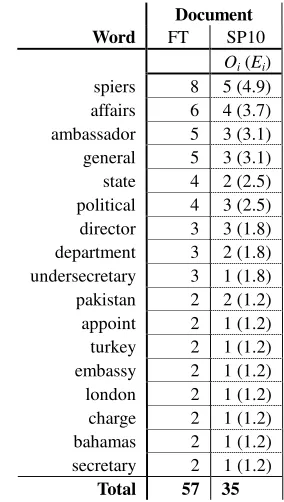
Table 1 shows the Kendall’s τ correlation coefficient of VERT-C and VERT-F scores versus human judgements on DUC 2001 and 2002 data, which consist of single summaries of 100 words, and also on DUC 2003 data, which consist of very short summaries of 10 words. As can be seen in Table 1, VERT-F achieved a good correlation with human scores compared to VERT-C. A possible explanation for the difference in terms of performance between VERT-C and VERT-F is due to the difference of the approaches. VERT-F is based on the matching of all words between a reference text and a candidate text; that is, each text is split in clauses (a word is the minimum clause in this case), and the matching is carried out. On the other hand, VERT-C is word frequency based, that is, only the most frequent words in the reference and in the candidate text are considered in the calculation, resulting then, in less similarity.
DUC VERT-C vs Humans VERT-F vs Humans
2001 0.78 0.91
2002 0.52 0.89
2003 0.59 0.95
Table 1. Kendall’s τcorrelation coefficient of VERT scores versus human scores for DUC 2001, 2002 and
2003 data
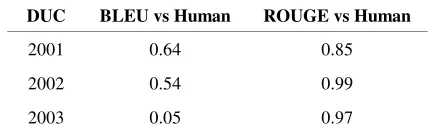
One might ask: what about the comparative evaluations? What about ROUGE and BLEU against VERT? Similarly, we computed Kendall’s τ between ROUGE, BLEU and human scores. These values are shown in Table 2 below.
DUC BLEU vs Human ROUGE vs Human
2001 0.64 0.85
2002 0.54 0.99
2003 0.05 0.97
Table 1. Kendall’s τcorrelation coefficient of BLEU and ROUGE scores versus human scores for DUC data
5
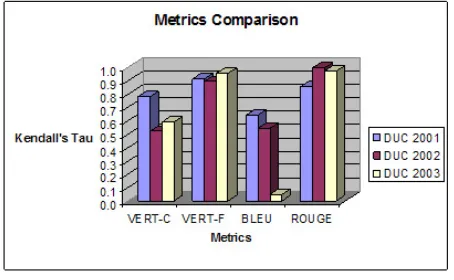
We decided to put all the results into a chart in order to illustrate better the metrics performances. Looking at Figure 4, we observe that the best performance was achieved by ROUGE, which outperforms our metric VERT-C, and BLEU. On the other hand, VERT-F and ROUGE comparatively presented almost the same performance. BLEU showed the poorest performance amongst the other metrics. These results also highlight the achievement of our proposed metric VERT; or more specifically VERT-F.
Figure 4. Comparative Chart
4. Conclusion
The previous section has presented the experiments conducted in order to test VERT’s performance. We have utilized correlation analysis, a kind of statistical investigation which makes use of correlation coefficients. These coefficients quantify the degree of relationship between two or more variables. Kendall’s τ correlation coefficient has been used. The outcomes of the experiment revealed that VERT-F outperformed VERT-C due to a difference between the rationales of the methods. The rationale behind VERT-F is based on the matching of all words (n-gram matching) contained in the reference and the candidate text, and the rationale behind VERT-C is based on choosing only content words, i.e. the most frequent words in the reference and the candidate text. We believe that VERT-C rationale tended to worsen its performance.
We found a high and positive statistically significant correlation between VERT scores and human scores. This can be considered as a significant achievement because three years of human evaluation data have been used to perform the correlation analysis.
We also have found that doing a comparative evaluation (ranking correlation) amongst BLEU, ROUGE and VERT against human scores, ROUGE outperformed the other two. However, VERT-F had a similar performance in relation to ROUGE, the official metric used by NIST. The results suggest that VERT-F can be used as a reliable summary evaluation metric, since it presented performance results similar to ROUGE, which is the official metric utilised by NIST in two editions of DUC (2004 and 2005).
In conclusion, we believe that the notion of ranking correlation, that is, comparative evaluation, is central to summary evaluation research; or more specifically, evaluation of evaluation. Using, as background, a mature discipline like statistics, we can confirm that our evaluation experiments are significant and their results are consistent. Moreover, our work contributed to solid advance in the state of the art.
5. References
Butler, C. S.,1985. Statistics in linguistics, Oxford.: Basil Blackwell.
Chinchor, N., et al, 1993. "Evaluating message understanding systems: an analysis of the third Message Understanding Conference (MUC-3),"
Computational Linguistics, vol. 19, no. 3, pp. 409-449. Church, K. and Gale, W., 1991, "Concordances for parallel text," in Proceedings of the Seventh Annual Conference of the UW Centre for the New OED and Text Research. pp. 40-62.
Cormen, T., et al, 2001. Introduction to Algorithms, 2 ed. MIT Press.
Donaway, R. L., 2000. "A comparison of rankings produced by summarization evaluation measures," in
Proceedings of NAACL-ANLP 2000 Workshop on Text Summarisation. pp. 69-78.
DUC, 2004. The Document Understanding Conference. http://duc.nist.gov/
Edmundson, H. P., 1969. "New methods in automatic abstracting," Journal of the Association for Computing Machinery, vol. 16, no. 2, pp. 264-285.
Fukushima, T. and Okumura, M., 2001. "Text summarization challenge: text summarization in Japan," in Proceedings of NAACL 2001 Workshop Automatic Summarization. pp. 51-59.
Hand, T. F., 1997. "A proposal for task-based evaluation of text summarisation systems," in Proceedings of the ACL/EACL'97 Workshop on Intelligent Scalable Text Summarization. pp. 31-38.
Kilgarriff, A., 2001. "Comparing corpora," International Journal of Corpus Linguistics, vol. 6, no. 1, pp. 1-37. Lin, C-Y., 2004. "ROUGE: a package for automatic
evaluation of summaries," in Proceedings of the Workshop on Text Summarization Branches Out (WAS 2004).
Mani, I., et al, 1998. The TIPSTER SUMMAC text summarisation evaluation: Final report. The MITRE Corporation. MTR 98W0000138.
Open University, 2001. Networks - assignment and transportation. [3]. The Open University.
Paice, C. D., 1990. "Constructing literature abstracts by computer: techniques and prospects," Information Processing and Management, vol. 26, no. 1, pp. 171-186.
Papineni, K., et al, 2001. BLEU: a Method for Automatic Evaluation of Machine Translation. IBM Research Report RC22176.
Conference on Artificial Intelligence.
Radev, D., 2000. "Centroid-based summarization of multiple documents: sentence extraction, utility based evaluation, and user studies," in Proceedings of NAACL-ANLP 2000 Workshop on Text Summarisation. pp. 21-29.
Saggion, H., et al, 2002. "Developing Infrastructure for the Evaluation of Single and Multi-document Summarization Systems in a Cross-lingual Environment," in Proceedings of the Third International Conference On Language Resources And Evaluation (LREC 2002). pp. 747-754.
Salton, G. and McGill, M. J., 1983. Introduction to Modern Information Retrieval, McGraw Hill,
Sheskin, D. J., 2000. Handbook of Parametric and Nonparametric Statistical Procedures, 2 ed. Florida. Siegel, S. and Castellan Jr, N. J., 1988. Nonparametric
Statistics for the Behavioral Sciences, New York: McGraw-Hill.
Turian, J. P., et al, 2003. "Evaluation of Machine Translation and its Evaluation," in Proceedings of MT Summit IX.
van Rijsbergen, C., 1979. Information Retrieval, 2nd ed. London: Butterworths.
Voorhees, E. M. and Harman, D. K., 1999. "The Eight Text Retrieval Conference (TREC-8)," eds. National Institute of Standards and Technology (NIST).
Voorhees, E. M. and Tice, D. M., 2000. "Overview of the TREC-9 question answering track.," in Proceedings of the Ninth Text REtrieval Conference (TREC-9). Voorhees, E. M., 2000. "Variations in relevance