On the origin of pattern and form in early Metazoans
FREDERICK W. CUMMINGS*
University of California Riverside, California, USA
ABSTRACT The ‘Cambrian explosion’, about 540 million years ago, may have occurred within 10 to 50 million years. Almost all of the modern phyla, a very restricted group and many groups that may represent extinct phyla, suddenly appear near that time in the fossil record. Numerous extensive periods of mass extinction since that time led to no new phyla. This is taken as an impetus to examine a possible source, beyond Darwinian adaptation, of the apparently restricted number of phyla. Such a postulated constraint or restriction beyond adaptation is proposed to be based on a mutation or mutations allowing single celled or colonial precursors to begin forming into epithelial sheets and gene activation patterns of a particular kind, those giving rise to the very earliest metazoans. The interaction of signaling pathways in pairs, with different pairs acting sequentially are proposed as key to this earliest patterning, such patterning being extensively elaborated over the last ∼ 550 million years. Restrictions on the very large set of possible forms and patterns on which adaptation acts are discussed.
KEY WORDS:
signaling pathway, evolution, morphogenesis, pattern formation
Introduction
The extraordinary and rapid diversification of higher taxa in the Cambrian or Precambrian fossil record is one of the most stunning events in the history of evolution, one prompting much debate. Questions include why such fundamentally different body plans evolve in such great profusion early in evolutionary history, but very little if at all thereafter. The mass extinctions that occurred since the Cambrian might be expected to have provided a partial predator vacuum, allowing evolution to experiment with different body types. Another question is why such great changes evolved in so short a time (if in fact they did so), after billions of years of single-cell dominance (Futuyma, 1998).
Many studies have emphasized the contrast between the diversity of cellular behaviors and the unity of the underlying molecular mechanisms. All eukaryotic cells have inherited core mechanisms or modules and these core mechanisms have ap-peared in highly effective form very early in the evolution of eukaryotes. Many or even most of these modules are involved in crucial cellular ‘housekeeping’ chores, such as metabolism. Oth-ers are involved in signaling pathways, some presumably existing even before the advent of multicellularity approximately 560M years ago (Gordon, 1999; Schlosser and Wagner, 2004).
Great progress has been achieved in recent years in unravel-ing the genetic basis of many of these core mechanisms. Our understanding is only at the most rudimentary stage concerning how this vast store of genetic information becomes converted into complex cellular determinations and specific organ shapes, such
*Address correspondence to: Dr. Frederick W. Cummings. 136 Calumet Ave., San Anselmo, CA, 94960, USA. e-mail: [email protected]
0214-6282/2006/$25.00
© UBC Press Printed in Spain www.intjdevbiol.com
as an embryo. The aim of the present paper is to outline, certainly in a most elemental and incomplete manner, a possible path from gene to most primitive organism. Continued evolution has been made possible because evolution has proceeded by modifying the later stages of development of individual modules, one at a time, while leaving the initial arrangement of these modules unchanged. Focus here is on the very earliest stage of multicel-lular development, diploblastic and triploblastic animal origins, when certain modules became more or less unchangeable.
The paper can be viewed as consisting of two main parts. The first will develop a new patterning mechanism, one based on the interaction of two signaling pathways. Patterning implies a mecha-nism instructing genes to behave differently in different spatial areas. The signaling pathways responsible for patterns will be viewed as interacting in pairs, with different pairs acting sequen-tially in time to produce morphogenetic patterns. The patterns obtained by the present model are sufficiently complex to mimic, for example, animal coat patterns (Murray, 1990), or the observed phyllotactic patterns on a plant stem (Cummings and Strickland, 1998). The term ‘morphogenetic’ pattern is to be stressed be-cause the shape determination implied by ‘morph’ goes hand in hand with the pattern determination of a given region of epithelial surface. Shape is important; there are no flat animals. All shape changes are here restricted to epithelial cell sheets. The ‘pattern’ part will be discussed first and viewed (unrealistically) as if such patterns could occur on (e.g.) a fixed sphere of epithelial cells.
then inextricably and necessarily tied together, as in the present model. Pattern determines shape and shape in turn determines pattern, during a continuous process of growth.
The simplest case of ‘proto-gastrulation’, or invagination start-ing from a spherical blastula will be discussed in this context, illustrating the most natural outcome of the simplest two-part pattern, such as may be imagined to occur near the dawn of multicellulars. The focus is on the particular handful of signaling pathways known to be involved in the crucial embryonic pro-cesses of genetic determination, such as changes of cellular architecture, control of adhesion, cell division and apoptosis. The well-studied Wnt pathway in conjunction with several other growth pathways, such as Hedgehog (Hh), BMP, TGF and Notch are prime candidates in this respect (Cummings, 2004).
Plausibility arguments are presented for the possible origin of the radial periodicity of earliest cnidaria-like animals, providing initial deviation from the simplest example of axial symmetry. In this first case considered of deviation from axial symmetry, the topology is that of a sphere or gastrula. A second case considers change in basic topology from sphere to ‘donut’ and suggests an origin of segmentation and bilaterality in the earliest bilaterally symmetric through-gut worm-like animal.
The pattern
The four variables representing the two patterning pathway molecules are two (free) ligand densities (number/area) L1 , L2 and the two corresponding activated or occupied receptor densi-ties R1,R2. The R’s include the receptor (e.g., Frizzled in the case of Wnt ligand) together with its bound ligand, or may indicate simply activation of the particular pathway. The free ligand den-sities are assumed to satisfy the usual diffusion equation in the absence of receptors. However, the binding of a ligand of a given type (L1 orL2) to its receptor will affect the rate of change of both of the two ligand densities.
The usual discussion of signaling pathways begins by assum-ing that there has been an activation of the receptor by its ligand. Then experimental study traces the cellular dynamics of the various downstream molecules and genetic activations beyond this point. There is most often less discussion of the origin of the activating ligand, i.e., asking for its place or cell of origin, or why it was secreted from any distant or neighboring cell at any particular time. Four answers to such a question jump to mind. Perhaps the ligand captured by a receptor on a given cell was emitted (secreted) at random times from neighboring cells, or perhaps was emitted at a constant rate. These two possibilities are rejected here. Then there is the possibility that the captured ligand was emitted earlier by neighboring cells at times dictated by some internal cellular clock. While this latter is a possibility, an alternate picture is assumed here, namely that the ligand was secreted by a given cell because it was stimulated to do so because of activation of a receptor on that cell by a like ligand.
The key assumption of the present patterning mechanism is the assumption that when a ligand activates its receptor it will stimulate the secretion of like ligand at the same time that it suppresses secretion of ligand of a second (and thus coupled) signaling pathway. This will occur in a reciprocal way between pathways ‘1’ and ‘2’. The ‘morphogens’, hereafter referring to the activated receptor densities R1 andR2, are then transmitted over
many cellular diameters. The stimulation of secretion of like ligand into the extracellular medium upon activation of its receptor, at the same time as inducing suppression of secretion of ligand of the ‘other’ ligand type, is a prediction of the model. Since this pattern-ing process is assumed to be significantly faster than processes that proceed via the nucleus, this provides a picture of a two-part process, first of all leading to a “prepattern”, occurring well before cellular determination and shape changes.
The ‘G’ proteins accompanying the individual pathways most likely are involved in such ‘on-off’ switching. It will further be supposed that such stimulated emission of secreted ligand (or perhaps, ligand precursor) happens on a time scale that is relatively short compared to the time for transcription and trans-lation, i.e., gene activation and subsequent protein production. Thus the pattern will be expected to be formed some time interval before cellular determination occurs. Then the oft noted “pre-pattern”, the pattern preceding cell determination and cell shape changes in time, is a built-in feature of the model. This implies that ligand or its precursor has been already ‘packaged’ beforehand and stored in the cytoplasm, providing for rapid secretion into the extracellular space upon receptor activation. This is reminiscent (but only in this restricted sense) of stimulated secretion from neurosecretory cells. Since such stimulated secretion of ligand has not been established, the model suggests such experimental investigations and the validity of the model depends on the outcome. It is relevant to note, however, in the case of the Wnt pathway that at least one branch (‘non-canonical’) bypasses the nucleus.
In appendix A eqns. (A.1) and (A.2) show two equations for the time rate of change of two ligands, L1 andL2. The (linear) effect of both the positive and negative feedbacks described above are modeled by the second and third terms on the right hand side (r/ h/s). All parameters of the model are positive. The inevitable nonlinear terms are indicated by “N.L.”. These N.L. terms are presumed to give saturation effects and may be modeled in various ways. The ‘difference’ (R1-(β/α)•R2) between the two activated receptor densities, where β/α is a parameter, plays a key role.
Equations for the rate of change of receptor activation densi-ties R1 and R2 are shown in Appendix A by eqns. (A.3) and (A.4). The receptors are assumed to be relatively fixed in the plasma membrane of the cells and an average is assumed to include a small number of cells (∼10) of like activation in order to be able to use the concept of ‘densities’ (number/area). These rates of change of activated receptor density are proportional to (c.f. the first terms on the r/h/s of eqns. (A.3) and (A.4)) the product of the ligand density at the receptor site times the number of unoccupied receptor sites available. The second term on the r/h/s of eqns. (A.3) and (A.4) models most simply the decay in time (with rates µ and ν) of the active sites, when the receptors either resume unoccupied status, or are otherwise rendered inactive.
drop-ping the “N.L.” terms and replacing the unoccupied densities by a constant in Appendix A) already gives spontaneous pattern formation, provided that a certain reasonable criterion is met for a combination of the parameters of the model (Cummings, 2004). Another difference from earlier models is that there is no need to require disparate diffusion rates to achieve patterning; the diffu-sion rates can for example be equal, or e.g., both small. Perhaps most importantly, the present model is conceptually based on coupled signaling pathways, those pathways known to be in-volved in embryonic patterning. Only minimal details mentioned above of the molecular dynamics of the pathways are needed to establish pattern.
The model is put forward mainly to illustrate that very simple and reasonable assumptions about coupling of two signaling pathways lead to complex patterns. It is fairly clear how further complexities and refinements can be added, but the main point to be made is that such a combination of positive and negative feedback will lead to patterns very like those often invoked in the past to model living systems (e.g., Murray, 1990). It is worth noting that the time independent small amplitude version of the equa-tions (A.1)-(A.4) are the same as those used by Murray (1981) to mimic animal coat patterns. Cummings and Strickland (1998) show how they also lead to the most prominent of the phyllotactic plant patterns.
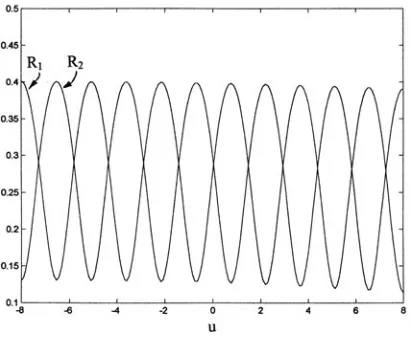
An example of a time independent (∂/∂t = 0) numerical solu-tions of the present model on a fixed geometry is shown in Fig. 1. Here the solution is shown in axial-symmetry on a cylinder of length ‘L’. The form of the ‘N.L.’ (nonlinear) term of eqns. (A.1) and (A.2) is taken as of the Hill form in calculation of the figure, as well as all subsequent figures. The explicit form of ‘N.L.’ used is given
in Appendix A. Further discussion of numerical solutions will be given in a later section, when pattern is coupled to geometrical deformations.
Figure 1 is favorably viewed in the context of recent results. Larsen et al. (2003) have found that in the developing Drosophila embryo, the epidermis becomes transiently divided into a series of segments, each with a deep groove that marks an anterior and posterior edge. Analysis of mutants indicates that groove forma-tion requires the transcripforma-tion factor Engrailed and the morpho-gens Hedgehog and Wingless. Hedgehog signaling is required posterior to the boundary but is repressed by Wingless anteriorly in order to prevent a boundary from forming on the wrong side of Engrailed expressing cells. Prud’homme et al. (2003) have found that Engrailed and Wingless are also expressed in epidermal cells on opposite sides of boundaries defining morphologically similar segments during the development of a primitive annelid, a differ-ent phyla. These two authors are pointing to molecular and morphological similarities suggesting a segmental unit body plan which may have evolved from a common ancestor.
Coupling pattern to geometry
This paper is also part of a continuing effort to develop mathematical modeling of shape changes of epithelial sheets. Interest is also on a theoretical understanding of the possible origin of phyla (Valentine, 2004), to which this present work aspires to be a modest, albeit unique, contribution. The emphasis here is on developmental constraints; the existence of a finite universe of possible basic body plans sets the stage for subse-quent winnowing by adaptation (Maynard Smith et al., 1985).
When any cell changes shape or size, it affects and is affected by neighboring cells. Use of the term ‘cell’ here describes rather the average over a small group of biological cells, since it is usually not feasible to follow the complicated gyrations of a single cell as it changes shape and slides around its neighbors in the epithelial sheet. We think rather of taking an average over a small (∼5-10) subset of cells in all that follows.
Change of shape of the epithelial sheet is most economically described by embedding a coordinate system on the middle surface bisecting the sheet of (in general, variable) thickness ‘h’. Thus, any change in local cell shape or size is accompanied by a change in the geometry of the embedded coordinate system. (Here we use the convention that patterns ‘belong’ to the animal, while coordinates are the free choice of the observer). This provides a model allowing a direct and straightforward represen-tation of the influence of pattern on surface and also of surface on pattern. The local apical and basal areas and cell heights at each point on the surface are the three relevant parameters for describ-ing the surface (Cummdescrib-ings, 2001, 2005). The pattern guiddescrib-ing this curved (middle) surface is thought of as provided by coupling of two signaling pathways, as described in the last section.
There are a number of interesting previous efforts to describe epithelial shape changes. Four examples are Jacobson et al. (1986), Green and Baxter (1987), Spirov (1993) and Beloussov (2003), These studies differ from the present in that (e.g.) they do not embed a coordinate system in the animal epithelial surface. A biological pattern mechanism implies geometry. Equations (A.1) and (A.2) contain the ‘Laplacian’ operator. This operator contains much of the geometrical information. The Laplacian is
often called the ‘Beltrami’ operator when it is to be taken on a curved surface as at present. It contains the surface metric coefficients, crucial in describing a curved surface.
For simplicity, but without loss of generality, coordinates will always be drawn on a surface so that every surface is covered by a network of (very) small squares, with such squares varying in
size over the surface. Only on a flat surface may the small squares be taken as all equal in size. The surface being referred to will be the middle surface bisecting an epithelial sheet of (in general) varying thickness. Appendix B discusses several aspects of geometry on a curved surface applicable to the present discus-sion. See also Cummings (2001, 2004, 2005) for a more detailed discussion.
In these special orthogonal ‘conformal’ coordinates (u, v) the Laplacian takes the form
∇ = ∂ ∂ + ∂ ∂2
2 2 2 2
/ /
( , )
u v
g u v . (3.1)
The area of each small square on the surface is given by dA = g(u,v)•du•dv and g(u,v) always has dimensions of area.
Now it is apparent that the model of eqns. (A.1)-(A.4) is not closed or determined until an equation is given for the geometry factor (or ‘metric’ function) ‘g(u,v)’ which always appears in the Laplacian. Gauss and others have given such an equation as the highly nonlinear second order differential equation
∇2 = − ⋅
2
log( )g K (3.2)
The Gauss curvature ‘K’ and the Mean curvature ‘H’ are both required in order to specify a surface. These two quantities are now to be considered functions of the ‘morphogens’ R1,2 and their derivatives and particular model forms are discussed in Appendix B. When such functional relationships are given (Cummings, 2004, 2005) this closes the set of slowly varying “time-indepen-dent” eqns., namely eqns. (A.1) - (A.4) (with ∂/∂t = 0) when combined with eqn. (3.2). These together constitute three sec-ond-order nonlinear differential equations and must clearly be solved numerically.
Emphasis should be put on the important point that there are two time scales considered. The first, the ‘fast’ time scale, in-cludes the biochemical reaction rates and thus inin-cludes the ∂/∂t terms on the l/h/s of eqns. (A.1) and (A.2). Slower interactions, such as transcription factor/gene, Golgi and endoplasmic reticu-lum interactions, or those involving cell division and growth, are not included in the ‘fast’ time regime. Including such (∂/∂t) terms in eqns. (A.1) and (A.2) allows one to infer that the model gives spontaneous pattern activation from a zero level of morphogen (Cummings, 2004). When we exclude these two ‘∂/∂t’ terms, the ‘time independent’ version implies a slower time dependence governed by the overall rate of growth. These slower processes involve transcription and translation, growth and cell shape changes. This second and slower rate of change is parameterized in the present model simply as a change in time of the total surface area A(t). As noted below eqn. (3.1) or in Appendix B, this parameter A is given by an integral over every small square of the (middle) surface, that is
A t( )=
∫
dA=∫∫
g u v dudv( , ) (3.3)The parameter ‘A’ is put in ‘by hand’ in present numerical simulations as an increasing quantity and the model determines the region of growth implicitly.
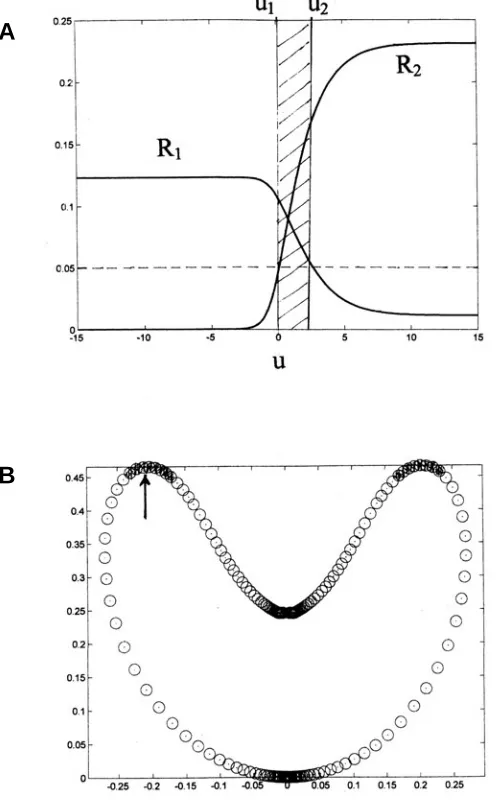
Fig. 2. Surface invagination showing stem cell region. (A) Two morphogens R1 and R2 as a function of the coordinate ‘u’ for axially symmetric geometry. Coupling of morphogens to geometry as described in the text and Appendix B leads to an invaginated sphere and an example is shown in (B). Here the figure corresponds to a total area of A = 7Ao, where Ao is the threshold sphere (or blastula) area below which the morphogen densities are zero. The figure is meant to illustrate the proposed region of stem cells. If a threshold is specified (taken as the same for both morphogens here), shown by the horizontal dashed line in (A), then there is a coordinate region ‘∆u’ (hatched) between u1 and u2 where neither morphogen dominates and differentiation is prevented. To the left of u1 one morphogen (R1) dominates, while on the right side of u2 the morphogen R2 dominates. (B) The corresponding postulated stem cell region as an annulus near the blastopore lip is shown as ‘hatched’. The arrow indicates a circle where the Gauss curvature is zero, after which it becomes negative with increasing coordinate u’.
A
It must be clear that the morphogens (the R’s) do not act directly to affect the cell shapes, or surface curvatures. Rather, it is imagined that they set in motion through the signaling pathway the downstream processes of transcription, translation and the subsequent production of several proteins that affect the cell shapes in the small area being averaged over. The model is then saying that these cellular deformations are functions of, or per-haps proportional to, the morphogen densities. There are at least three such protein factors, the three required to determine local apical and basal surface areas and cell heights (Cummings, 2001). Generally the local variation in cell heights will be important in determining the shape of epithelial surfaces, but such effects are not pursued in the present simple expository model.
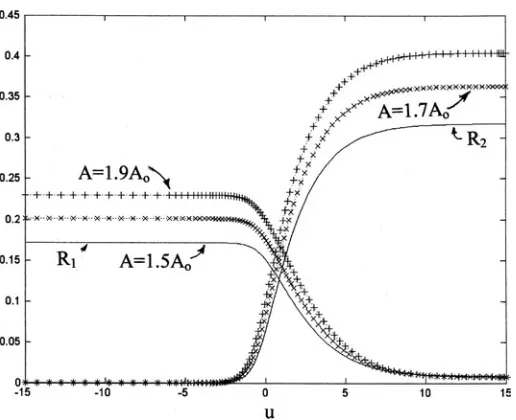
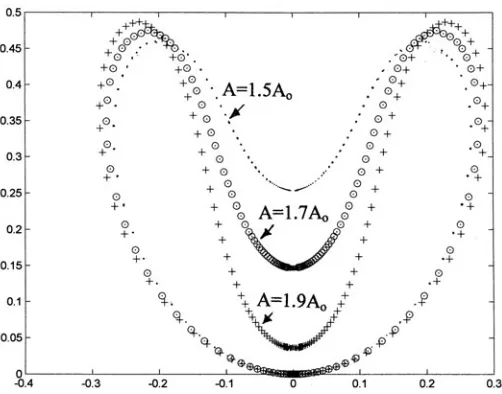
Figures 3, 4 and 5 show, respectively, the numerically calcu-lated morphogen densities, the corresponding Gauss and Mean curvatures and the corresponding axially symmetric surface in-vaginations (termed ‘gastrulation’ here). In each figure, three curves are shown, for the total areas A = 1.5Ao, A = 1.7Ao and A = 1.9Ao. The critical area Ao = 4πRo2 is the minimum sphere area
where the morphogens may first become nonzero, where (kRo)2
= 2. It is emphasized that the Gauss curvature K must become negative for invagination to occur (Cummings, 2004).
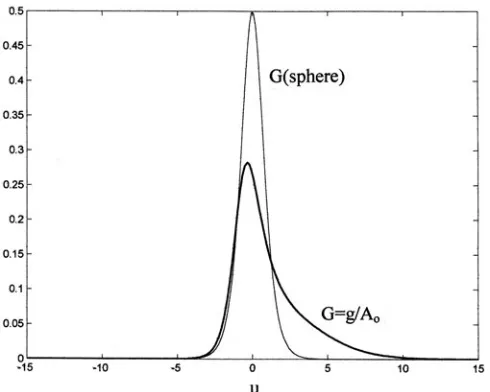
Figure 6 shows the normalized metric function G ≡ g(u)/A as a function of the coordinate ‘u’, for the corresponding Figs. 3–5. The metric function for the area A = 1.7Ao is compared with the same function for the sphere, where g/A=2/cosh2(u).
This section closes by noting a further prediction of the present model. Shape changes of necessity change the spatial distribu-tion of the morphogen densities, as implied by the ubiquitous presence of the Laplacian in the pattern generator. The active receptor sites, represented by the R’s, are coupled downstream
via the various molecules of the pathway to transcription factors in the nucleus. Thus we expect that an artificial spatial distortion during embryonic development, perhaps a squeezing under pres-sure, can change transcription in regions of an otherwise normally developing embryo. A change in phenotypic outcome is expected under such circumstances.
Observations on actual signaling pathways
Here are reviewed some recent findings to suggest elements of two different signaling pathways as prime candidates that may be best represented by the symbols of the model. Much evidence suggests that one symbol pair of the model (say, L1, R1) will often be represented by the ‘Wnt’ (wingless, ‘Wg’, in the fly) pathway. It is suggested that the Wnt pathway is coupled to any one of a number of possible other candidates. One example is the interac-tion between Wnt and Vg1 signaling pathways initiating primitive streak formation in early chick embryos, while a second is that between Wnt (Wingless (Wg) in the fly) and Hedgehog, affecting segmentation in Drosophila (Gerhart and Kirschner, 2001; Larsen et al., 2003; Prudhomme et al., 2003). Larsen et al. (2003) and Prud’homme et al. (2003) were already mentioned in the last paragraph of the section entitled "The pattern". Wikramanayake et al. (2003) have indicated an evolutionary ancient role for Wnt signaling and β-catenin in early pattern formation. Yet another example is the combination of a dorsal signal provided by the BMP4 homologue Decapentaplegic (Dpp) with a ventral signal provided by the Wnt homologue Wingless (Wg) establishing the PD (proximal-distal) axis, in addition to organizing the dorsal-ventral appendage pattern (Galindo et al., 2002). Evidence from other arthropods and vertebrates suggest that this PD patterning mechanism is probably conserved and ancestral. Epithelial bud development is due to the combined action of Wnt and BMP (bone
Fig. 3. Morphogen change with total area. Figures 3, 4 and 5 each show the coupling of pattern to form in axi-symmetry for three different total areas A. Figure 3 shows the two morphogens R1 and R2 as a function of coordinate ‘u’. In Figs. 3 and 4, the solid line corresponds to a total area A = 1.5Ao, the circles to A = 1.7 Ao and the pluses to A = 1.9 Ao. Here Ao is the threshold total sphere or blastula radius below which no morpho-gen solution can exist. The maximum morphomorpho-gen amplitudes increase with increasing A.
Fig. 4. Gauss and mean curvatures. Gauss (K) and Mean (H) curvatures for the largest total area, A=1.9Ao. The Mean curvature is monotonic as a function of ‘u’ for all areas, while the Gauss curvature goes negative at the cusp of the blastopore lip (see Fig. 2). The negative region of Gauss curvature is a necessary occurrence in order to achieve invagination and the value of the Gauss-Bonnet integral from this circle over the invagi-nated surface region must be zero. At both ends of the coordinate interval, K = H2, as required. The area factor A
morphogenetic protein) signaling pathways. In this case, the β -catenin activated Lef1 transcription complex is combined with the ‘noggin’ inhibition of BMP signaling, leading to reduced produc-tion of the adhesion protein E-cadherin, the latter mediating cell-cell contacts (Jamora, 2003; Perez-Moreno, Jamora and Fuchs, 2003). Another most interesting example of Wnt signaling (and Wnt6 in particular) is that given by Bonner-Fraser and colleagues (Garcia-Castro, Marcelle and Bonner-Fraser, 2002). Neural crest cells are a pleuripotent, migratory population of cells that differen-tiate into an enormous array of cell types, tissues and organs in vertebrates. Wnt6 is both necessary and sufficient for instructing neural crest formation in the chick embryo. The present model suggests that it will turn out that a synergy between BMP and Wnt is required for neural crest formation. A further example is the coupling of Wnt to the Notch pathway, as often occurs in animal segmentation.
A molecular oscillator underlies vertebrate segmentation and involves the interaction of Wnt with the Notch pathway (Purnell, 2003; Pourquie, 2003). Apparently the Notch pathway lies at the heart of the vertebrate oscillator, although there has been one cycling Wnt gene uncovered also, namely the Wnt inhibitor gene axin2. Notch is not involved in Drosophila segmentation, although it is involved in other arthropods. This suggests that vertebrates and arthropods may have shared a common ancestral segmen-tation program with Wnt/Notch signaling at the core and parts of this program was lost in particular descendant lineages such as Drosophila (Stollewerk, Schoppmeir and Damen, 2003).
It also seems possible that, besides the possibilities mentioned just above, there may be more than one version of the Wnt ligand protein (and receptor), since Wnt ligand is known to associate with lipids and become hydrophobic. Then it may be possibly think of ‘Wnt1’ and ‘Wnt2’ in this case as the two ligands of the model
(Willert et al., 2003).
To use a mechanical analogy, the Wnt pathway seems to act as a sort of permissive gate, perhaps a sort of ‘main drive shaft’ off of which other ‘shafts’ are driven or interact. The ‘Wnt’ pathway may often be looked on as a sort of primal pathway, participating along with a handful of other pathways (e.g., Hedgehog, BMP, TGF, EGF and Notch in early development of an organism (Cooper, 1997; Gerhart and Kirschner, 2001). Cell signaling via the Wnt ‘Frizzled’ receptor has evolved to considerable complex-ity within the metazoans. The Frizzled–dependent signaling cas-cade comprises several branches, whose differential activation depends on specific Wnt ligands, Frizzled receptor isoforms as well as the cellular context (Wodarz and Nusse, 1998; Tetsu and McCormick, 1999; Niehrs, 2001; Taipale and Beachy, 2001; Moon and Shaw, 2002; Nelson and Nusse, 2004). For example, in Xenopus laevis embryos, the canonical β-catenin pathway contributes in a crucial way to the establishment of the dorsal-ventral axis, involving interaction between the Wnt/β-catenin ‘canonical’ branch and a Wnt/Ca2+ branch. Mutations in the
protein APC, a key regulator in the Wnt pathway, (Peifer, 1996) leads to accumulation of β-catenin, which in turn activates genes which respond to transcription factors of the TCF/LEF family, with which β-catenin interacts (Tetsu and McCormick, 1999).
Members of the large Wnt family of proteins control many developmental processes, including a pathway involving cell adhesion (Niehrs, 2001). This pathway is a crucial factor in construction of the colon (Peifer, 2002). Of interest from the present point of view of the model is the non-canonical ‘fast’ pathway, in contrast to the one that goes through the nucleus, this ‘fast’ pathway bypassing the nucleus altogether.
Signaling pathways are accompanied with their modulating ‘G’ proteins (GTP and GDP), the G proteins likely playing the role of the ‘switches’ of the model. It is proposed that the ‘switch’ activity (modeled by the βR2 term in eqn. (A.1) and the αR1 term of eqn. (A.2)) is likely provided by the small guanosine triphosphatases (GTPases and especially Rho). GTPases are molecular switches that use a simple biochemical strategy to control complex cellular processes. They cycle between two conformational states; one bound to GTP (the ‘active state’), the other bound to GDP (‘inactive state’) and they hydrolyze GTP to GDP. In the ‘on’, or GTP state, GTPases recognize target proteins and generate a response until GTP hydrolysis returns the switch to the ‘off’ (GDP) state. This idea has been elaborated throughout evolution, with a mammalian cell containing several hundred GTPase switches. The Ras super-family of GTPases are master regulators of numerous aspects of cell behavior. These small monomeric GTPases fall into five major groups: Ras, Rho, Rab, Arf and Ran. Rho GTPases are an important example (Etienne-Manville and Hall, 2002). They participate most importantly in the regulation of cell polarity. Typical epithelial cells, such as those of interest in the present model and such as (e.g.) those lining the colon and also forming the Drosophila wing, form monolayers of packed cuboidal cells with specialized cell-cell contacts and a distinctive asymmet-ric distribution of proteins at the basolateral and apical mem-branes. It is these (apical to basal) asymmetrically distributed proteins which largely determine cell shape and thus the epithelial surface shape and are then most interesting from the point of view of the model here.
The GTPases of course have their regulators. A most
tant example, Moesin, acts antagonistically to the Rho pathway to maintain epithelial integrity. In Drosophila, Moesin functions to promote cortical actin assembly and apical-basal polarity. Cells lacking Moesin lose their epithelial character and adopt invasive migratory behavior. When Moesin is mutated in the fly imaginal epithelium, a single layer of tall columnar cells with an obvious apical basal polarity, their cells lose intercellular junctions and epithelial polarity and are extruded basally from the epithelium. Apparently Moesin facilitates epithelial morphology not by provid-ing an essential structural function but rather by antagonizprovid-ing activity of the small GTPase Rho, thus regulating cell-signaling events that affect actin organization and polarity (Speck et al., 2003).
Studies of Xenopus embryos and cultured cells show that Wnt/ Frizzled signaling activates the cytoskeletal regulator Rho through activation of Dishevelled. Dishevelled is a multifunctional protein that regulates cell polarity through the non-canonical pathway, but also regulates cell fate through the canonical Wnt/β-catenin pathway. These results link Wnt/Frizzled signaling during epithe-lial sheet movement to the Rho family of GTPases (Keller, 2002). The non canonical Wnt/Frizzed pathway leading to production of further Wnt ligand (represented by the αR1 term in eqn. (A.1) and the βR2 term of eqn. (A.2)) seems by best present guess to go by way of Wnt/Frizzled → G protein → Ca2+→ PKC → Cdc42 →?
(Keller, 2002; Harwood and Braga, 2003). The conjecture is that this is the pathway that turns off the release of ‘2’ ligand at the same time that it stimulates release of ‘same’ ligand L1 and symbolized by terms of the r/h/s of eqns. (A.1) and (A. 2). A similar ‘2’ pathway is conjectured to operate in an analogous way to turn off release of ligand ‘1’, at the same time as stimulating release of the already stored ligand ‘2’. Such a pathway has as not been
described experimentally, but is predicted by the present model. The density R1 of the model then represents most often a ‘Wnt+Frizzled’ (ligand + receptor) combination, while L1 sents unbound (‘free’) Wnt ligand. Then the ‘2’ subscript repre-sents the second pathway coupled to Wnt, e.g., the Hedgehog (Hh), BMP, TGF or Notch pathway (or homologues). The model does not however restrict itself to Wnt as one of the pathways and any other pair may have evolved to produce patterns in the manner described.
Speculations on non-axial symmetry & stem cells
Numerical simulations reported here (Figs. 1–6) all relate to surfaces with axial symmetry. The epithelial sheet thickness ‘h’ has also been taken as constant, for simplicity, in this first attempt. Sheet thickness is not be shown in the surface figures and the ratio h/√A <<1, where A is total area.
A topic not mentioned previously concerns what occurs when surfaces come into contact. Such contact is apparently imminent for total area A = 9Ao shown in Fig. 5. Three main scenarios may occur upon contact, not dealt within the context of the model. The first situation occurs when an inner layer of (mostly) non-cellular mesoglia, such as occurs in cnidaria, forms a separating layer between two epithelial surfaces, between ectoderm and endo-derm. In this case, the two surfaces are separated by this mesoglia. A surface boundary condition on the geometry is obvious, namely that the two surfaces, endoderm and ectoderm, do not interpenetrate. This may be accompanied by a (new) boundary condition on the morphogens. Morphogen values may become ‘frozen in’ in local region(s) near their maximum ampli-tudes, initiating the next phase of development.
A second scenario occurs when two surfaces touch and there is induction. The contacting cells may exchange pattern informa-tion, e.g., one sheet may adopt the pattern specification of the second in a small region, this region acting as a new boundary condition for ongoing development. Another possibility is that the touching regions will take on an average of the morphogen values of the two touching regions at that point. This second scenario is not pursued further here.
A third possibility is that one surface will coalesce with the first in a small region, say at the animal and vegetal poles and a new orifice arises there. Such is imagined to occur if there is contact at the two ‘pole’ regions in Fig. 5, that is, when the extreme values near -∞ and +∞ of the coordinate ‘u’ come together. This will lead to a second orifice (an anus in the case of the protostome, a mouth region in the case of a deuterostome), at the opposite end from the original blastopore orifice. Then the topology of the geometry is abruptly changed (Appendix B), when the Gauss-Bonnet integral changes from 4π (of a sphere topology) to zero, the value for a topological ‘donut’. The first ‘through-gut’ animal has arrived. Bilateral symmetry must also accompany the attainment of the through-gut, as well as mesoderm, to herald the arrival of a deuterostome or protostome, the two major phyla groupings besides Cnidaria. The new boundary condition on pattern and form in both cases, deuterostome and protostome, must give doubly periodic solutions in both coordinates ‘u’ and ‘v’ on the topological donut.
Then in general, when surfaces come into contact, new bound-ary conditions are set up, new patterns begins to emerge, with a
concomitant geometrical change, both pattern and shape trans-forming to lower symmetry.
The present model tempts a speculation regarding the pattern-ing of stem cells. Development of mesodermal tissue in the case of the bilaterals argues for a three-way patterning mechanism. Continuous generation of stem cells as occurs in the Cnidaria is also motivation to consider a tripartite pattern. Figure 2 aids explication of the idea. Figure 2a shows a threshold of activation of the two morphogens R1,2 by a dashed line (and thresholds for both are assumed the same for simplicity). Each morphogen, when below the threshold, loses its capacity to effect differentia-tion. A threshold then divides the space into three regions. The leftmost (u < u1) is a region where R1 is the sole active morphogen, while the rightmost region (u > u2) is where R2 is the sole active morphogen. The region between these two, between coordinates u1 and u2, where both morphogens are active, corresponds to a presumptive (what we will call) ‘stem cell’ region, a region where neither morphogen is able to imprint its unique cellular differentia-tion, due to the presence of the other. In the present invagination (or primitive ‘gastrulation’) example shown in Fig. 2a and Fig. 2b, this ‘stem cell’ region is near the arrow shown in the Fig. 2b, an annular region corresponding to negative Gauss curvature. In more advanced animals (the bilaterals, e.g., protostomes) these cells may in many cases be precursors of cells of different adhesiveness from that of ectoderm and endoderm, cells that detach from the gastrula and migrate into the interior of the blastula to give rise to mesodermal tissues. In more primitive animals, those of only two cell layers and without mesodermal tissue, (Cnidaria or Ctenophora-like) the ‘stem cells’ may become extruded outward from the surface to initiate primitive tentacles. A third possibility is that these cells may become detached and act as primitive sex cells, being emitted into the surrounding watery medium in the case of most primitive cnidaria-like animals. The three tissue types, endoderm, ectoderm and mesoderm (‘meso-derm/exoderm’?) have different adhesive affinities, as is invari-ably observed at any rate in the case of bilaterals.
In Appendix C we ask what one may expect from numerical solutions that push beyond the axi-symmetric ones presented in Fig.s 1–6. These non-axially symmetric patterns are obtained by two simplifications, allowing analytical solution. First, the geom-etry is prescribed as a (thin) cylinder inside of a cylinder and second, the pattern equations are those corresponding to small morphogen amplitude. It is expected that as one pattern of a given symmetry becomes extinguished, a second solution of lower symmetry will begin to arise on an area of appropriate size and that new pattern will always be initially of small amplitude. We propose that such simplified solutions will give a reasonable insight into certain aspects of the general nature of more sophis-ticated (but very more difficult) non-axially symmetric numerical solutions obtained when geometrical changes are coupled to pattern changes as the animal grows.
First, the expected patterns are examined if boundary condi-tions are such that the morphogen densities become ‘frozen in’ at the region of the two ‘poles’ of Fig. 5, as they are brought into close proximity. In the simplified geometry, this means that the morpho-gens are taken to have fixed values on the two disc- shaped end regions that close each cylinder end and are nearly in contact. The presumption is that the numerical results of prescribing these boundary conditions on the two ‘polar’ regions of Fig. 5 would yield
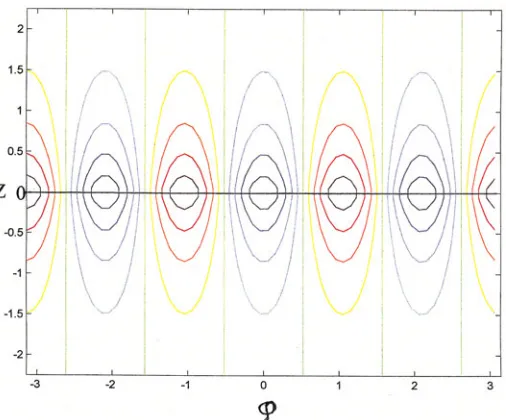
similar results as for the simplified cylindrical geometry, namely periodicities around the mouth region. The solutions of Appendix C leads to a periodic structure around the mouth region, with (exponential) decaying gradients of the two morphogens occur-ring in alternating angular regions as one proceeds away from the head region. This solution is shown in Fig. 7. This second patterning follows in time the original “inside-outside” gastrulation patterning of Fig. 5 and is superposed on it. The radius of the mouth at z = 0 is proportional to the number of tentacle positions, or the proto-tentacles. Stem cells are produced in the interstices of the two morphogens shown as the animal grows (L, r increase), in the regions where the two morphogens compete for domi-nance.
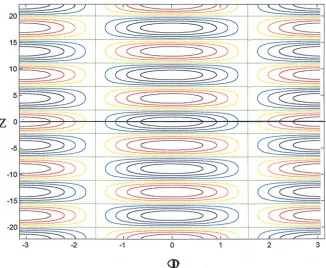
The horizontal line shown at z = 0 in both Figs. 7 and 8 denotes where the figure is to be folded over so that the maximum z value coincides with the minimum z value, giving the new inside and outside pattern, superposed on the original. Next, the two vertical sides at angles ϕ = +π and –π are to be joined, giving a cylindrical structure in both cases.
A second example, giving a view of the general direction of development expected on basis of the model, is provided by the ‘through-gut’ geometry. Here we imagined that the ectoderm and endoderm meet at the ‘poles’ in Fig. 5, but now the surfaces fuse, cell death occurs so that an opening is created at this point. The Gauss-Bonnet integral of eqn. (B.9) changes from 4π to zero and the new structure is topologically that of a ‘donut’ (or a ‘sphere with one handle’). In Appendix C it is argued that if the structure of Fig.
5 is sufficiently elongated, (the donut is now envisioned as elongated along the axis) and in the simplified cylindrical geom-etry, L (length) >> r (radius), a bilateral, segmented protostome or deuterostome results, a “Pre-Cambrian worm”. Segment number ‘m’ will increase with length, kL ∼ m. Figure 8 shows the resulting pattern on both the inner and outer cylindrical structure according to the model equations. The Gauss-Bonnet integral of eqn. (B.9) is +4π on the outer surface and –4π on the inner portion of the surface.
Both patterns, of Figs. 7,8 will be ‘tripartite’; there will be regions in which both morphogens compete more or less equally, but neither dominates. A (much smaller) region separates the segments, regions where each morphogen exerts nearly equal dominance and neither morphogen will effect differentiation in this region. Stem cells (for want of a better term), undifferentiated cells, will then occur in this region of competing morphogens. In the most primitive ‘urworm’, these stem cells may next migrate inward between the two layers to first form mesodermal muscle or nerve processes. Previously, stem cells had also migrated from the blastopore region (c.f. Fig. 2) to form an inner mass that also formed into mesoderm in the case of the protostome. Such a structure, as mimicked by Fig. 8, is adaptive in that forward motion of the animal is facilitated, a long gut allows for most complete digestion of single-celled animals and plants in its path along the sea bottom, and stereo sensors will evolve. The blastopore
opening is the mouth in the case of the protostome and undi-gested remains are extruded from the new second opening, the anus. It is generally agreed that there are about nine protostome phyla, the largest of which are the Mollusca, Annelida (segmented worms) and Arthropoda (which includes insects).
Another monophyletic group of phyla besides the protostomes is the deuterostomes (e.g., Futuyma, 1998), in which the blasto-pore becomes the anus after formation of the second opening, which becomes the mouth. Embryonic cleavage is radial instead of spiral and a coelom develops from a series of evaginations (pouches) of the primordial gut. There are four deuterostome phyla, the largest of which are Chordata (includes the verte-brates) and the Echinodermata (e.g., starfish, sea urchin). Unrav-eling the complicated early history of the Echinoderms remain highly controversial (e.g., Smith, 2004).
Discussion and speculation
It is of much interest to extend the numerical computations to include the case of non-axially symmetric ‘animals’. Appendix C gives an admittedly crude first attempt toward guessing the general direction of such calculations. A numerical model is to be desired, taking into account the coupling of pattern to shape and going beyond the small amplitude pattern regime into the nonlin-ear.
Fig. 8. Proto-protostome. This figure illustrates a geometry topologically equivalent to a donut. An inner cylinder is joined at either end to a (slightly larger radius) outer cylinder allowing (approximate) analytic solution. The figure is to be viewed as if the z coordinate is folded over at z = 0 so that z = 22 coincides with z = –22, to give both an inner and outer (‘epidermal’) layer. Since the figure is periodic in the angle ‘ϕ’, the vertical axes at –π to +π are to be viewed as joined. A most primitive protostome is envisioned, bilaterally symmetric with only three ‘segments’ and a ‘through-gut’. Such an animal may reasonably be assumed to be adaptive. The pattern shown follows in time an original pattern delineating the ectoderm (e.g., z > 0) from endoderm (z < 0). Endoderm arises later from stem cell regions.
There are six first order differential equa-tions included in the present time-independent computations, namely R1, R2, g and their three derivatives with respect to coordinate ‘u’. In generalizing the calculations to non-axial sym-metric cases, the present single line of the variable ‘u’ (where approximately –15 < u < +15 in practice) must be expanded to a rectangular grid in the two variables (u, v). The present solution assigned six values to each little square along ‘u’, all squares of the same size. In the non-axially symmetric case, this must be ex-panded to assignment of nine variables (three variables and their six derivatives) to each square of the rectangular grid, clearly involving much more muscular computation than at present. When one goes to the non-axial sym-metry case, the coordinate ‘v’ can no longer be interpreted as an angle, but the morphogens and ‘geometry g’ can still satisfy periodic bound-ary conditions in this coordinate. The present computations hope to show feasibility and to point to the direction of future work.
The present numerical calculations were all carried out with Student MatLab and the code is available by request from the author.
transcription and gene activation in the nucleus.
The results of Wikramanayake et al. (2003) indicate a key role for the Wnt/β-catenin pathway in the evolution of axial asymme-tries and endoderm formation in an ancestor that existed before the evolution of the mesodermal germ layer. The observation that selective accumulation of β-catenin occurs at one embryonic pole in both cnidarians and deuterostomes indicates that this mecha-nism evolved early in animal development. It is speculated that this was a key player in an innovation leading to the initial segregation of germ layers, the segregation of endoderm from ectoderm, from a single layered blastoderm during earliest animal evolution.
It is suggested by the present patterning mechanism that an adaptive mutation occurred near the critical Precambrian-Cam-brian boundary when single celled eukaryotes gave rise to multi-cellular animals. The evolutionary ‘discovery’ of a coupling mecha-nism between two different signaling pathways (e.g. prototypes of Wnt and Hedgehog, or Wnt and BMP) could have triggered the separation of germ layers, necessarily accompanied by an invagi-nation. Such an initial invagination from a sphere enclosed by a single layer of cells, a blastula, would necessarily occur in con-junction with a number of other felicitous circumstances. These include a suitable level of oxygen, a lack of predators, a plethora of single-celled prey, as well as the existence of very sophisti-cated eukaryotic cells. The endoderm of the multicellular organ-ism becomes a primitive crucially important digestive region. The plant Volvox may lead one to think that sex may have already developed before the appearance of metazoans.
It is clear that formation of multicellulars giving rise to metazoa must consist of more than a mechanism joining cells by an adhesive mechanism. Such would lead very most likely to a non-adaptive clump. The most primitive animal is envisioned rather as consisting of a closed epithelial sheet adept at catching and ingesting prey. The plant Volvox may have had a non-plant analogue, now extinct, which first had attractive cell-cell interac-tions and thus signaling. Separation of a blastoderm into endo-derm and ectoendo-derm via a proto-gastrulation epithelial sheet move-ment provides critical factors of such a first and most primitive animal. Another crucial and necessary factor must be replication, by either sex or budding.
The key question of propagation, whether by budding or sex is a complex one, not addressed in the present work. Many other questions and puzzles are perplexing, for example, the role of the HOX genes in development. These regulatory genes play some undetermined role in distinguishing segments from one another in an animal more advanced than the most primitive worm in which all segments (except at or near each end called the head and tail), are initially the same.
Another fundamental unresolved puzzle, in the context of the present model, is how one pattern function is picked out from another possible one of the same symmetry. This arises as one pattern of higher symmetry decays away, to be replaced by one of lower symmetry. It is hinted here that the coupling of pattern to geometry may act, at least partly, to pick out particular patterns from among those allowed. In the example of the ‘proto-worm’ of Fig. 8, it was the particular geometry, i.e., a length greatly exceeding the constrained radius, that served to at least partially select a particular pattern of segmentation and bilaterality.
Of course, Darwinian adaptation (Futuyma, 1998) must be a
crucial factor, if not the crucial one, in pattern choice, picking out those most adaptive from those possible. Perhaps this process of ‘picking a pattern’ by coupling pattern to geometry is a general result, but only further numerical work will tell. If geometry picks out pattern, what then picks out the particular very early geom-etry? Genes and adaptation is the apparent answer. Adaptation can only be put into the model ‘by hand’, involving as it does the external environment. But the present work argues for a restricted universe of possible basic animal plans.
How then do the genes determine animal shape? At each stage of development, a pair of interacting signaling pathways activates genes according to a pattern. These genes in turn produce a patterned trio (at minimum) of specific proteins that act to specify the three required cell parameters needed to uniquely specify shape. These parameters are the local apical area, basal area and cell height of the epithelial sheet at each point of the surface. Many specific intermediate steps are omitted in this glib answer, steps that are fast becoming elucidated in various labs. The genes are central to all living processes of course, but we mean to highlight here the interconnectedness of genes, signal-ing pathways and morphological development.
Another important question implicit in the model concerns the cause of the demise of a particular pattern of given symmetry as overall growth proceeds. One possible answer from the point of view of the model is that since only non-negative morphogen values and geometry ‘g’ solutions are allowed, specified bound-ary conditions only allow the morphogen amplitudes to grow to a fixed extent. As growth proceeds and total area ‘A’ increases, in any given spatial region, amplitude of one morphogen increases while the second decreases. Since this second morphogen can-not become negative, this may provide a cutoff, at which point the next allowed solution – of lower symmetry and originally small amplitude – will come into play as the first pattern disappears. Also possible is the role of the G protein switches in terminating a given pattern when the amplitude become too large. Future work must also investigate the role of the Gauss-Bonnet theorem in providing constraint on possible patterns and shape.
Acknowledgments
I wish to thank Drs. A. K. Rajagopal and J. R. Johnston for critical reading of the manuscript and Dr. Brian Goodwin for his support.
References
BELOUSSOV, L. (2003) A geometrico-mechanical model for pulsatile morphogen-esis, Computer Methods in Biomechanics and Biomedical Engineering 6:
53-63.
COOPER, G. (1997) The Cell: a Molecular Approach (Sinauer Assoc., Sunderland, Mass.).
CUMMINGS, F.W. and STRICKLAND, J.C., (1998) A model of phyllotaxis, J. Theor. Biol. 192: 531-544.
CUMMINGS, F.W. (2001) The interaction of surface geometry with morphogens, J. Theor. Biol., 212: 303-313.
CUMMINGS, F.W. (2004) A model of morphogenesis, Physica A 339: (3-4),
531-547. (Preprint: arXiv: physics 0308030).
CUMMINGS, F. W. (2005) Interaction of morphogens with geometry, Physica A
355: 427-438.
DoCARMO, M. (1976), Differential Geometry of Curves and Surfaces, (Prentice Hall, Englewood Cliffs, New Jersey).
FUTUYMA, D.J. (1998) Evolutionary Biology (Sinauer Assoc., Sunderland, Mass.)
GALINDO, M., BISHOP, S., GREIG, S and COUSO, J. (2002) Leg patterning by proximal-distal interactions and EGFR signaling, Science 297: 256-259.
GARCIA-CASTRO, M., MARCELLE, C. and BONNER-FRASER, M. (2002) Ecto-dermal Wnt functions as a neural crest inducer, Science 297, 848-851.
GERHART, J. and KIRSCHNER, M., (2001) Cells, Embryos and Evolution (Blackwell Science, Oxford, N.Y.).
GORDON, R. (1999) The Hierarchical Genome and Differentiation Waves: Novel Unification of Development, Genetics and Evolution, (Singapore & London: World Scientific & Imperial College Press).
GREEN, P. and BAXTER, D. (1987) Phyllotactic patterns: Characterization by geometrical activity at the formative region, J. Theor. Biol. 128: 387-395.
HARWOOD, A. and BRAGA, V. (2003) Cdc42 & GSK-3: signals at the crossroads,
Nature Cell Biol. 5: 275-277.
HAYASHI, T. and CARTHEW, R. (2004) Surface mechanics mediate pattern formation in the developing retina, Nature 431: 647-652.
JACOBSON, A., OSTER, G., ODELL, G and CHENG, L. (1986) Neurulation and the cortical tractor model for epithelial folding, J. Embryol. Morphol. 96:19-49.
JAMORA, C., DasGUPTA, R., KOCIENIEWSKI, P. and FUCHS, E. (2003) Links between signal transduction, transcription and adhesion in epithelial bud development, Nature 422: 317-322.
KOCH, A. and MEINHARDT, H. (1994) Biological pattern formation: from basic mechanism to complex structures, Rev. Mod. Phys. 66: 1481-1507.
KELLER, R., (2002) Shaping the Vertebrate Body Plan by Polarized Embryonic Cell Movements, Science 298: 1950-1954.
LARSEN, C., HIRST, E., ALEXANDRE, C. and VINCENT, J-P. (2003) Segment boundary formation in Drosophila embryos, Development 130: 5625-5635.
MAYNARD SMITH, J., BURIAN, J., KAUFFMAN, S., ALBERCH, P., CAMPBELL, J., GOODWIN, B., LANDE, R., RAUP, D. and WOLPERT, L., (1985) Develop-mental constraints and evolution, Q. Rev. Biol., 60: 265-287.
MEINHARDT, H. (1982) Models of Biological Pattern Formation (Academic Press, N.Y.).
MOON, R. and SHAH, K., (2002) Signaling polarity, Nature 417: 239-240.
MURRAY, J. D. (1981) A prepattern mechanism for animal coat markings, J. Theor. Biol. 88: 11-19.
MURRAY, J. D. (1990) Mathematical Biology, (Springer-Verlag, Berlin, N.Y.,).
NIEHRS, C. (2001) Solving a sticky problem Nature 413: 787-788.
NELSON, W. and NUSSE, R. (2004) Convergence of Wnt, β-catenin and cadherin pathways, Science 303: 1483-1487.
PEIFER, M. (1996) Regulating Cell proliferation: As easy as APC. Science 272:
974-975.
PEIFER, M. (2002) Colon Construction, Nature 410: 275-277.
PEREZ-MORENO, M., JAMORA, C. and FUCHS, E. (2003), Sticky business orchestrating cellular signals at adherens junctions, Cell 112: 535-548.
POURQUIE, O. (2003) The segmentation clock: converting embryonic time into spatial pattern, Science 301: 328-330.
PRUD’HOMME, B., de ROSA, R., ARENDT, D., JULIEN, J-F., PAJAZITI, R., DORRESTEIJN, A., ADOUTTE, A., WITTBRODT, J. and BALAVOINEal, G., (2003) Arthropod-like expression patterns of engrailed and wingless in the
Annelid platynereis dumerilii suggest a role in segment formation, Curr. Biol. 13:
1876-1881.
PURNELL, B. (2003) To every thing there is a season, Science 301: 325.
REINHARDT, B., BROUN, M., BLITZ, I and BODE, H. (2004) A BMP5-8 orthologue acts during axial patterning and tentacle formation in hydra, Dev. Biol. 267:
43-59.
SCHLOSSER, G. and WAGNER, G.P., (2004) Modularity in Development and Evolutiom, (University of Chicago Press).
SKROMME, I. and STERN, C. (2001) Interactions between Wnt and Vg1 signaling pathways initiate primitive streak formation in early chick embryos, Proc. Natl. Acad. Sci. USA 128: (15) 2915-2927.
SMITH, A. B. (2004) Echinoderm roots, Nature 430: 411-422.
SPECK, O., HUGHES, S., NOREN, N., KULIKAUSKAS, R. and FEHON, R. (2003) Moesin functions antagonistically to the Rho pathway to maintain epithelial integrity, Nature 421: 83-86.
SPIROV, A. (1993) Changes in initial symmetry in the pattern-form interaction model of Sea Urchin early development, J. Theor. Biol. 161: 491-504.
STOLLEWERK, A., SCHOPPMEIR, M. and DAMEN, W. (2003) Involvement of notch and delta genes in spider segmentation, Nature 423: 863-865.
TAIPALE, J. and BEACHY, P.A. (2001) The Hedgehog and Wnt signalling path-ways in cancer, Nature 411: 349-354.
TETSU, O. and McCORMICK, F. (1999) β-Catenin regulates expression of cyclin D1 in colon carcinoma cells, Nature 398: 422-423.
TURING, A.M. (1952) The chemical basis of morphogenesis, Phil. Trans. R. Soc. Lond. B, 237: 32-72.
VALENTINE, J. W., (2004) On the Origin of Phyla, (University of Chicago Press).
WIKRAMANAYAKE, A., HONG, M., LEE, P., PANG, K., BYRUM, C., BINCE, J., XU, R. and MARTINDALE, M. (2003), An ancient role for nuclear β-catenin in the evolution of axial polarity and germ layer segregation, Nature 426: 446-449.
(see also interesting references within).
WILLERT, K., BROWN, J., DANENBERG, E., DUNCAN, A., WEISSMAN, I., REYA, T., YATES, J. and NUSSE, R. (2003), Wnt proteins are lipid modified and can act as stem cell growth factors, Nature 423: 448-452.
WODARZ, A. and NUSSE, R. (1998), Mechanisms of Wnt signaling in develop-ment, Ann. Rev. Cell Biol. 14: 59-88. (see also www.stanford.edu/∼rnusse/ wntwindow.html).
Appendix A
Model of interacting signaling pathways
There are two simple elements of the model. Attention is focused on a small cluster of cells, ∼ five-ten, when use of such terms as ‘ligand density’ and ‘receptor density’ has meaning. The cells are to be thought of as comprising a closed epithelial surface, so that the densities of the model have dimensions of ‘number per unit area’. Variation of the morphogens (the R’s or L’s) along the apical-basal direction is not considered, or rather thought of as being an averaged value in this dimension.
First of all, each such ‘cell’, or rather cell cluster, produces ligand of like kind proportional to the level of receptor activation. Morphogen R1 stimulates production of L1, otherwise the process would be limited to a purely local one if “like-ligand” production were not induced, the particular cell in question then acting as a ‘sink’.
ligand production L2 is decreased and similarly for R2. The equations representing such a process are
∂
∂tL1= ∇D1 L + R − R +NL 2
1 α 1 β 2 ., (A.1)
∂
∂tL2=D2∇ L + R − R +NL 2
2 β 2 α 1 ., (A.2)
∂
∂tR1=C R L1 1 1−µR1, (A.3)
∂
∂tR2=C R L2 2 2−νR2. (A.4)
The first two terms in eqns. (A.1), (A.2) represent in the usual way diffusion of the ligands in the extracellular space. All parameters in the model (e.g., α, β, D1, C1, µ, ν) have positive values, as do also, of course, the densities L1, L2, R1 and R2. The terms αR1 in eqn.(A.1) and βR2 in eqn.(A.2) represent the production of ‘like’ ligand by the corresponding activated receptor. These same terms are used to represent the fact that activation of receptors of density R2 deactivate or turn off production of free ligands of density L1 and vice versa. A sort of ‘toggle’ is produced, where a region of high activation of one implies low activation of the second. The term NL on the r/h/s of eqns.(A.1) and (A.2) indicate that there are expected to be nonlinear additions to the toggle; saturation will set in for large enough values of either active receptor density.
The transmembrane receptors, which reside in the lateral cell plasma membrane, are relatively immobile. The respective acti-vated densities decay at rates µ and ν and this ‘decay’ returns the receptors to their inactive state. Two first terms on the right side of eqns.(A.3), (A.4) say that there is a positive rate of change of R1 or R2 proportional to both the density of empty receptor sites
(R R1, 2) and also to the density of free ligands at the particular
local cell site. The density of empty sites may be obtained from the expression
R1+R1=Ro+ηR1, (R0=const.),
where the last term on the r/h/s expresses the possibility that the total number of receptors of each type (e.g., ‘1’) increases with activation of that same type receptor and new (empty) receptors are thus added. Then the empty receptor site density may be written
R1=Ro(1−ε1R1), (0< ≤ε1 1,ε1≡ −(1 η) / Ro), (A.5)
and similarly for type ‘2’. The values ε = 1 (and η = 0), implies that there is no receptor augmentation ∼ R1, while ε∼ 0 implies either that there is a new empty receptor created for (almost) every one occupied, or that there are very many more empty sites than occupied ones. When eqn. (A.5) and the analogous equation for type ‘2’ is used in eqns. (A.3) and (A.4) to eliminate the unoccu-pied site densities, the model then comprises four coupled equations for four unknowns. The coupling from epithelial shape to morphogen and back, has not as yet been specified (cf. text in section entitled "Coupling pattern to geometry").
The small amplitude, time independent (∂/∂t = 0) version of eqns. (A1)-(A5) are simply the Helmholtz and Laplace equations
∇2 − + − =
1 2
2
1 2 0
(R fR ) k (R fR ) , (A.6) and
∇2 + =
1 1
2
2 2
2
0
(R /k R /k ) . (A.7)
The definitions k2 = k
12 + k22, f = β/α, k12 = αC1R0/(D1µ) and k22
= βC2R0/(D2ν) have been used. Several forms may serve to model the ‘N.L’ terms on the r/h/s of eqns. (A.1) and (A.2). The simplest and the one used in present simulations is to let
R1-(β/α)R2 → (R1-(β/α)R2)/(1+ ((R1-(β/α)R2)/c)2).
The constant ‘c’ is ∼1. Others forms will no doubt lead to other surface shapes for the invagination. The R’s hereafter stand for dimensionless quantities after division by Ro of eqn. (A.5).
Let us agree for simplicity to always draw coordinates on any surface so that a network of (very) small squares covers every surface, such squares varying in size over the surface. The surface being referred to will be the middle surface bisecting an epithelial sheet of varying thickness. Since coordinates are a free choice of the observer, this can be done. This simplifies the discussion, without losing generality. As an example, a sphere can be covered by small squares by transforming the usual spherical polar coordinates (θ, ϕ) to the new coordinates (u, v) by sin(θ) = sech(u) and ϕ = v; the coordinate v then defines the polar angles as before, but the coordinate u is no longer the azimuthal angle θ and in fact runs from -∞ to +∞ at the two poles. (The two mathematical points at the poles are excluded). We realize that when we are describing such surface deformations as invagina-tion from an original sphere, the usual polar coordinates are not suitable, while the new coordinates (u, v) can still serve very well. In these ‘conformal’ coordinates, a number of usual quantities can be given. The squared distance between to nearby points, the ‘Pythagoras theorem’ on a curved surface, is given by (e.g., doCarmo, 1976)
ds2 = g(u,v)•(du2 + dv2). (B.1)
An element of area on the surface is
dA = g(u,v)•du•dv. (B.2) The Laplacian operator is given by
∇ = ∂ ∂ + ∂ ∂2
2 2 2 2
/ /
( , )
u v
g u v . (B.3)
The factor g(u,v) (of dimension ‘area’) has no physical meaning except in combination with other quantities and this is generally the case for the coordinates as well, the latter serving merely as position ‘markers’. (To be precise, g is the component of a tensor). The point to notice is that the factor ‘g’ determining the geometry enters the pattern eqns. (A.1)-(A.4) via the Laplacian. The most familiar form of the Laplacian (sometimes called the Beltrami operator in curved space) is that of a flat space, when g ≡ 1, when the coordinates alone then measure distance. A simple example of g on a curved surface is that for a sphere, when g may be independent of the angular coordinate ‘v’ and has the expression g(u) = R2/cosh2(u), with -∞ < u < +∞. One goes from one such
‘conformal’ coordinate system to another by any ‘analytic’ trans-formation, while keeping the geometry the same.
Gauss long ago (∼1860) gave an exact equation for the ‘metric’ function g as determined by the Gauss curvature ‘K’. This is
∇2 = − ⋅
2
log( ( , ))g u v K, (B.4)
(where ‘log’ means base ‘e’).
Both curvatures, Mean (H) and Gauss (K) are necessary to describe a surface. It is a key element of the present model that the Gauss curvature, as well as the Mean curvature is considered to be a function of morphogens R1 and R2 and their first deriva-tives. We note that the both the Mean as well as the Gauss curvatures are necessary to describe a surface. The Mean curvature ‘H’ is the average of the two principal curvatures, while K is the product of these, so that it follows easily from their definitions that
K = H2 - D2. (B.5)
Here D is (by definition) the difference of the two principal curvatures divided by two, D ≡ (κ+ - κ-)/2. It has previously been shown (Cummings, 2001, 2005) that the Mean curvature ‘H’ at a point is simply proportional to the apical area minus the basal area in the surface divided by the sheet thickness ‘h’ at the particular point, i.e.,
H = (1/2)(A - B)/h. (B.6)
The dimensionless quantities ‘A’ and ‘B’ (0 < (A, B) < 4) are the apical and basal areas Aa and Ab each divided by a (small, square) area element Am in the middle surface, so that (e.g.) A = Aa/Am. In terms of A, B and h, the Gauss curvature is given by (h/2)2K =
((A+B)/2-1). Equation (B.6) motivates one to assume that the Mean curvature H be taken as a linear function of the (dimension-less) morphogen difference (R1- (β/α)R2), giving
H= 4π A rea⋅ + ⋅(1 λ1 (R1−( / )β α R2)) (B.7)
Here λ1 is a ‘geometry’ parameter of the model, (and typically taken as ∼ 5→10 in numerical work). The factor (4π/Area) under the square root arises for the following reason. When the morpho-gens (the R1,2) are zero and the size of (say) the sphere radius is below the critical size rc needed to give rise to a spontaneously growing solution, then H must be given by its sphere value for all smaller radii, namely H = 1/r, where r < rc and the morphogens R1,2 = 0.
In a more complete model it would be necessary to know (or model) how the cell heights ‘h’ vary over the epithelial surface with morphogen and models of this behavior can be envisioned. In the present numerical work, the cell heights are held constant as a first cut. In the numerical work they are taken so that h/(Area)1/2
= 0.1.
Now that a reasonable guess has been made for H in eqn. (B.7), another guess must be made for the factor ‘D’ of eqn. (B.5) to give K, so that the model becomes completed or closed. There are two important constraints that D must satisfy. Since K is an invariant, as are the morphogens, then D2 must also be an
invariant. Secondly, at the two poles, at u = -∞ and u = +∞, we must