Access Plan Recommendation Using SQL Queries Similarity
JIHAD ZAHIR
Mohammed V-Agdal University LRIT-CNRST (URAC’29)
Rabat Morocco [email protected]
ABDERRAHIM EL QADI High School of Technology-UMI
TIM team Meknes Morocco elqadi [email protected]
DRISS ABOUTAJDINE Mohammed V-Agdal University
LRIT-CNRST (URAC’29) Rabat
Morocco
Abstract: Plan reuse is a technique of databases optimization, the main purpose of which is to reuse old access plans stored in the database to execute future queries instead of generating new plans. To carry out its task, the optimizer needs to identify similarity between new and old queries. Questions such as which techniques are needed and which SQL query representation is best to produce accurate similarity estimation remain poorly addressed. The main goals of this work is to propose an approach for access plan recommendation using 4 SQL queries representations and clustering techniques to identify similarity between queries. We study SQL queries similarity, at the intentional level by considering the uninterpreted SQL sentences; therefore SQL queries are represented to TF-IDF and N-GRAM. Then, feature selection algorithms are used to identify the most significant descriptors in the feature space. Next, clustering is applied using partitionning clustering, density based clustering and competitive learning based clustering. Finally, a access plan is recommended to the optimizer. Results show that the use of feature selection process is relevant to our work especially for TF-IDF representation while the most accurate and efficient clutsering is obtained with k-means algorithm.
Key–Words:Clustering, Access plan reuse, SQL Query similarity, Plan recommendation, Feature selection.
1
Introduction
Generally, a database management system (DBMS) could follow and process a variety of access plans to provide an answer to a given query. We get equiv-alent results by considering different plans, but use of the best plan is crucial when performance is con-sidered. Thus, query optimizers task is to generate a plan with the sequence of actions that minimizes the resources consumption. Ideally, we aim to find the best access plan. But practically, often, the best that a query optimizer could do is to avoid worst plans. We note that it is expensive for the server to generate ex-ecution plans. One solution is to reuse existing plans, basically generated for old queries, to execute new similar queries [1]. This solution is based on mea-suring queries similarity. Many application scenarios in different fields could benefit from the identification of similarities in the data, for instance, the work in [2] studies similarity between OLAP sessions for recom-mendation purposes and authors of [3] use similarity metrics for predicting future OLAP queries. In this paper, we use a log based recommendation process in order to achieve an optimization task. Our main goal is to recommend access plans, to be reused by the opti-mizer, based on similarity identification between new and old SQL queries. To carry out this task, we
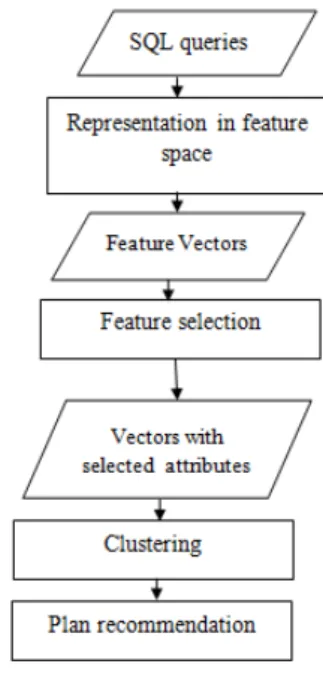
ex-plore the use of clustering along with a feature rep-resentation of SQL sentences in order to detect sim-ilarity. Our access plan recommendation approach is based on several steps described as follows:
• The first step is to describe the SQL queries in a feature space. At this stage, we represent each query in the form of a vector whose each descrip-tor is associated with a weight. There are many measurement techniques to define the weights. In our study, we choose N-GRAM and TF-IDF measurements.
• In the second stage, we use a feature selection process in order to identify the most significant descriptors for the queries. We apply 10 features selection algorithms and choose the best descrip-tors that were selected by most of the algorithms.
• Next, we perform clustering using 3 categories of clustering algorithms which are: Partitionning clustering , Density based clustering and compet-itive learning based clustering.
• Finally,considering the most accurate clustering algorithm, we compare new queries with each cluster’s centroid. If the similarity score between a new query qn and an old query qo is less or
equal to a certain treshold, then our system rec-ommends to the optimizer to use the access plan of queryqoto execute queryqn.
This paper is organized as follows: We firstly provide a litterature review in section 2, then we describe in section 3 the different processes of our approach in-cluding query representation, feature selection, clus-tering and plan recommendation . Finally, we expose our results in the last section and conclude with dis-cussing future work.
2
Related Work
The motivation behind this study is to minimize, as much as possible, generation of new access plans by identifying similarity between old and new queries. Thus, our main goal is to come up with an efficient approach for establishing similarity between two SQL queries. Existent approaches in the literature perform SQL queries similarity identification based on two main phases: i) Defining a pattern for an appropriate query representation, as well as ii) developing a sim-ilarity function. Queries can be represented at the in-tentional level by considering the uninterpreted SQL sentence [4][13] or at the extensional level by using the set of tuples resulting from the query execution [5]. Other query representations range from vectors of features [6] to set of fragments [7].Graphs [8][9] are sometimes used as a pattern for query representa-tion as well. The similarity funcrepresenta-tion varies depending on the nature of the problem. [9] uses a simple equal-ity test of queries patterns and the comparison in [10] is based on separate tests of query fragments. Other ways for establishing similarity are based on classical functions applied to the queries representation. For instance, authors of [5] use inner product and sim-ilarity in [11] and [5] is identified based on cosine distance and Jaccard similarity, respectively. [8] con-verts the queries similarity identification to a graph-isomorphism problem and compares the queries pat-tern using the VF graph matching algorithm [12].
3
Access Plan Recommendation
Ap-proach
Queries are said to be similar if the same access plan could be applied to both of them. When the DBMS optimizer encounters a new query, our access plan rec-ommendation approach allows it to reuse old queries plans and directly use them to execute the new query. In our work, we want to study the usefulness of tex-tual analysis of SQL queries for the representation in
a feature space and explore the relevance of clustering techniques for measuring similarity.
Figure 1: Access Plan recommendation Approach
3.1 Query Representation
In our study, we benefit from textmining techniques to give 2 weighted representations. Particularly, we pro-vide a semantic description of SQL queries in order to represent the data in a feature space.
Firstly, we rewrite all the queries in the following for-mat proposed by [13]:
hclausei − hexpressioni
Example: Query
SELECT R.a, R.b FROM R WHERE R.a=1
Rewritten format of the query
SELECT-R.a, SELECT-R.b, FROM-R, WHERE-R.a, WHERE-= R.a,1
Then, we tokenize the data in order to explore the words in queries. Next, we compute the ”importance” of each word using TF-IDF and N-GRAM techniques.
3.1.1 N-GRAM
A query is a string of characters. Define a n-gram for a query to be any substring of lengthnfound within the query. Then, we associate with each query the set of n-grams that appearptimes within that query.
3.1.2 TF-IDF
Short for Term Frequency Inverse Document Fquency, is a numerical statistic that is intended to re-flect how important a word is to a document[13]. This statistic is computed using equations(1)and(2).
tfidfi,j= tfi,j·idfi (1) where: idfi= log |Q| |{qj :wi ∈qj}| (2) Such as:
• |Q| : Total number of queries in the dataset ;
• {qj : wi ∈ qj}|: number of queries where the wordwiappears (ni,j 6= 0).
3.2 Features selection
Some attributes are not relevant for the description of the queries. In order to remove insignificant attributes and detect the attributes which are the most impor-tant and discriminative, we conduct a feature selection process. This step will reduce the number of attributes and make the clustering process cost lower. We apply feature selection in two main steps. Firstly, we choose 10 algorithms and apply them to both N-GRAM and TF-IDF representations.Then, we choose only the at-tributes which were selected by at least 5 algorithms with N-GRAM representation, and 7 algorithms with TF-IDF representation. The algorithms used are as follows: 1. SymmetricalUncertAttributeEval 2. GainRatioAttributeEval 3. FilteredAttributeEval 4. ChiSquaredAttributeEval 5. Weight by Correlation 6. PrincipalComponents 7. InfoGainAttributeEval 8. SVMAttributeEval 9. LatentSemanticAnalysis 10. ReliefAttributeEval 3.3 Clustering
Clustering is a fundamental datamining technique. As an unsupervised classification method, the main aim of the clustering process is to group similar objects together. A cluster is therefore a collection of objects that have a small distance from one another. Sev-eral clustering techniques are given in the literature, in [14] K.-L.Du gives a comprehensive overview of clustering methods. In our work, we want to examine the results of 3 types of clustering algorithms when applied to our SQL data.
3.3.1 Clustering Algorithms
• Partitioning clustering: This category of clus-tering algorithms involves objects assignment [15]. It considers a numberkof clusters and each object is assigned to the cluster into which it fits best.Kis required to be prespecified by the user. Each cluster is represented by one of its objects called centroid and characteristics of the centroid are specified based on the studied domain knowl-edge.The most well-known data clustering tech-nique is K-means.
• Competitive learning based clustering: This method is a form of unsupervised training where outputs are said to be in competition for in-put patterns. The Kohonens Self-Organizing Maps (SOM) is a topology-preserving compet-itive learning model that produces mapping from a multidimensional input space into a lattice of clusters. The SOM is not based on the minimiza-tion of any known objective funcminimiza-tion, its a clus-tering network with a set of heuristic procedures [14].This algorithm is especially powerful for the visualization of high-dimensional data, since it converts complex relationships between high di-mensional data into simple geometric relations at a low dimensional display .
• Density based clustering: It groups objects of a dataset into clusters based on density con-dition [14]. The key idea behind this type of methods is that for each instance of a cluster, the neiborhood of a given radius(Eps) has to contain at least a minimum number of instances (M inpts).Density based algorithms can handle outliers and discover clusters of arbitrary shape. DBSCAN is a widely known density based clus-tering algorithm.
The clustering algorithms that we use in our work are presented in Table 1 according to the clustering meth-ods category they belong to.
Clustering Method Algorithm Partitionning clustering K-means Competitive learning based clustering SOM Density based clustering DBSCAN
Table 1: Algorithms used for clustering
3.3.2 Parameters Estimation
A major challenge in cluster analysis is the estimation of algorithms parameters.
As shown in Table 2, DBSCAN algorithm requires 2 parameters (Eps andM inP ts), SOM needs the in-put argumentnandkmust be specified for K-means as well. The parametersEps,M inP tsandnare es-timated empirically andkis estimated using the gap statistic proposed by Tibshirani, Walther and Hastie in [16] and defined by equation(3).
Gapn(k) =E∗{log(Wk)} −log(Wk) (3) whereW(k)is the sum of the pairwise distanceDrfor allnpoints in clusterr:
W(k) = k X r=1 1 2nrDr (4) Algorithm Parameter
K-means k: number of clusters SOM n: Number of neurons
DBSCAN Minimum number of data pointsM inP ts Density measureEps
Table 2: Parameters required by the clustering algorithms
3.3.3 Similarity metric
As presented above, clustering is the task of finding collections of similar objects that have a small dis-tance from one another. Detecting similarity between queries consists of calculating the distance between each pair of them.
In order to idenify similar queries, we use the cosine similarity along with k-means and the Euclidean dis-tance with SOM. DBSCAN doesn’t need a disdis-tance metric since it’s a density based algorithm.
The cosine similarity between two vectors is a mea-sure that calculates the cosine of the angle between them. The cosine similarity formula is given by equa-tion(5). cos(θ) = Pn k=1x1kx2k pPn k=1x1k2pPnk=1x1k2 (5) 3.3.4 Cluster validity
The result of clustering algorithms can be very differ-ent from each other even on the same dataset and it is difficult to define when a clustering result is accept-able. The aim of studying the clusters validity is to find the partitioning that best fits the underlying data, thus several clustering validity techniques and indices have been developed. Kovcs & al give an overview of the most commonly used validity indices in [17].
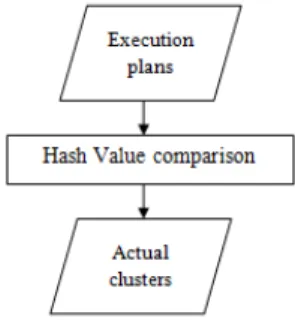
In order to evaluate clustering validity in our work we use efficiency and accuracy metrics. We measure ef-ficiency in terms of the time taken for clustering. In order to calculate accuracy, we categorize our SQL queries manually using theirPlan hash value, which give us the actual numbers of clusters and queries per cluster. Then, we compare the outputs of each clus-tering algorithm to the actual information. Figure 2 summarizes this process.
Figure 2: Process of finding actual clusters
Plan hash value:
When we execute a SQL statement in Oracle, a hash value is being assigned to its execution plan. Hence, every plan is identified by its hash value. Given two execution plans, comparing one plan hash value to another easily identifies whether or not the plans are the same. According to Oracle documenta-tion, the PLAN HASH VALUE metric can be used as a shortcut to determine if two execution plans are the same. We benefit from this metric to find out which queries have the same execution plan, and hence cate-gorize them according to their plan hash values.
3.4 Plan Recommendation
There has been much research done on recommen-dation technologies over the past years. [18] gives a good survey of the state of the art and possible exten-sions in the field. Authors in [19] group algorithms for recommendations into two general classes: memory based and model-based algorithms. In our study, we propose a memory based access plan recommender presented in Figure 3. The recommendation is based on similarity checking between new query and old queries whose access plans are available in the mem-ory. If a similarity is detected between a new query qnand an old queryqo, then our system recommends to the optimizer to use the access plan of queryqoto execute queryqn. This operation makes the optimizer avoid the cost required to generate a new access plan for queryqn.
Figure 3: Access Plan recommendation process description
4
Experimentations
4.1 Data
In this study, we use the dataset from APB1 bench-mark [20]. The star schema of this benchbench-mark has one fact table and four dimension tables, all described in Table 3. The dataset contains 55 queries templates. At this stage we limit our study to the 31 templates containing 2 tables. We write a Java program in order to generate 1350 queries using these templates.
Table Name Cardinality Size (MB)
ACTVARS 33323400 2085
CHANLEVEL 10 2.4×10⁻⁴ CUSTLEVEL 990 2.4×10⁻² PRODLEVEL 9900 7.3×10⁻¹ TIMELEVEL 24 3.9×10⁻⁴ Table 3: APB1 Benchmark Characteristics
4.2 Attributes selection evaluation
We use Weka [21] for data tokenization. We obtain 192 attributes for N-GRAM representation and 68 at-tributes for TF-IDF representation. After the feature selection process, the number of attributes is reduced to 17 and 12 for N-GRAM and TF-IDF respectively as shows Table 4. A detailed description of selected attributes is given in Tables 5 and 6.
Weighting technique Number of attributes Nb.of selected attributes N-GRAM 192 17 TF-IDF 68 12
Table 4: Number of attributes according to weight measure method Attribute Select by CODE LEVEL 7 PRODUCT LEVEL 7 and-PRODLEVEL 7 from-PRODLEVEL 7 select-* 7 where-=PRODLEVEL 7 MONTH LEVEL 7 TIME LEVEL 7 and-TIMELEVEL 7 and-like 7 from-TIMELEVEL 7 where-=TIMELEVEL 7 select-ACTVARS 6
Table 5: Selected attributes dor TF-IDF Representation
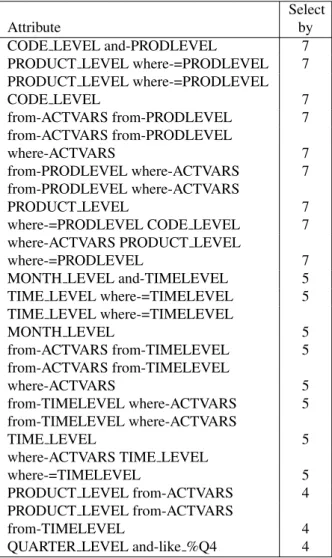
Attribute
Select by
CODE LEVEL and-PRODLEVEL 7
PRODUCT LEVEL where-=PRODLEVEL 7 PRODUCT LEVEL where-=PRODLEVEL
CODE LEVEL 7 from-ACTVARS from-PRODLEVEL 7 from-ACTVARS from-PRODLEVEL where-ACTVARS 7 from-PRODLEVEL where-ACTVARS 7 from-PRODLEVEL where-ACTVARS PRODUCT LEVEL 7
where-=PRODLEVEL CODE LEVEL 7 where-ACTVARS PRODUCT LEVEL
where-=PRODLEVEL 7
MONTH LEVEL and-TIMELEVEL 5
TIME LEVEL where-=TIMELEVEL 5 TIME LEVEL where-=TIMELEVEL
MONTH LEVEL 5 from-ACTVARS from-TIMELEVEL 5 from-ACTVARS from-TIMELEVEL where-ACTVARS 5 from-TIMELEVEL where-ACTVARS 5 from-TIMELEVEL where-ACTVARS TIME LEVEL 5
where-ACTVARS TIME LEVEL
where-=TIMELEVEL 5
PRODUCT LEVEL from-ACTVARS 4 PRODUCT LEVEL from-ACTVARS
from-TIMELEVEL 4
QUARTER LEVEL and-like %Q4 4
Table 6: Selected Attributes For N-GRAM Representation
4.3 Clustering Evaluation
We now present the results of the clustering process. The metrics used for evaluation are accuracy and ef-ficiency. Accuracy in our case is the ability of our approach to assign the SQL queries to the same clus-ters as obtained by Oracle’s metric. We measure
effi-ciency in terms of the time taken for clustering. Table 7 shows the actual number of clusters and the number of queries contained with in each cluster. Recall that queries sharing same clusters are the queries whose access plan is, actually, the same. We start our ex-periment by estimating the parameterkrequired by k-means algorithm using the gap statistic. The estimated and actual numbers of clusters are reported in Table 8. In the next step, k-means, DBSCAN and SOM algo-rithms are applied to 4 representations of the dataset: TF-IDF and N-GRAM each with full and selected attributes. Each representation and each algorithm give a different categorization of the SQL data. The graphs reported by Figures 5 and 6 compare the num-ber of queries contained with in the obtained clusters by DBSCAN and k-means respectively, while Figure 4 presents the clusters produced by SOM. From the obove experimentations we compute accuracy and ef-ficiency reported in Figure 7 and Table 9 respectively.
Cluster Plan hash values Number of Related queries
1 4072885321 500 2 2685087043 150 3 3213411799 150 4 579567007 50 5 1918545856 50 6 1806581648 150 7 2213448725 150 8 4051080753 100 9 1743607541 50
Table 7: Actual number of queries per cluster
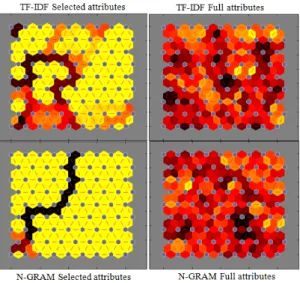
Figure 4: Results of clustering using SOM
Figure 5: Results of clustering using DBSCAN
Figure 6: Results of clustering using k-means
Query representation Actual Estimated
TF-IDF 9 9
TF-IDF Selected 9 9
N-GRAM 9 10
N-GRAM Selected 9 8
Table 8: Actual and Estimated Number of Clusters Using GAP Statistic
Query representation K-means DBSCAN SOM
TF-IDF Full 0.22 3.33 35.69
TF-IDF selected 0.03 0.53 21.59
N-GRAM Full 0.10 21.42 87.65
N-GRAM selected 0.04 0.75 17.95
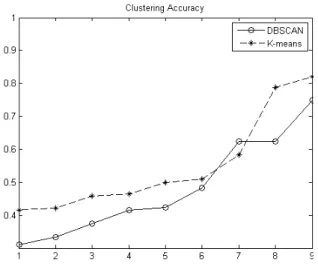
Figure 7: Accuracy of the clustering
Results from Table 8 show that gap statistic gives generaly a good estimation of the number of clusters. We observe that , unlike N-GRAM representations, both TF-IDF representations, either with selected or full attributes, give exactly the same estimated num-ber of clusters which is equal to the real numnum-ber of clusters. This means that when applied to TF-IDF rep-resentations, the gap statistic gives better estimation of the number of clusters compared to N-GRAM rep-resentations and the feature selection process doesnt have any impact on the estimation in this case.
Moving on to the accuracy of clustering, Figure 7 shows that the overall accuracy of k-means is bet-ter compared to DBSCAN even if it slightly decreases for cluster 7. On the other hand, we noticed that SOM is not relevent to our study. Even if inter-clusters dis-tance is greater when the algorithm is applied to TF-IDF representation with selected set of attributes, the accuracy remains poor since the number of clusters retrieved is far from the actual number of clusters.
With regard to efficiency, the fastest clustering is achieved with k-means algorithm with 0.03s recorded for TF-IDF representation with selected attributes while DBSCAN and SOM take 0.53s and 21.59s , respectively, to cluster the SQL data modeled in the same representation.
From the above discussion it is straightforward to conclude that the most accurate and quick clutsering is obtained with k-means algorithm when applied to TF-IDF with selected attributes, thus, we use it for the next step of the recommendation process.
4.4 Plan Recommendation
Considering the clusters obtained with k-means algo-rithms, we start the recommendation process as de-scribed in Figure 3. Recall that our approach consists of calculating the distance between a new query Qn
and the centroids of all clusters. Once the nearest clus-ter is identified, we calculate the similarity betweenqn and each queryqiin that cluster, using the cosine sim-ilarity described previously. Then, we compare the results.
In order to test the relevence of this approach, we ap-ply the recommendation process to a query Qn that we pick randomly.Qnis defined as:
Qn:
select ACTVARS.UNITSSOLD from ACTVARS,TIMELEVEL where
N ACTVARS.TIME LEVEL=TIMELEVEL.TID and TIMELEVEL.MONTH LEVEL = ’5’; Results of similarity calculation show that the highest similarity is detected with a certain queryQ29defined
as:
Q29:
select UNITSSOLD
from ACTVARS ,TIMELEVEL where
ACTVARS.TIME LEVEL=TIMELEVEL.TID and TIMELEVEL.MONTH LEVEL=’10’; Hence, we recommend to the optimizer to use the ac-cess plan ofQ29to execute queryQn.
5
Conclusion
In this paper, we presented a clustering approach for access plans recommendation comparing 3 differ-ent algorithms and 4 query represdiffer-entations. Resuts showed that TF-IDF representation with selected at-tributes gives the most accurate clustering results and gap statistic can be used to estimate number k of clus-ters. We also noticed the advantage of using fea-ture selection algorithms for TF-IDF representation in terms of efficiency without affecting the accuracy. Meanwhile, feature selection process was not relevent when applied to N-GRAM representation.
In our future work,we will explore classification al-gortihms and other query representations in feature space. Another important issue that we plan to con-sider in the future is to use a bigger set of data for tests instead of a set of limited instances.
References:
[1] P.Griffiths Selinger, M.M.Astrahan, D.D.Chamberlin et al. Access path selec-tion in a relaselec-tional database management
MOD international conference on Management of data. ACM, 1979. p. 23-34.
[2] J.Aligon, M.Golfaretti, P.Marcel et al. Similar-ity measures for OLAP sessions.Knowledge and information systems, 2014, vol. 39, no 2, p.463-489.
[3] M.A.Aufaure, N.Kuchmann-Beauger, P.Marcel et al. Predicting your next OLAP query based on recent analytical sessions. In:Data Warehousing and Knowledge Discovery. Springer Berlin Hei-delberg, 2013. p.134-145.
[4] Q.Yao, A.an et X.Huang. Finding and analyzing database user sessions. In:Database Systems for Advanced Applications. Springer Berlin Heidel-berg, 2005. p.851-862.
[5] K.Stefanidis, M.Drosou et E.Pitoura.You May Also Like results in relational databases.Proc.of PersDB, 2009, vol.9.
[6] A.Ghosh, J.Parikh, V.S.Sengar et al. Plan se-lection based on query clustering. In: Proceed-ings of the 28th international conference on Very Large Data Bases. VLDB Endowment, 2002. p.179-190.
[7] J.Aligon, M.Golfarelli, P.Marcel et al. Mining preferences from OLAP query logs for proac-tive personalization.In: Advances in Databases and Information Systems. Springer Berlin Hei-delberg, 2011. p.84-97.
[8] L.Sadeg et L.Bellatreche. Une approche pour l’optimisation des requˆetes dirig´e par la r´eutilisation des plans dex´cution. STIC09,2009. [9] X.Yang, C.M.Procopiuc et D.Srivastava.
Rec-ommending join queries via query log analy-sis.In:Data Engineering, 2009. ICDE’09. IEEE 25th International Conference on. IEEE, 2009. p.964-975.
[10] A.Gupta, I.S.Mumick et al. Materialized views: techniques, implementations, and applications. Cambridge: MIT press, 1999.
[11] G.Chatzopoulou, M.Eirinaki, S.Koshy et al. The QueRIE system for Personalized Query Recom-mendations. IEEE Data Eng. Bull., 2011, vol. 34, no 2, p.55-60.
[12] L.P.Cordella, P.Foggia, C.Sansone et al. Perfor-mance evaluation of the VF graph matching al-gorithm. In: Image Analysis and Processing,
IEEE, 1999. p.1172-1177.
[13] C.Miles. More Like This: Query Recommenda-tions for SQL.
[14] K.L.Du. Clustering: A neural network approach. Neural Networks, 2010, vol. 23, no 1, p.89-107. [15] J.Leskovec, A.Rajaraman et J.D.Ullman. Min-ing of massive datasets. Cambridge University Press, 2014.
[16] R.Tibshirani, G.Walther et T.Hastie. Estimating the number of clusters in a data set via the gap statistic.Journal of the Royal Statistical Society: Series B (Statistical Methodology), 2001, vol.63, no 2, p.411-423.
[17] K.Wang, B.Wang, et L.Peng. CVAP: Validation for cluster analyses.Data Science Journal, 2009, vol.8, p.88-93.
[18] G.Adomavicius et A.Tuzhilin. Toward the next generation of recommender systems: A survey of the state-of-the-art and possible extensions. Knowledge and Data Engineering, IEEE Trans-actions on, 2005, vol.17, no 6, p.734-749. [19] G.Ganapathy et K.Arunesh. Models for
Recom-mender Systems in Web Usage Mining Based on User Ratings. In: Proceedings of the World Congress on Engineering. 2011.
[20] OLAP Council APB-1 OLAP Bench-mark Release I. Web. April 2014. http://www.olapcouncil.org/research/spec1.htm. [21] Weka 3: Data Mining Software in Java. Web.