COPYRIGHT AND CITATION CONSIDERATIONS FOR THIS THESIS/ DISSERTATION
o
Attribution — You must give appropriate credit, provide a link to the license, and indicate if
changes were made. You may do so in any reasonable manner, but not in any way that
suggests the licensor endorses you or your use.
o
NonCommercial — You may not use the material for commercial purposes.
o
ShareAlike — If you remix, transform, or build upon the material, you must distribute your
contributions under the same license as the original.
How to cite this thesis
Surname, Initial(s). (2012). Title of the thesis or dissertation (Doctoral Thesis / Master’s
Dissertation). Johannesburg: University of Johannesburg. Available from:
Efficient Use of Deep Learning
and Machine Learning for Load
Forecasting in South African
Power Distribution Networks
Sibonelo C. Motepe
201512867
June 2019
Thesis submitted in fulfilment of the requirements for the
degree
Doctorate of Electrical and Electronic Engineering
at the
Faculty of Engineering at the
University of Johannesburg, Auckland Park Campus
Supervisor: Dr Ali N. Hasan
Co-supervisors: Prof. Bhekisipho Twala
Prof. Riaan Stopforth
To my son, Kanalelo Letlotlo Motepe, you were born to be Great. Never let anyone tell you that you are not capable of doing something.
Efficient Use of Deep Learning and Machine Learning for Load Forecasting in South African Power Distribution Networks
Abstract
Title: Efficient Use of Deep Learning and Machine Learning for Load Forecasting in
South African Power Distribution Networks
Author: Sibonelo Cobry Motepe
Promoter: Dr Ali Hasan
School: Electrical Engineering Science Faculty: Engineering and Built Environment
Degree: Doctorate of Engineering (Electrical and Electronic Engineering)
Keywords: Load forecasting, deep learning techniques, machine learning techniques, South African power systems, power distribution networks, maintenance planning
Load forecasting, which is the act of anticipating future loads, has been shown to be important in power system network planning, operations and maintenance. Artificial Intelligence (AI) techniques have been shown to be good tools for load forecasting. Load forecasting can assist power distribution utilities maximise their revenue through optimising maintenance planning. With the dawn of the smart grid, first world countries have moved past the customer’s point of supply and use smart meters to forecast customer loads. These recent studies also utilise recent state of the art AI techniques such as deep learning techniques. Weather parameters are such as temperature, humidity and rainfall are usually used as parameters in these studies. South African load forecasting studies are outdated and recent studies are limited. Most of these studies are from 2010, and dating backwards to 1999. Hence they do not use recent state of the art AI techniques. The studies do not focus at distribution level load forecasting for optimal maintenance planning. The impact of adjusting power consumption data when there are spikes and dips in the data was not investigated in all these South African studies. These studies did not investigate the impact of weather parameters on different South African loads and hence load forecasting performance.
Efficient Use of Deep Learning and Machine Learning for Load Forecasting in South African Power Distribution Networks
iii
Data is one of the key components in the development of AI models. The integrity of the data is key to developing accurate models. Hence, knowing the integrity of the data one is using to train and test their AI models becomes important. The integrity of data can be compromised at different points before an end user accesses the data. The data can also have noise or patterns that may seem out of the norm. Determining South African power consumption data integrity at end-user level using AI techniques has not been investigated. The impact of performing data clean-up on South African load forecast has not been studied.
In this thesis, three case studies (Substation A, Substation B and Substation C) are presented to overcome the shortfalls stated previously in this section and, contribute to body of knowledge in the field of load forecasting and AI. The first contribution is the introduction of a novel load forecasting system utilising state of the art deep learning and machine learning techniques for South African power distribution networks. The proposed system included a module that determines data integrity using Mamdani-Type fuzzy logic. The module evaluates data integrity by looking at three different fault types: data lost faults, spikes and out of bounds fault, and multiple entries of the same variable. The flags are raised for field or database repairs for low data integrity detections. The data with high integrity were used to forecast load using the load forecasting module. The machine learning/deep learning load forecasting module has machine learning/deep learning models deployed. These models are trained before deployment, with the best performing model per application being deployed. The best model is chosen from the four techniques used, namely, adaptive neuro-fuzzy inference system (ANFIS), optimally pruned extreme learning machine (OP-ELM), deep belief networks (DBN) and long short-term memory recurrent neural networks (LSTM-RNN). The best performing load forecasting model was determined using three performance measures, the symmetric mean absolute percentage error (sMAPE), mean absolute error (MAE) and root mean square error (RMSE). The load forecast are then used to inform the distribution planned power outages as part of maintenance planning or electrification.
The second contribution is the introduction of deep learning techniques in South African load forecasting. In both case studies, it was found that deep learning techniques outperform machine learning techniques. DBN achieved the lowest load forecasting error in the first case study (Substation A) with an sMAPE of 0.0785323 (3.93 %), MAE of 0.0306600 (3.07 %) and
Efficient Use of Deep Learning and Machine Learning for Load Forecasting in South African Power Distribution Networks
RMSE of 0.0429001 (4.29 %). LSTM-RNN achieved the lowest load forecasting error in the second case study with an sMAPE of 0.065859 (3.29 %), MAE of 0.04598 (4.6 %) and RMSE of 0.055058 (5.51 %). In the third case study, an LSTM-RNN model achieved the lowest load forecasting error with an sMAPE of 0.2307 (11.54 %), MAE of 0.0896 (8.96 %) and RMSE of 0.14065 (14.07 %)
The third contribution is two-fold. The first part is investigating the effects of ‘cleaning’ loading data for dips and spikes. The second part is investigating how the temperature affects the performance of machine learning and deep learning models in forecasting South African distribution networks loads. It was found that both machine learning and deep learning models, in the two case studies, generally achieved their best performance without ‘cleaning’ the loading data. The impact of temperature as an input variable in the development of load forecasting models was also investigated. In the first case (Substation A) and third case (Substation C) it was found that the machine learning techniques achieved their lowest load forecasting errors without temperature in their model’s development. The deep learning techniques achieved their best performance with the inclusion of temperature in their model’s development. In the second case study all the models achieved the best performance without the inclusion of temperature, with the exception of OP-ELM.
Efficient Use of Deep Learning and Machine Learning for Load Forecasting in South African Power Distribution Networks
v
Acknowledgements
Thanks firstly go to God, who has made all of this possible. His mercy is enduring. Another big thank you to my late mother, Puseletso Letia, whose upbringing, hard work and sacrifices have enabled me to be at this point today. Mmewa ngwana o tshwara thipa ka bohaleng. I would like to thank Prof. Bhekisipho Twala for his guidance and supervision, and for helping me get to the finish line.
I would also like to thank Dr Ali Hasan and Prof. Riaan Stopforth for allowing me to complete this study under their supervision. I appreciate their guidance, patience, push, the late e-mails and not to forget the jokes.
I would like to thank my wife, Nthabiseng Motepe, for her patience and support throughout my studies. Also great thanks to my son, Kananelo Motepe, for being patient with me when I stole some of his time.
I would also like to thank all my relatives and friends who have contributed positively towards my life while I was undertaking this journey. With a special thanks to Thapelo Tsotetsi, Raphepheng Motepe, Tholoana Hlungwani, Dipontsho Motepe, Vusi Hlungwani, Mr and Mrs Mohlakoana, Thabang Nkadimeng, Mahlatsi Malatji, Ben Mabizela and Ndivhuwo Mulimeli. I would also like to give special thanks to my late friend Teboho Maloka for the discussions we had as undergraduate students which encouraged me to pursue postgraduate studies.
Efficient Use of Deep Learning and Machine Learning for Load Forecasting in South African Power Distribution Networks
Publications Resulting from this Research
Eight publications have been developed as an output of this research. These publications are listed below.
A.
Conference Proceedings
1. S. Motepe, B. Twala and R. Stopforth, “Determining South African Distribution Power System Big Data Integrity Using Fuzzy Logic: Power Measurements Data Application,” Pattern Recognition Association of South Africa and Robotics and Mechatronics International Conference (PRASA-RobMech), Bloemfontein, South Africa, 2017, pp. 139-143
2. S. Motepe, Ali N. Hasan and R. Stopforth, “South African Distribution Networks Load Forecasting Using ANFIS,” IEEE Power Electronics Drivers and Energy Systems (PEDES) Conference, Chennai, India, 2018, pp. 1-6
3. S. Motepe, Ali N. Hasan and R. Stopforth, “Power Distribution Networks Load Forecasting Using Deep Belief Networks: The South African Case,” IEEE Jordan International Joint Conference on Electrical Engineering and Information Technology (JEEIT) Proceedings, Amman, Jordan, 2019, pp. 507-512
4. S. Motepe, Ali N. Hasan, B. Twala and R. Stopforth, “South African Power Distribution Network Load Forecasting Using Hybrid AI Techniques: ANFIS and OP-ELM,” accepted and to be presented at the joint Aegean Conference on Electrical Machines and Power Electronics, and Optimization of Electrical & Electronic Equipment Conference (ACEMP-OPTIM), Istanbul, Turkey, 2019
5. S. Motepe, Ali N. Hasan, B. Twala and R. Stopforth, “Using Deep Learning Techniques for South African Power Distribution Networks Load Forecasting,” accepted and to be presented at the joint Aegean Conference on Electrical Machines and Power Electronics, and Optimization of Electrical & Electronic Equipment Conference (ACEMP-OPTIM), Istanbul, Turkey, 2019
B.
Journal Publications
6. S. Motepe, B. Twala, Q-G Wang and R. Stopforth, “Determining Distribution Power System Loading Measurements Accuracy Using Fuzzy Logic,” Procedia Manufacturing, vol. 7, 2017, pp 435-439
Efficient Use of Deep Learning and Machine Learning for Load Forecasting in South African Power Distribution Networks
vii
7. S. Motepe, Ali N. Hasan and R. Stopforth, “Improving Load Forecasting Process for a Power Distribution Network Using Hybrid AI and Deep Learning Algorithms,” IEEE Access, vol. 7, 2019, pp. 82584 – 82598
8. S. Motepe, Ali N. Hasan, B. Twala and R. Stopforth, “Effective Load Forecasting For Large Power Consuming Industrial Customers Using Long Short-Term Memory Recurrent Neural Networks,” Journal of Intelligent & Fuzzy Systems, vol. 37, no. 6, pp. 8219-8235, 2019, DOI:10.3233/JIFS-190658
Efficient Use of Deep Learning and Machine Learning for Load Forecasting in South African Power Distribution Networks
Nomenclature
ANFIS – Adaptive Neuro-Fuzzy Inference System ANN – Artificial Neural Network
ARIMA – Autoregressive Integrated Moving Average ARMA – Autoregressive Moving Average
ARMAX – Autoregressive Moving Average with Exogenous Variable BP-NN – Back Propagation Neural Network
DBN – Deep Belief Network Dx – Distribution
ELM – Extreme Learning Machine Gx – Generation
IPP – Independent Power Producer LSTM – Long Short-Term Memory
LSTM-RNN – Long Short-Term Memory Recurrent Neural Network MAE – Mean Absolute Error
MRSR – Multi-Response Sparse Regression MTS – Main Transmission Substation
OP-ELM – Optimally Pruned Extreme Learning Machine RBM – Restricted Boltzmann Machine
RMSE – Root Mean Square Error RNN – Recurrent Neural Network
SAIDI – System Average Interruption Duration Index SAIFI – System Average Interruption Frequency Index
Efficient Use of Deep Learning and Machine Learning for Load Forecasting in South African Power Distribution Networks
ix SVM – Support Vector Machine
SVR – Support Vector Regression
sMAPE – Symmetric Mean Absolute Percentage Error Tx – Transmission
Efficient Use of Deep Learning and Machine Learning for Load Forecasting in South African Power Distribution Networks
List of Figures
Figure 1: Illustration of a Power System Network from Generation to Distribution ... 3
Figure 2: Distribution network and different distribution loads ... 6
Figure 3: A structure of neural perceptron ... 24
Figure 4: ANFIS structure ... 25
Figure 5: An RBM basic structure ... 28
Figure 6: An illustration of a DBN with n layers ... 29
Figure 7: An RNN Basic structure ... 30
Figure 8: A LSTM unit ... 31
Figure 9: Optimal power flow data integrity attacks ... 35
Figure 10: One week’s load profile of an industrial as well as a residential customer ... 36
Figure 11: High-level process followed to determine distribution loading data integrity ... 37
Figure 12: Distribution network loading data integrity analysis ... 38
Figure 13: Example of industrial customer substation setup ... 38
Figure 14: Proposed AI distribution network load forecasting system ... 40
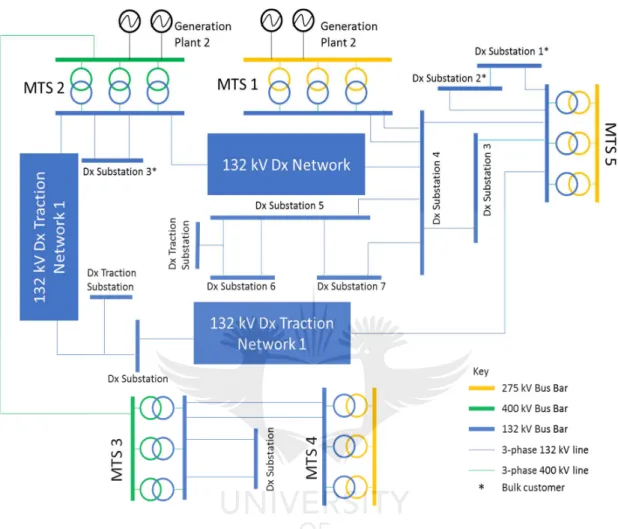
Figure 15: The distribution network where the redistributor substation under study is located ... 48
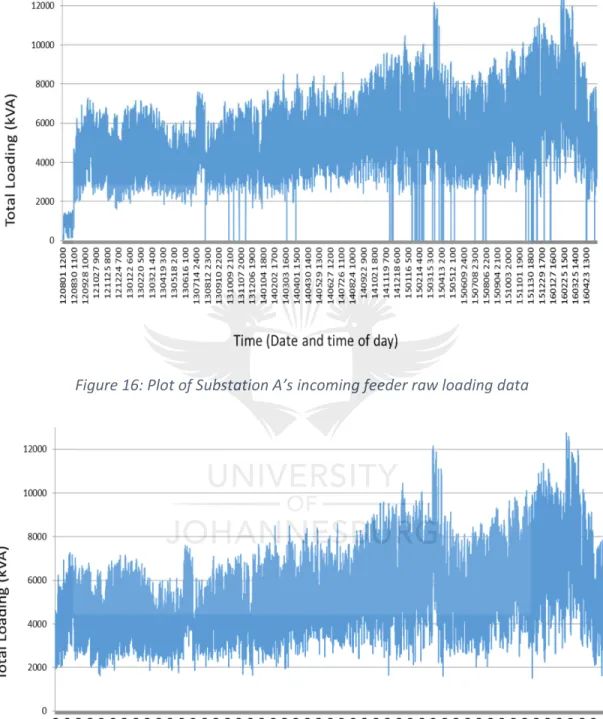
Figure 16: Plot of Substation A’s incoming feeder raw loading data ... 49
Figure 17: Plot of Substation A’s incoming feeder cleaned-up loading data ... 49
Figure 18: Substation A’s day load profile for 15th June 2015 ... 50
Figure 19: Substation A’s two-week load profile for the 15th to 28th June 2015 ... 50
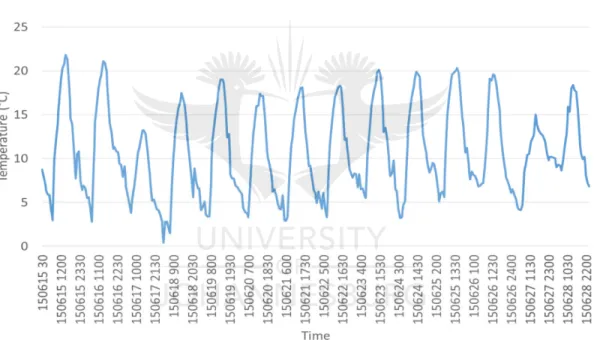
Figure 20: Day temperature profile for study location for 15th June 2015 ... 51
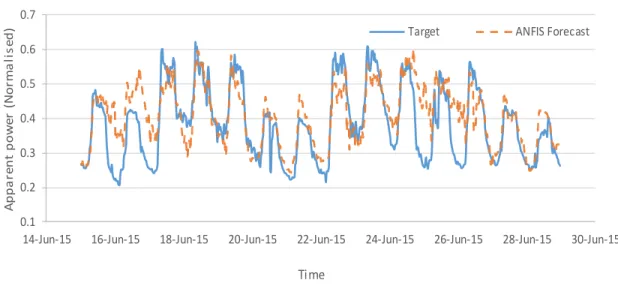
Figure 21: Two-week temperature profile for study location for the 15th to 28th June 2015 51 Figure 22: ANFIS lowest test error model’s two-week ahead load forecast vs target load ... 54
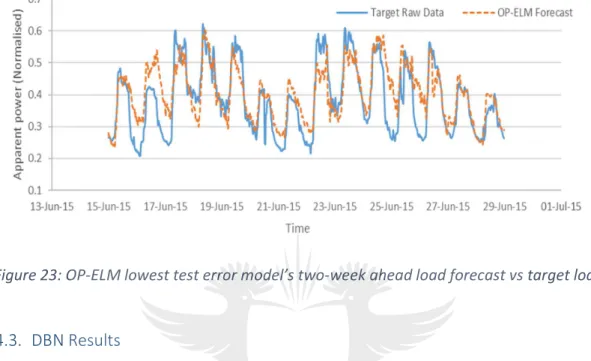
Figure 23: OP-ELM lowest test error model’s two-week ahead load forecast vs target load 56 Figure 24: DBN lowest test error model’s two-week ahead load forecast vs target load ... 59
Figure 25: Substation A LSTM-RNN lowest test error model’s two-week ahead load forecast vs target load ... 62
Figure 26: The distribution network in which the bulk large power user substation under study is located ... 66
Efficient Use of Deep Learning and Machine Learning for Load Forecasting in South African Power Distribution Networks
xi
Figure 28: Plot of transformer 2 cleaned-up loading data ... 67
Figure 29: Transformer 2’s day load profile for 15th June 2015 ... 68
Figure 30: Transformer 2’s two-week load profile for the 15th to 28th June 2015 ... 68
Figure 31: ANFIS lowest test error model’s two-week ahead Substation B load forecast vs target load ... 70
Figure 32: OP-ELM lowest test error model’s two-week ahead Substation B load forecast vs target load ... 72
Figure 33: DBN lowest test error model’s two-week ahead Substation B load forecast vs target load ... 75
Figure 34: LSTM-RNN lowest test error model’s two-week ahead Substation B load forecast vs target load ... 77
Figure 35: The distribution network the power redistributor’s switching substation under study is located ... 81
Figure 36: Plot of Substation C's raw loading data ... 81
Figure 37: Plot of Substation C's cleaned-up loading data ... 82
Figure 38: Substation C’s day load profile for 15th June 2015 ... 82
Figure 39: Substation C’s two-week load profile for the 15th to 28th June 2015 ... 83
Figure 40: ANFIS lowest test error model’s two-week ahead Substation B load forecast vs target load ... 85
Figure 41: OP-ELM lowest test error model’s two-week ahead Substation C load forecast vs target load ... 87
Figure 42: DBN lowest test error model’s two-week ahead Substation C load forecast vs target load ... 90
Figure 43: LSTM-RNN lowest test error model’s two-week ahead Substation C load forecast vs target load ... 92
Efficient Use of Deep Learning and Machine Learning for Load Forecasting in South African Power Distribution Networks
List of Tables
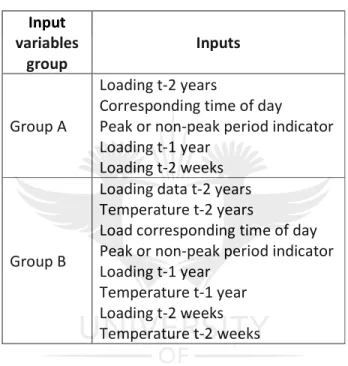
Table 1: Experiment input variables ... 41
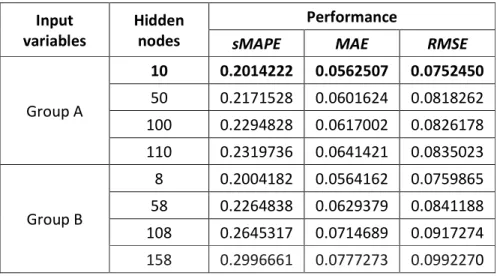
Table 2: ANFIS models’ test errors with raw loading data ... 52
Table 3: ANFIS models test errors with cleaned-up loading data ... 52
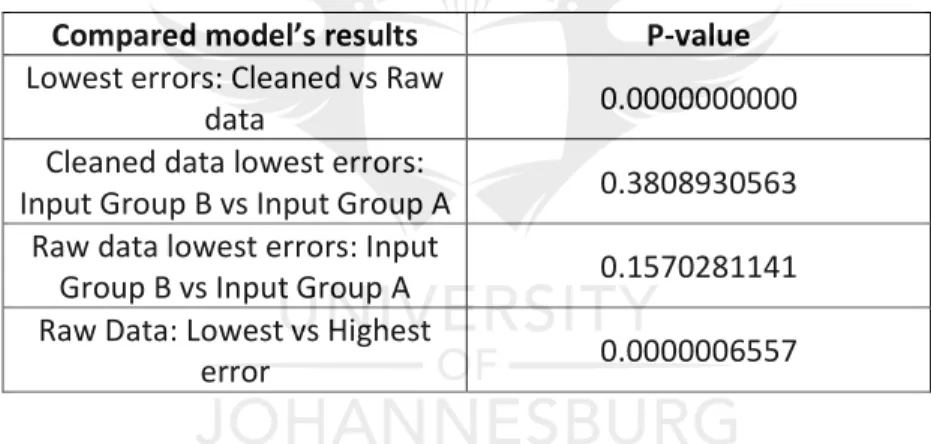
Table 4: ANFIS models’ load forecast t-test results for Substation A ... 53
Table 5: OP-ELM models test errors with raw loading data ... 54
Table 6: OP-ELM models’ test errors with cleaned-up loading data ... 55
Table 7: OP-ELM models’ load forecast t-test results for Substation A... 55
Table 8: DBN models’ test errors with raw loading data ... 57
Table 9: DBN models’ test errors with cleaned up loading data ... 58
Table 10: DBN models’ load forecast t-test results for Substation A ... 58
Table 11: LSTM-RNN models’ test errors with raw loading data ... 60
Table 12: LSTM-RNN models’ test errors with cleaned-up loading data ... 60
Table 13: LSTM-RNN models’ load forecast t-test results for Substation A ... 61
Table 14: Summary of first case study’s lowest errors per model ... 63
Table 15: Substation A different techniques’ lowest error models’ load forecast t-test results ... 63
Table 16: Substation B ANFIS models’ performance with non-cleaned loading data ... 69
Table 17: Substation B ANFIS models’ performance with cleaned loading data ... 70
Table 18: ANFIS models’ load forecast t-test results for Substation B ... 70
Table 19: OP-ELM models’ performance with non-cleaned loading data ... 71
Table 20: OP-ELM models’ performance with cleaned-up loading data ... 71
Table 21: OP-ELM models’ load forecast t-test results for Substation B ... 72
Table 22: DBN models’ performance with non-cleaned loading data... 73
Table 23: DBN models’ performance with cleaned loading data ... 74
Table 24: DBN models’ load forecast t-test results for Substation B ... 74
Table 25: LSTM-RNN models’ performance with non-cleaned loading data ... 76
Table 26: LSTM-RNN models’ performance with cleaned loading data ... 76
Table 27: LSTM-RNN models’ load forecast t-test results for Substation B ... 77
Efficient Use of Deep Learning and Machine Learning for Load Forecasting in South African Power Distribution Networks
xiii
Table 29: Substation B different techniques’ lowest error models’ load forecast t-test results
... 78
Table 30: Substation C ANFIS models’ performance with non-cleaned loading data ... 84
Table 31: Substation C ANFIS models’ performance with cleaned loading data ... 84
Table 32: ANFIS models’ load forecast t-test results for Substation C ... 84
Table 33: Substation C’s OP-ELM models’ load forecasting performance with non-cleaned loading data ... 86
Table 34: Substation C’s OP-ELM models’ load forecasting performance with cleaned up loading data ... 86
Table 35: OP-ELM models’ load forecast t-test results for Substation C ... 87
Table 36: DBN models’ load forecasting performance with non-cleaned loading data for substation C ... 88
Table 37: DBN models’ load forecasting performance with cleaned loading data for substation C ... 89
Table 38: DBN models’ load forecast t-test results for Substation C ... 90
Table 39: LSTM-RNN models’ performance with non-cleaned loading data ... 91
Table 40: LSTM-RNN models’ performance with cleaned loading data ... 91
Table 41: LSTM-RNN models’ load forecast t-test results for Substation B ... 92
Table 42: Summary of third case study’s lowest errors per model ... 93
Table 43: Substation C different techniques’ lowest error models’ load forecast t-test results ... 93
Efficient Use of Deep Learning and Machine Learning for Load Forecasting in South African Power Distribution Networks
Table of Contents
Abstract ... ii
Acknowledgements ... v
Publications Resulting from this Research ... vi
A. Conference Proceedings ... vi
B. Journal Publications ... vi
Nomenclature ... viii
List of Figures ... x
List of Tables ... xii
Table of Contents ... xiv
Chapter 1 – Introduction ... 1
1.1. Introduction ... 2
1.2. Electrical Power Distribution Networks ... 2
1.3. Maintenance Overview ... 4
1.4. Electrical Load Forecasting Overview ... 5
1.5. Recent Load Forecasting Applications and Studies ... 7
1.6. Machine Learning and Deep Learning ... 8
1.7. Data Integrity ... 9
1.8. Problem Statement ... 10
1.9. Research Objectives and Contributions ... 10
1.10. Thesis Layout ... 13
1.11. Chapter Summary ... 14
Chapter 2 – Artificial Intelligence ... 16
2.1. Introduction ... 17
Efficient Use of Deep Learning and Machine Learning for Load Forecasting in South African Power Distribution Networks
xv
2.3. Application of Deep Learning ... 20
2.4. Application of Machine Learning ... 21
2.5. Techniques Applied in This Research ... 22
2.5.1. Neuro-Fuzzy Systems ... 23
2.5.2. Optimally Pruned Extreme Learning Machines ... 26
2.5.3. Deep Belief Networks ... 27
2.5.4. Long Short-Term Memory Recurrent Neural Network ... 30
2.6. Forecasting, Prediction, Classification and Regression ... 31
2.7. Chapter Summary ... 32
Chapter 3 – Proposed Load Forecasting System ... 33
3.1. Introduction ... 34
3.2. Determining Distribution Network Data Integrity ... 34
3.3. The Proposed Load Forecasting System ... 39
3.4. Experimental Approach ... 40 3.4.1. ANFIS ... 42 3.4.2. OP-ELM ... 42 3.4.3. DBN ... 42 3.4.4. LSTM ... 42 3.5. Performance Measures ... 43
3.6. Statistical Significance Test ... 44
3.7. Chapter Summary ... 44
Chapter 4 - 1st Case Study: Distribution Substation A - Power Redistributor Load ... 46
4.1. Introduction ... 47
4.2. Case Study A Distribution Network Overview ... 47
Efficient Use of Deep Learning and Machine Learning for Load Forecasting in South African Power Distribution Networks
4.4. Experiment Results and Results Discussion ... 51
4.4.1. ANFIS Results ... 51 4.4.2. OP-ELM Results ... 54 4.4.3. DBN Results ... 56 4.4.4. LSTM-RNN Results ... 59 4.4.5. Results Discussion ... 62 4.5. Chapter Summary ... 63
Chapter 5 - 2nd Case Study: Distribution Substation B - Industrial Large Power End User Load ... 64
5.1. Introduction ... 65
5.2. Case Study B Distribution Network Overview ... 65
5.3. Data Description ... 66
5.4. Experiment Results and Discussion ... 68
5.4.1. ANFIS Results ... 69 5.4.2. OP-ELM Results ... 71 5.4.3. DBN Results ... 72 5.4.4. LSTM-RNN Results ... 75 5.4.5. Results Discussion ... 77 5.5. Chapter Summary ... 78
Chapter 6 - 3rd Case Study Distribution Substation 3 - Power Redistributor Load ... 79
6.1. Introduction ... 80
6.2. Case Study C Distribution Network Overview ... 80
6.3. Data Description ... 81
6.4. Experiment Results and Discussion ... 83
Efficient Use of Deep Learning and Machine Learning for Load Forecasting in South African Power Distribution Networks
xvii
6.4.2. OP-ELM Results ... 85
6.4.3. DBN Results ... 87
6.4.4. LSTM Results ... 90
6.4.5. Results Discussion ... 92
6.5. Case Studies’ Results Comparison ... 93
6.6. Chapter Summary ... 95
Chapter 7 – Conclusions and Recommendations ... 96
7.1. Introduction ... 97
7.2. Conclusions ... 97
7.3. Assessment of Thesis’ Novel Contributions ... 99
7.4. Recommended Future Work ... 101
7.5. Closing Remarks ... 102
Efficient Use of Deep Learning and Machine Learning for Load Forecasting in South African Power Distribution Networks
Chapter 1 – Introduction
“If you spend too much time thinking about a thing, you’ll never get it
done. Make at least one definite move daily toward your goal.”
Chapter 1 – Introduction
2
1.1.
Introduction
South Africa is a developing country located at the southern tip of Africa. In the year, 1994 South Africa became a democratic country. Upon becoming democratic, the country set out to make electricity available to all its citizens. This ambition has led to the electrification of over 12 000 schools and over 5.2 million homes [1]. The government’s plan is to achieve universal access by 2025/2026. South Africa has a vertically integrated electricity sector, with Eskom as the main player across the value chain. Eskom supplies 95 % of South Africa’s power [2]. A large portion of this power is produced using coal plants. Private entities produce the remaining percentage. The company is the only power transmitter in the country, with the role of power distribution shared between Eskom and municipalities. There have been recent talks of unbundling Eskom, which may potentially introduce more players across the value chain.
1.2.
Electrical Power Distribution Networks
In South Africa, distribution networks are power systems networks at voltages up to 132 kV. These networks are constructed to deliver power to end users [3]. The power is produced in generation plants and is then transformed to a higher voltage and low current for transmission, typically over long distances. This transformation is to reduce the required infrastructure and the technical losses. The power then gets to a transmission substation, also termed main transmission substation (MTS), where it is transformed to a lower voltage. It is then transported to distribution substations, which distribute the power to customers, including power redistributors. Figure 1 gives a high-level example of a power system network from generation to distribution, up to the distribution substation higher voltage bus bar. There is a drive in SOUTH AFRICA to diversify its energy mix and become greener. At the end of October 2016, 2.8 GW of renewable independent power producers’ (IPPs) plants had already been connected to the South African grid at transmission and distribution levels [4]. The South African government plans to have 17 800 MW supplied by renewable sources by 2030 [4]. This drive has led to the grid code requiring N-1 firmness. Due to this and partially also due to aging, Eskom has paid special attention to distribution and transmission maintenance [5]. Globally, utility distribution networks are also seeing a growth in renewable
Chapter 1 – Introduction
generation sources penetration. The importance of a reliable distribution system is thus paramount.
Figure 1: Illustration of a Power System Network from Generation to Distribution
One of the key performance measures of a distribution network is its reliability. The reliability is measured by the System Average Interruption Frequency Index (SAIFI) and the System Average Interruption Duration Index (SAIDI) [6]. SAIFI simply put is a measure of how frequently customers’ power supply is disrupted over a set period of time, usually a year, and SAIDI measures how long customers’ power is disrupted. These two measures are given by (1) and (2) [6]:
∑ (1)
Chapter 1 – Introduction
4
where ri is each incident’s restoration time, ni is the number of incidents and nk is the number
of interrupted customers. Network power outages, whether planned or unplanned, contribute to an increased SAIDI. Lack of maintenance can lead to an increase in the number of failures. Power utilities, therefore, need to manage these key performance areas (KPIs), to not only keep their customers satisfied with their service, but also to maximise revenue. This is achieved by having most of the utility’s customers supplied for the maximum possible time, with a minimal number of interruptions.
Distribution networks can be constructed into a number of different configurations. Some of the common configurations are the single-end radially fed feeder, a doubly fed feeder with a normally open point and lastly a ring network configuration. The single-end radially fed feeder has a single feeder from the main substation. This main feeder can have branches or sub-feeders which have customers connected to it. However, in this configuration power flow is in one direction from the supply substation to the end user with no other alternative supply options. A fault in this type of network means that customers beyond the fault will be without power. Should the fault cause the main breaker at the substation to open, the whole feeder can be without power. The doubly fed feeders can be regarded as two single-end radially fed feeders supplied from two different substations. The feeders, however, have a point that connects them. This point is called a normally open point and does not allow power to flow between the networks under normal operations. Closing this point connects the two networks and, therefore, allows power to flow from one of the sources through its feeder to supply the second feeder’s network. The ring network configuration comprises sub-networks that are interconnected and are supplied from the same main substation from two separate feeders or more. The network has interconnecting feeders that connect the different networks. These interconnecting feeders usually have breakers that allow the networks to be disconnected when required. A network with this configuration typically operates with the breakers closed, allows power to flow across the two sub-networks. These distribution networks can be made up either of underground cables or overhead lines. The underground cables are usually utilised in urban areas and the overhead lines in rural areas.
1.3.
Maintenance Overview
A distribution network consists of multiple components/equipment such as transformers, cables, meters, bus bars, circuit breakers, poles and other support structures. These
Chapter 1 – Introduction
components need to be maintained and/or periodically replaced to ensure that the power system network is operational and reliable. Maintenance can be classified as preventative or corrective maintenance. Preventative maintenance is maintenance conducted before a component fails, to prevent its failure and impact to the rest of the network. This type of maintenance can also be seen as planned maintenance, as it is planned for and conducted at a predetermined time. Corrective maintenance is maintenance that is conducted once a breakdown has occurred. This type of maintenance is conducted to repair or replace a failed component. This maintenance is also conducted to correct the impact a failed component has had on the power system network. Various topics in power grid maintenance have been studied by various researchers [7], [8]. Xie et al. proposed a power grid maintenance scheduling intelligence arrangement based on power flow forecasting [7]. Their system had a load forecasting module that was based on historical data to forecast the power bus load. Distribution maintenance time scheduling optimisation has been studied using genetic algorithms. The authors stated power flow constraint as one of the optimisation problem constraints [9]. A maintenance optimisation problem can be established where the target is to reduce SAIDI and SAIFI. In the studies mentioned in this section, one of the key aims was to reduce maintenance-related costs. In [10] the authors predict load peaks to determine load flows in restricted transmission networks for maintenance scheduling. Load forecasting can tell how much power will be flowing in different parts of the power system in a future period. This knowledge can assist in developing a plan to have minimal customer’s power supply interrupted when parts of the power network need to be switched off, to be maintained.
1.4.
Electrical Load Forecasting Overview
Load forecasting is the act of anticipating the future load and has been an interesting topic for multiple researchers for over six decades [11], [12]. Load forecasting is divided into short-term load forecasting, that looks at forecasts over an hourly to weekly period, medium-short-term load forecasting looks at two weeks to three months ahead load forecasting and long-term load forecasting looks at yearly forecast periods [1], [13]. Load forecasting has many useful applications, such as network planning and capacity planning. Load forecasting is also useful in maintenance and operations. In distribution utilities, maintenance should be scheduled to have a minimum number of customers disrupted at one time. Having access to accurate load forecasts can give utilities a view of when distribution substations or feeders will be lightly
Chapter 1 – Introduction
6
loaded and when to schedule maintenance outages. The load can at times be transferred onto another feeder if there exists back-feeding capabilities with another feeder in the network. A similar approach can be followed where another transformer in a substation may need to carry the load from a transformer that has to undergo maintenance. Figure 2 gives an illustration of a distribution substation and feeders with different customer loads, to explain the above-mentioned points. The normally open point can be used to connect the reticulation network supplied by feeder 1 and feeder 2. This is achieved by closing the normally open switch. The breaker on the feeder that needs to be worked on can be opened at the supply voltage’s lower voltage side. A similar approach can be followed to isolate one of the transformers. Here breakers on both sides of the transformer that is to be maintained are opened, or isolators for the bus bar section to be maintained are opened. In both cases, the forecasted load of both feeders or transformers will help determine how much additional load the feeder or transformer that will remain in service needs to handle and if this equipment will be able to handle this additional load. Power systems simulation software can be used to determine the system behaviour under this reconfiguration.
Chapter 1 – Introduction
1.5.
Recent Load Forecasting Applications and Studies
Recent load forecasting studies in developed countries have moved past the customer supply point and use recent state art artificial intelligence (AI) techniques [14], [15]. Appliance usage patterns were incorporated for load forecasting using a fuzzy logic approach [15]. The smart grid was one of the common drivers of movement past the customer supply point. Deep learning techniques are commonly deployed in most of these recent studies. In [14] long short-term memory (LSTM) was used to forecast residential loads using Canadian households and their 19 appliances data. Long short-term memory recurrent neural networks (LSTM-RNN) were also used to forecast Australian residential loads using publicly available smart meter data [16]. Enhanced deep networks (cycle-based LSTM and time-dependency convolutional neural networks) have been used for medium-term load forecasting [13]. Deep learning techniques were used in this study due to the inability of swallow artificial neural networks (ANN) to accurately conduct the complicated and complex medium-term load forecasting. Deep belief network (DBN) and Copula-DBN were used in [17] to forecast hourly loads in the USA (Texas and Arkansas). In [18] LSTM, combined with characteristic load decomposition application in the data pre-processing, was found to outperform conventional load forecasting approaches. Other recent studies applied classical and ensemble techniques in forecasting loads. Seasonal ARIMA was used to conduct short-term load forecasting for optimal operations planning of electric distribution systems [19]. Autoregressive integrated moving average (ARIMA) was used as it requires fewer variables than other common load forecasting techniques. A holographic ensemble technique was used to forecast Guangzhou’s (China) and New England’s (USA) total and daily peak load [20].
A number of load forecasting studies have been undertaken in South Africa [21], [22], [23], [24], [25], [26]. However, the study of the application of AI in South African load forecasting is still in its infancy and limited. Some of the studies are outdated. IjumbaandHunsley’s study is from the late 1990s and does not consider the latest state of the art AI techniques [22]. The study focused on residential loads and had separate models to forecast weekday and weekend loads. The study of the application of deep learning techniques on South African load forecasting is almost non-existent.Marwala studied the South African total consumption load forecasting using AI. His work also looked at main drivers, related to the industrial and mining indices, as drivers for total load growth [27]. Load forecasting in South African
Chapter 1 – Introduction
8
distribution networks has not been pursued at distribution substation and substation feeder level. The load forecasting performance of different state of the art machine learning and deep learning for different consumer types has not been studied. Yuill et al. studied South African load forecasting for optimal generation scheduling [23], [24]. The researchers focus on forecasting loads 30 minutes ahead over a day. The authors include temperature and humidity in their study. In one of the recent South African load forecasting studies, ANN was used to forecast the net energy consumption [28]. In another South African load forecasting study, Inglesi used a vector error correction model to forecast the aggregate South African electricity demand [29].
1.6.
Machine Learning and Deep Learning
AI had its inception in the 1950s, emerging from computing, psychology, mathematics, engineering and cybernetics. AI's main objective is to develop a system that achieves human-like competence and intelligence in completing complex tasks [30]. The term, AI was introduced in 1956 by McCarthy. The early stages of AI focused on developing theorem proving and game playing programs. Modern AI is focused on techniques for human-like reasoning, planning, learning, language and pattern recognition [31]. Alan Turing proposed the Turing test in 1950. The Turing test is a test of intelligence. A computer passed the test if a human interacting with it was not able to distinguish if a response was from a computer or a human being. AI researchers have however not devoted time to passing the Turing test, due to the belief that it is less important to duplicate an example as opposed to understanding the underlying principles [32]. To deduce that a program thinks like a human, some understanding of how a human thinks is required. This understanding can be established through three approaches: introspection, psychological experiments and brain imaging. Cognitive science links the AI computer models and psychological experiments to develop precise and testable human mind theories [32]. Machine learning is a subset of AI that is based on learning processes, which allow the evolution of machines without the change of algorithms [33].
With the advancements in technology, computational power has increased. This has led to an uptake in the application of deep learning techniques. Deep learning techniques are special AI techniques that have multiple layers, that enable them to learn more features from the data. These techniques have been popular in language processing and computer vision [34].
Chapter 1 – Introduction
Their use has also spread to other areas and sub-areas, such as load forecasting, cancer detection, voice assistants such as Apple's Siri [34], [35], [36]. Facebook’s DeepFace, which uses deep learning for human facial recognition, has achieved 97.35 % accuracy in identifying human faces versus a human's accuracy of 97.5 % [37]. Self-driving cars are another technology where AI is playing a pivotal role. Google’s Waymo has successfully tested their self-driving cars on different USA public roads, in different cities [38]. Tesla sells its cars with the hardware required for autonomous driving. Their cars have been tested on public roads [39]. Deep learning enables these cars to identify objects, allowing the cars to: navigate without driving into objects, follow road signs, drive in lanes, etc. A number of companies have developed AI platforms to enable the development of AI models and to provide processing power. These platforms include Alibaba cloud, Amazon web services respectively by Alibaba and Amazon.
These companies have also integrated AI in their business processes to improve how they serve their clients. Alibaba deploys deep learning for different tasks such as: to recommend products to its customers, to attend to client queries using chatbots and to deliver orders to their customers using drones [40]. General Electric Healthcare deploys machine learning to improve patient outcomes. One of the areas this company has applied deep learning in is the improvement of x-ray technologies [41].
1.7.
Data Integrity
At the heart of AI are the data. Machine learning and deep learning techniques learn from data. These techniques are therefore as good as the data given to them to learn from. This is also true for human beings. Given that a child grows up being taught without visuals that a cat is an animal, with fur, two eyes, and two ears and does not grow to be bigger than 30 CM in height. If this child is shown a picture of a puppy, what would he or she classify the animal in the picture as? If the puppy in the picture is smaller than 30 cm, with fur and with both eyes and ears are in place, the child might call the puppy a cat. This decision will be based on the information given to the child about a cat. In this case, even though the data about the cat was correct, it was limited. In a similar manner shortage of training data or data lacking integrity can lead to AI models giving unexpected or incorrect results. Data integrity can be defined as information reliability, usability, relevance and quality. Lack of data integrity can be due to multiple sources such as non-functional measuring instrument or computer,
Chapter 1 – Introduction
10
misunderstanding, technology limitations and faults during data transmission. These sources can lead to data that are [42]:
• Incomplete
• Noisy
• Inconsistent
1.8.
Problem Statement
South African distribution power utilities are experiencing a financial strain. Non-technical losses are on the rise, aging equipment requires maintenance or upgrades, and new customers need to be connected to the grid. This work requires scheduled power outages to enable safe working conditions. These power outages typically lead to a loss of revenue due to customers being without supply. Further financial losses can be experienced from other sources, such as rescheduling work that need to be conducted by contractors due to lack of planning. Not carrying out these outages can lead to a loss of revenue from frequent equipment failures. These failures can lead to expensive emergency work being required, damages to the environment, injuries to humans, etc.
As challenges increase for distribution utilities, limited strategies are developed and deployed to plan utility upgrades and maintenance. There was, therefore, a need to:
• Introduce and utilise state of the art techniques to optimise distribution operations
• Achieve accurate distribution load forecasting to drive optimal maintenance planning
1.9.
Research Objectives and Contributions
This research’s novelty is the introduction of a unique South African distribution networks load forecasting system that utilises state of the art machine learning and deep learning techniques. The research further contributes to the body of knowledge by introducing the application of load forecasting in South Africa using deep learning techniques. The comparison of load forecasting performance of state of the art AI techniques for different South African distribution customer types, and the impact of data clean-up and weather parameters is another novel contribution of this research. The research also introduces AI in determining distribution loading data integrity. The research’s four contributions are discussed next:
Chapter 1 – Introduction
1. Introduction of a unique South African distribution networks load forecasting system that utilises state of the art machine learning and deep learning techniques
Why are the current methods insufficient?
Current load forecasting research in South Africa is focused on total demand and very short-term for demand and supply balancing in power dispatching. There is currently no research work being conducted at a distribution substation level with a forecast window long enough to influence maintenance planning. The current research work is outdated and does not investigate recent state of the art techniques.
How does the current system work?
The current systems in S.A. do not use AI techniques for load forecasting to improve maintenance planning. Utility engineers sometimes use naïve methods to forecast loads to inform network configuration and maintenance scheduling. Naïve methods are globally outdated in load forecasting and usually consider limited data to inform a decision.
What needs to be done?
A system that takes advantage of the technological development, such as powerful and recent state of the art machine and deep learning techniques, needs to be introduced in distribution load forecast.
How does this solve the problem?
Recent state of the art AI techniques, such as deep learning, can utilise larger quantities of data to efficiently forecast distribution networks loads. These load forecast can then be utilised to improve utility maintenance planning.
2. Introduction of the application of deep learning techniques in South African load forecasting
Why are the current methods insufficient?
Deep learning techniques have not yet been applied in South African load forecasting and South African distribution networks load forecasting.
Chapter 1 – Introduction
12
How does the current system work?
Other machine learning techniques have been studied/applied in total demand load forecasting and day ahead load forecasting for optimal power dispatch.
What needs to be done?
Deep learning techniques need to be studied and applied in South Africa load forecasting to harness their ability to learn more features.
How does this solve the problem?
Deep learning techniques can lead to high accuracy load forecasts.
3. A novel comparative study of sophisticated AI techniques’ performance on different South African distribution customers. An investigation of the impact of data clean-up and the inclusion of geographical temperature on the performance of these techniques per customer type is also studied
Why are the current methods insufficient?
A comparative study of AI application on different South African distribution customer types has not yet been studied. The impact of temperature and data clean-up on the performance of recent AI techniques for different South African distribution load types has also not been investigated.
How does the current system work?
Temperature has been included in a South African load forecasting study and is usually considered to have an impact on the load forecast accuracy. The impact of excluding temperature against including it in the development of AI techniques models and on different South African loads has not yet been studied. The impact of cleaning dips and spikes from different South African distribution customer types power consumption/loading data on AI techniques’ performance has also not been studied.
What needs to be done?
Data preparation and sourcing weather data can be daunting tasks. Access to weather data is sometimes not possible or the data need to be purchased if it is to be used
Chapter 1 – Introduction
commercially. Hence, the impact of these two parameters on the load forecasting of different distribution customer types needs to be well understood before committing time and money to them.
How does this solve the problem?
This understanding can lead to utilities achieving high accuracy load forecasting without the need to invest (time and money) in these two areas or being able to justify the investment.
4. Introduction of a novel AI based process to determining distribution loading data integrity
Why are the current methods insufficient?
AI has not been applied to determine South African power systems distribution network data integrity.
How does the current system work?
Business Intelligence and other visual tools are implemented to determine loading data integrity. This can be a time-consuming process depending on the amount of data being analysed.
What needs to be done?
With data sizes growing utilities can utilise AI techniques in their process to determine their loading data integrity.
How does this solve the problem?
This can save utilities time and money by freeing up their staff’s time, having a view of areas in the distribution network that have data integrity issues and have the issues addressed to enable data utilisation to help take improved business decisions.
1.10.
Thesis Layout
Chapter 2 presents an overview of AI. Examples of application of machine learning and deep learning techniques are given in this chapter. The techniques used in this study, ANFIS, OP-ELM, LSTM-RNN and restricted Boltzmann machine's DBN, as well as their advantages and
Chapter 1 – Introduction
14
disadvantages, are also presented. The chapter also discusses the concept of learning and intelligence. Classification, forecasting and prediction are also briefly defined.
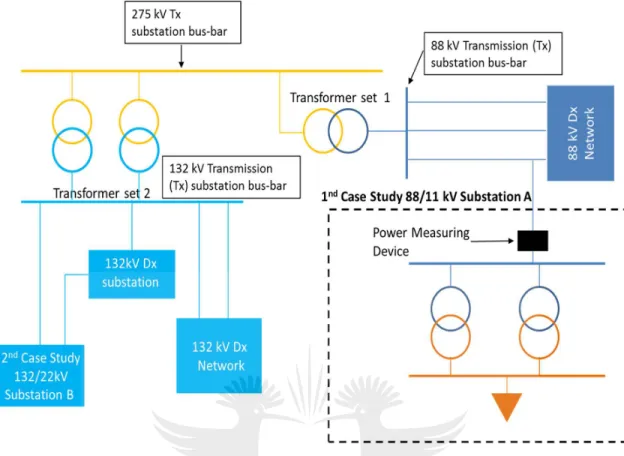
Chapter 3 presents the proposed load forecasting system. The experimental setup is presented together with the three performance measures that are used to measure the AI model’s performance in this study. These performance measures are the following error measurements; symmetric mean absolute percentage error (sMAPE), mean absolute error (MAE) and the root mean square error (RMSE). The statistical significance test used to measure if a significant difference exists in the performance of the different techniques is also presented. This chapter further presents an AI approach to determine loading data integrity. Chapter 4 gives the first experimental case study on distribution substation A, which is a power redistributor customer. The substation has two 40 MVA, 88/11 kV transformers. The distribution network overview and data used for experiments are presented. The results for this case study are presented and discussed.
Chapter 5 presents the second distribution substation case study (substation B). The substation supplies a single industrial customer through multiple supply points and at different voltage levels (132/22 kV) to substation A. The results of the experiments for this substation are presented and discussed.
Chapter 6 presents the third case study (Substation C). The substation is a power redistributor supplied power at 132 kV. The load forecasting performance of the four techniques’ models in load forecasting are presented. A comparison between the findings of the three case studies is also presented in this chapter.
Chapter 7 gives concluding remarks through a summary of the findings. Recommendations for future work on machine learning and deep learning techniques application in distribution power systems and distribution load forecasting are suggested.
1.11.
Chapter Summary
This chapter introduced distribution power systems networks. A typical power system setup was also outlined. A load forecasting literature review was presented, together with a South Africa specific load forecasting literature review. Machine learning and deep learning concepts were introduced. The problem statement was presented together with the research
Chapter 1 – Introduction
objective. The research objective presented and discussed the research’s novel contribution. The layout of this thesis was also outlined in this chapter.
Efficient Use of Deep Learning and Machine Learning for Load Forecasting in South African Power Distribution Networks
Chapter 2 – Artificial Intelligence
“The measure of intelligence is the ability to change.”
Chapter 2 – Artificial Intelligence
2.1.
Introduction
Chapter 1 introduced distribution power system networks, load forecasting and AI aspects. The chapter also presented the research problem statement and contributions. A load forecasting literature review was presented, which included a South African specific load forecasting literature review.
This chapter introduces machine learning and deep learning, as well as the specific machine learning and deep learning techniques used in this research. A machine learning and deep learning literature review is also presented in this chapter. This literature review looks at the application of machine learning and deep learning in different fields. The concepts of machines that are capable of learning and are intelligent towards human levels are presented.
2.2.
Knowledge, Intelligence and Learning
Human beings use knowledge to help them make everyday decisions. Knowledge is key in building AI systems. Knowledge can be defined as the state of knowing or a human being accumulating a body of facts and principles. Knowledge has familiarity with procedures, rules, ideas, abstraction, customs, facts, etc. Knowledge has three key basic concepts, namely, a data set, a form of information and belief or hypothesis. Knowledge can be one or all of these concepts in a slightly different form. Data is a raw form of observation, and knowledge is organised data and procedures which have some useful purpose. Information is data plus its meaning. Information can be classified as knowledge if it can create more information and become a part of some action. Knowledge is a true justified belief as opposed to just a coherent expression (belief) or a belief that may or may not be true but is supported by some fact (hypothesis). The relation between knowledge and intelligence lies in that, to be intelligent one needs access to and possession of knowledge [31].
The Oxford Dictionary defines intelligence as “the ability to acquire and apply knowledge and skills”. Intelligence’s exact definition is not known. There has however been a number of different definitions of intelligence [31], [43].
“Intelligence = ability to accomplish complex goals”
“Intelligence is the ability to learn, to deal with different situations, to acquire, understand
Chapter 2 – Artificial Intelligence
18
As there are different goals that different species can try to obtain, quantifying intelligence becomes a futile exercise. For example, who is more intelligent between a chess Grandmaster and a chief executive officer (CEO) who turns around a multibillion-Rand company from near bankruptcy? Due to different goals, it is not easy to deduce who is more intelligent than the other. This challenge is because the Grandmaster may or may not be able to turn around a company, the CEO may or may not be able to defeat the chess Grandmaster in chess. In addition the CEO may not be able to turn around a company which is in the same state but in a different sector. If however, there exists a third person who can accomplish both tasks and is better at one of the tasks, say company turnarounds in different industries, it may be safe to say that she or he is "more intelligent" than the original CEO. Since there are spectrums of intelligence, the argument of whether an entity is intelligent or not in borderline cases is at times not worthwhile. An example is who, between a toddler in a pre-school soccer team or a professional football player like Lionel Messi who plays for one of the biggest soccer teams in the world, has the ability to play soccer. Before discussing the ‘Artificial’ part of ‘Artificial Intelligence’, it is important to also state three earliest and most accepted definitions of intelligence which are [31]:
“Intelligence is a state grasping the truth, involving reason, concerned with action about
what is good or bad for human beings….”
“The ability to learn or understand from experience, the ability to acquire and retain knowledge and the ability to respond quickly and successfully to a new situation, use of the
faculty of reason in solving problems, directing the conduct effectively. ”
“The test of the first rate intelligence is the ability to hold two opposite ideas in the mind at
the same time and still retain the ability to function.”
‘Artificial’, refers to something that is not natural or is not real. Human intelligence can, therefore, be regarded as ‘real intelligence’ as humans naturally develop their intelligence. AI is created using mathematics, engineering, computers, data, etc. and is not regarded as real intelligence [31].
As stated previously, to be regarded as intelligent one must possess knowledge. Learning is key to acquiring knowledge. Thus, for a machine to be intelligent it has to have the ability to learn. This is where the concept of machine learning comes in. Learning has two key features
Chapter 2 – Artificial Intelligence
– skill refinement and knowledge refinement. Skill refinement is the improvement of a skill by repetitive execution of the same task. Knowledge acquisition is skill improvement by being able to gain knowledge or remembering past experience. An entity can learn in five different ways, by [31]:
i. Memorisation ii. Taking advice iii. Induction iv. Deduction
v. Analogy
Memorisation, also known as rote learning, is repeatedly storing a task's data for use in performing the task in the future [44]. In this case, whenever a task is performed, the memory is used to determine the best option from the possible options based on what has been observed to work well and what has been observed in the past. Learning by taking advice
involves an external person giving advice, guidance or instructions to the person seen as learning. An example of this is a baby learning from his or her parents. This type of learning is common throughout a person's life. Likewise, when an engineer writes a piece of code to run on a computer, the code can be seen as a set of instructions that tell the computer what to do [44]. Induction means generalising from specific instances [31]. This case can be likened to the observations of a number of BMW (Bavarian Motor Works) vehicles and then being able to tell when presented with a picture of a car if it is a BMW or not, and if it is a BMW which model it is. Deductive learning is based on improving performance by exploiting the previous problem-solving experiences [44]. Here an entity uses what they found to work or not to work in solving previous problems to solve a current problem. Analogy is a strong inference tool which human reasoning and speech are full of. In inference, there is usually an underlying meaning based on the mapping of concepts which seem to be dissimilar [44]. An example is when one says, “He kept an eagle's eye on the opponent". Which means he was closely watching the opponent and not that that he took an eagle’s eye and put it on the opponent.
Chapter 2 – Artificial Intelligence
20
2.3.
Application of Deep Learning
The rise of computational power and access to big data has enabled progress in deep learning techniques. These techniques have been popular in language processing and computer vision, and have for example, led to computers being able to interpret handwritten text with high accuracy [36], [45], [46]. The use of deep learning techniques has spread to other topics such as load forecasting, solar energy forecasting, and electricity price forecasting [47], [48], [49]. The most popular deep learning techniques are DBN, convolutional neural networks (CNN) and recurrent neural network (RNN). LSTM-RNN's performance has been shown to supersede or match the state of the art techniques [50]. LSTM has also been shown to outperform CNN in energy consumption forecasting and natural language processing [50], [51]. DBN differs from CNN and RNN in that they combine unsupervised learning and supervised learning in their learning process. DBN has been applied in energy load forecasting, very short-term wind power prediction, wind speed forecasting and photovoltaic power forecasting [52], [53], [54], [55]. CNN was found to have comparable performance to RNN and DBN, but outperformed SVR, in energy load forecasting [52].
LSTM has been used to forecast wafer lots’ short-term cycle time for production planning and control in semiconductor wafer manufacturing [56]. In [57] the authors use LSTM to automatically generate conversations. The LSTM models are deployed as chat bots. In another application, LSTM was used to recognise single Chinese character font [58].
DBNs have been applied in various areas including medicine, text recognition, computer vision, and many other applications. Jemimma et al. utilised DBN to segment and classify brain tumours [59]. DBN has also been used to classify pedestrians, bikes, motorcycle and vehicle classification using a small training data set [60]. In [61] DBN was used to diagnose wind turbine gearbox faults. DBN has also been used to detect intruders on a computer network [62].
Deep learning techniques have been applied in domestic violence identification [63]. Victims in critical need were identified by analysing Facebook posts and identifying important words that might indicate critical posts. Deep convolutional neural networks were used to classify music [64]. The aim of this study was to investigate the performance of the deep CNN when
Chapter 2 – Artificial Intelligence
the data contains noise. CNN has also been used to detect breast cancer using crowd-sourced images [65]. CNN has also been applied to determine human personality traits from text [46].
2.4.
Application of Machine Learning
Machine learning has been widely used across multiple fields such as engineering, power systems, medicine, economics, insurance, gaming, social media, law, emergency response, search and rescue, online shopping, voice assistance, robotics and military.
Machine learning is the process of machines learning from data to be able to give an answer similar to that which a human could give. There are various machine learning techniques such as ANFIS, OP-ELM, ANN, autoregressive moving average (ARMA), ARIMA, autoregressive moving average with exogenous variable (ARMAX) and support vector machine (SVM). The detailed manner in which these techniques learn is different, but follows a similar principle based on the learning approach. The general learning approach is to present a set of data inputs and targets to the machine learning model. The model then tries to predict the output and learns by adjusting its parameters based on the error between the predicted and target value. These machine learning techniques sometimes suffer from a number of challenges during training or application. Examples of challenges are overfitting, not finding an optimal solution due to getting stuck on local minima, unexplainability, and many others. Researchers have come up with workarounds to these challenges. These workarounds include combining two or more techniques to leverage their strengths. An example is the combination of fuzzy logic and ANN to form an ANFIS, which enables the manner in which the model gets to its output to be explainable.
ANFIS and other machine learning techniques, including ARIMA, ARMAX, ANN and evolutionary algorithms have been applied in load forecasting [1], [21], [25], [66], [67], [68], [69], [70], [71]. ANFIS was found to be more superior to these techniques in a number of these studies [21], [70], [71]. ANFIS has also been applied in rainfall prediction, robot stabilisation control and image tracking, DC motor speed control, navigation systems, power electronics converter stages open circuit fault diagnosis [72], [73], [74], [75], [76]. The performance of ARIMA, ANFIS and an ensemble of the two techniques was compared for rainfall prediction. The two individual methods showed better performance than their ensemble, each in one of the two respective towns that were under study [72].
Chapter 2 – Artificial Intelligence
22
Computational complexity has been observed to increase with an increase in the data used. Due to high computational power not always being available, there was an inclination to not use non-linear models as broadly. This decline was despite the models’ overall good performance [77]. Huang et al. introduced extreme learning machines (ELM), which is an algorithm that reduces neural networks’ computational time and model structure selection of neural networks [78]. ELM has been applied to solve various problems such as predicting stock volatility, forecasting wind generation, analysing power utility non-technical losses, forecasting electricity prices and load forecasting [27], [79], [80], [81], [82]. In [27] OP-ELM was found to outperform ANFIS, ARMA, support vector regression (SVR), ANN and ELM in South African electricity demand forecasting. Wang et al. found that multi-kernel ELM outperformed basic-ELM, single kernel ELM, SVM and back propagation neural network (BP-NN) in most cases, in predicting the Hong Kong Exchange stock volatility [79].
Another application of machine learning in stock exchange is the study conducted by Khoza et al. on stock price prediction for the Johannesburg Stock Exchange stocks [83]. Here rough set theory was used to extract a set of reducts and trading rules to predict stock prices. An ensemble of rough set theory and multi-layer perceptron has been used to predict the direction South Africa’s GDP will turn [84]. Ensemble techniques have also been applied in photovoltaic (PV) systems maximum power point tracking (MPPT). Farayola et al. investigated and compared the performance of ANNs combined with rational quadratic gaussian process regression (RQGPR), ANN combined with linear SVM regression and ANN in MPPT [85]. The ensemble of ANN and RQGPR was found to achieve the best results. Machine leaning techniques: random forest, boosting and SVM, were applied to detect fake identities on twitter accounts [86]. This research shows that features used to detect fake accounts created by bots are not similar to those required to detect fake accounts created by humans. The machine learning techniques used here achieved the best accuracy of 49.75 %, which is lower than the accuracy one would achieve when taking a guess. SVM was also applied to identify endangered tree species in Dukuduku forest in South Africa [87].
2.5.
Techniques Applied in This Research
Four techniques are applied in this research for load forecasting, two machine learning techniques (ANFIS and OP-ELM) and two deep learning techniques (RBM-DBN and