U
NIVERSITÀ DEGLI
S
TUDI DI
N
APOLI
F
EDERICO
II
P
H
.D.
THESIS
IN
I
NFORMATION
T
ECHNOLOGY AND
E
LECTRICAL
E
NGINEERING
B
IG
D
ATA
A
NALYTICS FOR
F
LOW
-B
ASED
A
NOMALY
D
ETECTION
IN
H
IGH
-S
PEED
N
ETWORKS
M
AURO
G
AROFALO
T
UTOR
:
P
ROF
.
G
IORGIO
V
ENTRE
XXIX CICLO
S
CUOLAP
OLITECNICA E DELLES
CIENZE DIB
ASEAbstract
The Cisco VNI Complete Forecast Highlights clearly states that the Inter-net traffic is growing in three different directions, Volume, Velocity, and Variety, bringing computer network into the big data era.
At the same time, sophisticated network attacks are growing exponen-tially. Such growth making the existing signature-based security tools, like firewall and traditional intrusion detection systems, ineffective against new kind of attacks or variations of known attacks.
In this dissertation, we propose an unsupervised method for network anomaly detection. This method is able to detect unknown and new malicious activities in high-speed network traffic.
Our method uses an innovative detection algorithm able to identify the hosts responsible for anomalous flows by using a new statistical feature related to traffic flow. This feature is defined as the ratio between the number of flows generated by a host and the number of flows it receives.
We evaluate our method with real backbone traffic traces from the Measurement and Analysis on the WIDE Internet (MAWI) archive.
Fur-thermore, we compare the results of our method with MAWILab archive, a database that assists researchers to evaluate their traffic anomaly detection methods.
The results point out that our method achieves an average positive prediction rate (i.e. Precision) of 90% outperforming the four MAWILab detection methods in terms of false negative rate.
We deploy three cluster configurations to evaluate the horizontal and vertical scalability performance of the proposed architecture and our method shows outstanding performance in terms of response time.
Table of contents
List of figures xi
List of tables xiii
1 Introduction 1
1.1 Background . . . 1
1.2 Motivation . . . 4
1.3 Thesis Contribution . . . 5
1.4 Thesis Organization . . . 7
2 Network Traffic Measurements 9 2.1 Network Monitoring . . . 10
2.1.1 Active Measurements . . . 10
2.2 Packet-Level vs. Flow-Level Measurements . . . 12 2.2.1 Packet-Level . . . 12 2.2.2 Flow-Level . . . 13 2.3 Flow Monitoring . . . 14 2.3.1 Flow Exporter . . . 14 2.3.2 Flow Collector . . . 18
3 Intrusion Detection System 19 3.1 Introduction . . . 19 3.1.1 Host-Based IDS . . . 20 3.1.2 Network-Based IDS . . . 20 3.2 IDS Taxonomy . . . 21 3.2.1 Misuse-Based IDS . . . 21 3.2.2 Anomaly-Based IDS . . . 21 3.3 Network Activities . . . 22 3.3.1 Benign Activities . . . 22 3.3.2 Malicious Activities . . . 22 3.3.3 Network Attacks . . . 23 3.4 Network Anomalies . . . 23 3.4.1 Alpha flows . . . 24 3.4.2 Flash crowd . . . 24 3.4.3 Worms . . . 24
Table of contents vii 3.4.4 Network Scans . . . 24 3.4.5 Port Scans . . . 25 3.4.6 DoS attacks . . . 25 3.4.7 DDoS Attacks . . . 26 3.5 Datasets . . . 27 3.5.1 Synthesized traces . . . 27
3.5.2 Collected Real Traffic . . . 29
3.6 Anomaly Detection . . . 31
3.6.1 Statistical Methods . . . 32
3.6.2 Machine Learning Methods . . . 33
3.7 Flow-based anomaly detection . . . 34
3.8 Final remarks . . . 37
4 Big Data Analytics and Network Monitoring 39 4.1 Introduction . . . 39
4.2 Network Solutions for Big Data . . . 41
4.3 Big Data Solutions for network . . . 43
4.4 Big Data Analytics Tools . . . 45
4.4.1 Apache Hadoop . . . 45
4.4.2 Apache Storm . . . 46
4.4.3 Apache Kafka . . . 47
5 Proposed Architecture for Flow-Based Anomaly Detection 49
5.1 Introduction . . . 49
5.2 Objectives of the Proposed Architecture . . . 50
5.3 Proposed Architecture Model . . . 51
5.3.1 Acquisition Layer . . . 52
5.3.2 Analysis Layer . . . 54
5.4 Implementation Details . . . 54
6 Evaluation and Results 57 6.1 Introduction . . . 57
6.2 The Dataset: MAWI . . . 57
6.3 Dataset characterization . . . 60
6.3.1 Flow per Minute . . . 61
6.3.2 Duration . . . 61
6.3.3 Number of Ports . . . 62
6.3.4 Bytes and Packets Transferred . . . 62
6.4 The Gold Standard: MAWILab . . . 63
6.4.1 Taxonomy . . . 67
6.4.2 MAWILab Characterization . . . 68
6.5 Efficiency Evaluation . . . 70
6.5.1 Evaluation Metrics . . . 70
Table of contents ix 6.6.1 Experimental Result . . . 71 6.6.2 Rule-based Refinement . . . 74 6.7 Performance Evaluation . . . 75 6.7.1 Testbed Setup . . . 75 6.8 Final Remarks . . . 76 7 Conclusion 79 7.1 Review of findings and contributions . . . 79
7.2 Future Works . . . 81
List of figures
2.1 Flow Monitoring Architecture . . . 15
4.1 BDA - Batch Analysis . . . 45
4.2 BDA - Streaming Analysis . . . 47
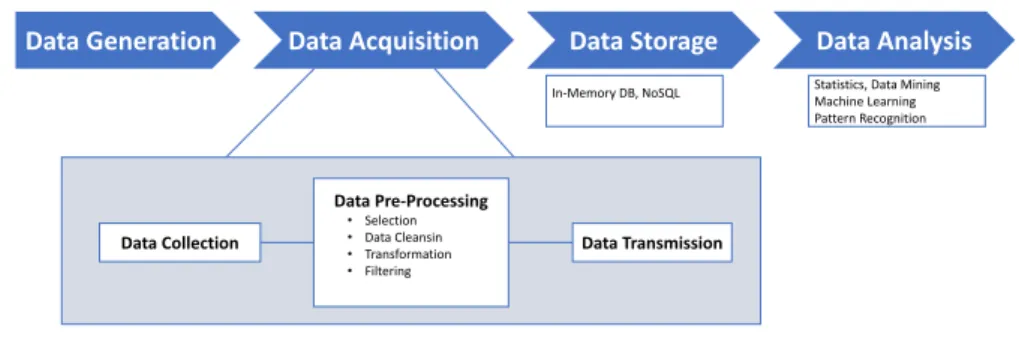
5.1 Big Data Value Chain . . . 50
5.2 Architecture Model . . . 53
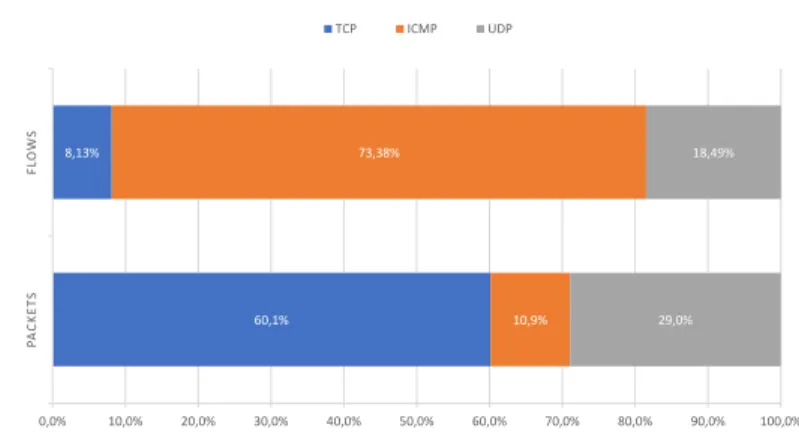
6.1 MAWI dataset - Protocol breakdown . . . 59
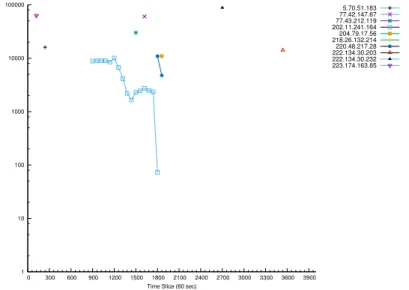
6.2 High hitters - Production Rate . . . 61
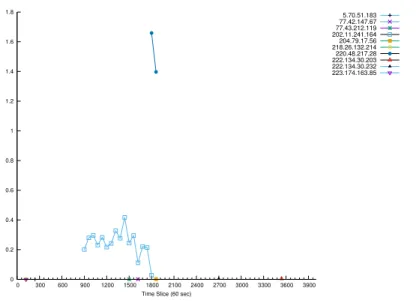
6.3 High hitters - Duration . . . 62
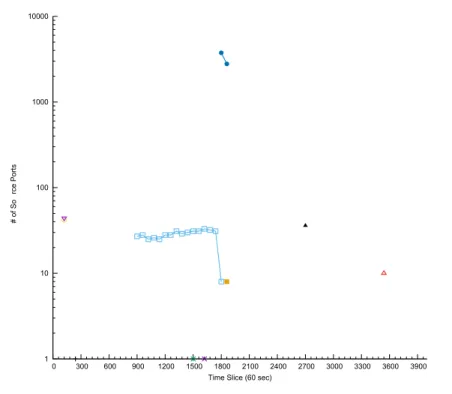
6.4 High hitters - Source Ports . . . 63
6.5 High hitters - Contacted Ports . . . 64
6.7 High hitters - Packet Rate . . . 66
6.8 MAWILab - Taxonomy . . . 68
6.9 MAWILab - Anomalies Percentage . . . 69
6.10 Algorithm Precision Comparison . . . 72
List of tables
2.1 Cisco Netflow record . . . 17
6.1 MAWILab - Attacks Percentage . . . 69
6.2 MAWI - Protocol Breakdown . . . 70
6.3 Confusion Matrix . . . 73
Chapter
1
Introduction
This chapter gives an overall description of this dissertation. It is divided into four sections. First of all, Section 1.1 describes the context in which the thesis has been developed. Section 1.2 presents the motivation. Then, Section 1.3 shows the primary objectives and the original contribution. Finally, Section 1.4 outlines the remaining of the thesis chapters.
1.1
Background
Nowadays, more and more services are available on the Internet, and their use becomes widely pervasive. Thus most of such services are heavily dependent on a network access and their use is no longer confined to IT experts. People use chat applications and social media to communicate with each other, e-banking services to manage their money and watch movies on video streaming services. It has been reported that Video
streaming is responsible for about the 70% of Internet traffic peak in North American fixed access networks, and this figure is expected to reach 80% by 2020 [17].
Apart from the ascertained foreseen increase of data Volume for the Internet traffic also Velocity and Variety of data will increase in the next few years.
This trend is driven mainly by two factors. In the first place, the steady growth of devices connected to the Internet. In fact, a large variety of devices, such as mobile phones, personal computers, IP cameras, wireless measurement sensors and more in general Internet of Things [46, 32], leads to the creation of a significant data volume in a variety of data types. Second, the improvements in the communication technology allowed the spreading of the current high-speed networks with traffic speed never seen before. Since Volume, Variety, and Velocity are the 3Vs characteristics that define the Big Data [53], thus the network traffic monitoring can be considered as a Big Data problem [28]. In the meanwhile, the number of attacks against computer networks is increasing at the same notable rate. In particular, the homogenization of mobile operating systems, where Android take the 87% of market share [39], combined with the increase in computing performance of smartphone devices and the spreading of 4G communication technology [67], make the smartphones a desirable target for attackers. In this scenario, measuring traffic characteristics in a more effective way is crucial for different network activities such as network planning, traffic management and network security. A primitive way to make the network less vulnerable from potential attacks is the
use of a firewall. A firewall is often deployed between the trustedlocal
1.1 Background 3
and outgoing traffic. It stops unauthorized access through the use of simple rules specified by the network administrator. A firewall can provide basic preemptive protection for the systems but it can not detect intrusion or more sophisticated attacks. For this purpose, network administrators need more advanced tools able to identify potential threats to the network. Intrusion Detection System (IDS) is a software (or hardware) alarm-system that looks for intruders who have overcome the measures previously adopted. Furthermore, due to the rapid evolution of attack techniques it is crucial to use detection methods which are effective against both new kinds of attack and variations of known ones. A typical signature-based IDS may not be sufficient to detect these kinds of attack because they need a constant updating of new accurate attack signature. Anomaly-based IDS (ADS) are designed to overcome this issue. In fact, ADSs are able to detect such kind of attacks, but even if attacks are identified, existing methods are usually too slow in terms of response time.
In this dissertation, we propose a network monitoring architecture for anomaly detection (AD). We are capable to achieve real-time like response time by introducing an innovative AD method which exploits Big Data Analytics framework. Finally, we provide a performance and scalability analysis of this architecture in the case it is deployed on an in-house cluster or in the cloud. Moreover, we show challenges and open issues in anomaly detection, and the existing network anomaly detection methods, including their advantages and disadvantages, are discussed.
1.2
Motivation
Anomaly detection is a critical problem common to many research domain. An anomaly can be defined as a pattern in the data that does not conform to the expected behavior, and an Anomaly Detection System (ADS) analyzes the input dataset with the aim of detecting these deviations from the standard pattern of behavior. In the computer network, anomalies are unusual and significant changes in network traffic, and the development of ADSs in high-speed networks come with many challenges to face. The main of them are the lacks of ground truth (Section 3.5), the high false alarm rates, the route cause identification, a significant amount of data to be processed, the time-spending computation, and the needed of a real-time response. With the aim to cope these challenges in mind, this dissertation proposes a flow-based anomaly detection system using Big Data Analytics. As seen in Section 1.1, systems for monitoring high-speed network traffic involve a huge amount data to be observed and its analysis can be prohibitive. Analyze traffic data at packet-level can be not only time-consuming but also superfluous. In order to reduce the volume of data to be analyzed, our proposed architecture analyzes the traffic data at flows-level rather than at the packet-level. Beside the 5-tuple (i.e. source and destination IP addresses, source and destination port, and transport protocol) that identify a flow, for each of them, we record for each flow record a set of statistical features, namely the number of bytes sent, the number of packets, and the duration. For our anomaly detection algorithm. We preferred to use an unsupervised method because supervised approaches assume the existence of a training set (i.e. ground truth). A ground truth dataset is composed by a number of labeled samples, where the labels represent information about at which class (such as
1.3 Thesis Contribution 5
normal or anomaly activity) the entry belongs. Due to the lack of high-quality labeled traffic, we have chosen a statistical-based approach rather than signatures or patterns-based methods. In fact, this approach can operate without any previous knowledge about the traffic. From Telco Operator point of view, an anomaly justifies a more in-depth analysis only if the amount of traffic involved can be deleterious to the proper operation of its network infrastructure. Accordingly, we have focused our efforts towards the identification of volume anomalies which involve huge amounts of NetFlow in a short time. Finally, to realize a system able to detect anomalies in real-time, a scalable and efficient solution is still needed, and traditional systems for data management and analysis are ineffective for the purpose. On the other hand, we exploit modern big data analytics (BDA) tools (i.e. Hadoop, Apache Spark, and Kafka) that are able to handle these time-spending tasks in a more efficient way compared to traditional approaches.
1.3
Thesis Contribution
In this thesis, we propose a system to deal volumetric anomalies (such as DoS, DDoS or port scan), in a Tera-bps networks. Due to the data size and velocity, we analyze traffic flows instead of the single packets passing through the network to face the amount of data expected, and exploit a Big Data Analytics framework (i.e. Apache Spark) to provide a scalable implementation of the anomaly detector.
• The first contribution is the introduction of a volume-based algorithm for network anomaly detection. This algorithm analyzes all the IP flows traversing the monitored network instead of inspecting the payload of each packet. The algorithm makes use of the ratio of the number of flows sent and the number of flows received by every host on the monitored network identifying which is responsible for the anomalies. This method does not require prior knowledge, such as a training dataset or a database of attacks behaviors. We create the input dataset transforming traces from MAWI archive into network flow traces. To evaluate the accuracy of our method we use the MAWILab ground truth, a labeled dataset of identified anomalies present in the MAWI archive traces.
• The second contribution is the development of an architecture that uses algorithm mentioned above to detect the anomalies in real backbone traces. In particular, this architecture has three targets, collect the flows coming from the probes (i.e. flow exporters) de-ployed around the monitored network, process the flows collected and finally analyze the flows to detect anomalies in the traffic. This architecture exploits Apache Spark, a Big Data Analytics framework, to improve the processing performance.
• The third contribution is the deployment of the anomaly detection architecture on the cloud. We implement a testbed on AWS in order to evaluate how our method performs when scaling up and out.
1.4 Thesis Organization 7
1.4
Thesis Organization
The reminder of this thesis is organized as follows:
• Chapter 2(Network Traffic Monitoring),presents an overview of network traffic measurements techniques. Furthermore, a descrip-tion of active and passive measurements and their applicadescrip-tions is provided.
• Chapter 3(Intrusion Detection) presents intrusion detection con-cepts and reviews related work in the area of the network anomaly detection. Firstly, a general overview of IDSs taxonomy is provided. Then, we introduce the definition of attack and anomaly, and finally, a description of the most spread network anomalies is provided. • Chapter 4(Big Data Analytics and Network Monitoring) provides
an introduction to the background of Big Data in general. Then insights on some application of Big Data Analytics technologies to network management, and network architecture solutions for Big Data processing applications like Hadoop. Finally, a brief overview on Big Data analytics tools concludes the chapter.
• In Chapter 5(An architecture for anomaly detection) the proposed architecture and the anomaly detection method are presented. • Chapter 6(Evaluation and Results) describes the tests performed
and it presents the results of these tests. an evaluation
• Finally,Chapter 7concludes this dissertation by summarizing my
Chapter
2
Network Traffic Measurements
In this chapter we describe the network flow monitoring technique, as flows were chosen as data source for the proposed method. The chapter starts with Section 2.1 where a general description and comparison of two main network traffic measurements methods, namely active measurement and passive measurements is proposed. Then, in Section 2.2, some details related to packet level as well as flow level passive measurement techniques are presented.
Finally, in Section 2.3. the classic flow monitoring architecture with its two main components, the flow exporter and the flow collector, are described.
2.1
Network Monitoring
Network monitoring aims to infer useful traffic information through the monitoring, collection, and analysis of traffic data. In order to monitor the network performance, two kinds of measurement can be used, namely active and passive measurement methods [58].
2.1.1
Active Measurements
Active methods are based on the observation of a packets stream [88] created ad hoc for the purpose of measuring service level parameters such as the delay, the packet loss, and the jitter [75]. Active measures involve probes that generate test traffic as similar as the traffic that would be generated by a legitimate user of the service. Synthetic traffic is injected into the network to simulate the use of the service by the user. This traffic is received by one or more intermediate probes. In order to facilitate the measurement, one or more packet fields (such as timestamps or sequence numbers) are modified. Once an intermediate probe receives the test traffic, it can have two behaviors. If the parameter to be estimated involves only the outward traffic, it registers the observed results and evaluates the performance. Otherwise, if the parameters to be evaluated also depend on the return traffic, it reflects the traffic received to the sending probe and allows that it evaluates the performance parameters. Traditional tools for this type of measures are ping [Muuss], and traceroute [52]. The first uses the ICMP (Internet Control Message Protocol) [69] echo request to measure the network latency between two hosts (i.e. the round-trip time). The latter is used for discovery the routing paths from the source host to the destination target host. Usually, it is implemented by transmitting a series
2.1 Network Monitoring 11
of probe packets with increasing time-to-live values. Each hop in a path to the destination host rejects the probe packet (probe’s TTL too small) until its time-to-live becomes large enough for the probe to be forwarded. Each hop in a traceroute path returns an ICMP message that is used to discover the hop and to calculate a round-trip time [70]. Active methods are useful for making measurements in case of the traffic inspection is impossible in a passive way. On the other hand, Active measurements techniques, by injecting additional traffic to the network can potentially influence the measured properties. Thus, these measurements methods need to handle their effects on the measurements quantifying their effects to the measures and implementing practices to minimize such effects. An application of active measurements is presented in our paper [8]. In this work, we proposed an active measurement methodology that allows to acquire and analyze performance data and topology information about the infrastructure of video hosting providers. In the following sections, as in the rest of this dissertation, we focus on the problem of analyzing the network traffic traces collected using passive measures.
2.1.2
Passive Measurements
In contrast to active measurements, passive measurement methods are non-intrusive. Passive methods gather network information by observing the traffic stream of interest without remove, change or add any packets to the packet stream [88]. The functioning of these methods depends on the use of one or more observation points [88] located inside the monitored network (i.e. on switches, routers, or gateways). According to the method in which the observation points collect the data, passive measurement techniques can be classified into two type. The first type of passive measurement
inspects into the packets and receives all packets that pass through the observation points. The second technique filters the traffic of interest and collects only the packets that matching the filter criteria in order to limit the amount of traffic to be analyzed. Regardless the used technique, Observation Points have to send the observed packets, the traffic statistics or both to a collector for the furthermore analysis. In fact, this information is used for various purposes, for example, to infer performance metrics or unveil particular user behaviors. Thus, in network configurations with high data rate, the traffic load generated by the communication between Observation Points and collectors may itself influence the measurements.
2.2
Packet-Level vs. Flow-Level Measurements
The passive measurement can gather the observed packet stream at mainly two different levels of granularity: packet-level, and flow-level.
2.2.1
Packet-Level
In the first case, the measurements are performed using the information re-lated to the single packets. Both packet capturing and analysis phases can be performed inside the Observation Points, or alternatively, the packets are streamed to a remote system for the analysis phase. With the increase of data rate, and consequently with the number of packets, packet-level analysis and storage phases become more and more resources demanding. To cope this problem, the measurements can be performed on a restricted subset of packets of interest by filter or sampling algorithms. Packets sampling can be achieved by random algorithms where the packets
selec-2.2 Packet-Level vs. Flow-Level Measurements 13
tion depends on a random process and systematic algorithms which aim at identifying a statistically significant subset of packets. IETF standard proposals for techniques for packet sampling and filtering are presented in [88] and [19].
2.2.2
Flow-Level
On the contrary respect to the aforementioned packet-level measurements, flow-level measurements collect the traffic information related to a packet aggregation, the flow. The flow represents a statistic summarization of network traffic. According to Internet Engineering Task Force (IETF), a flow is defined as “a set of packets or frames passing an Observation Point in the network during a certain time interval. All packets belonging to a particular flow have a set of common properties” [20]. Packets belonging to a flow have in common a set of key properties. Traditionally, these keys, also know as 5-tuple, are the source IP address, the destination IP address, source and destination transport ports and transport protocol. Therefore, a 5-tuple aggregates all packets belonging to a one-way communication between two hosts on a single socket. In flow-level measurements, the observation points are also called Flow Exporters. For every flow, the Flow Exporter generates various traffic statistics, and it stores them in a flow record. Usually, Flow Exporters are used only for the monitoring phase. Subsequently, they “export” the flow records to a remote component called Flow Collector. Flow exportation is triggered by an active or a passive timeout. In the first case, long-lasting flow records are exported when the timeout expires. On the other hand, in passive timeout, the flow exportation is triggered after a defined period where no new packet is observed. As
well as in packet-level traffic measurements, the demand for computing resources increases hand in hand with the growth of packet rate.
2.3
Flow Monitoring
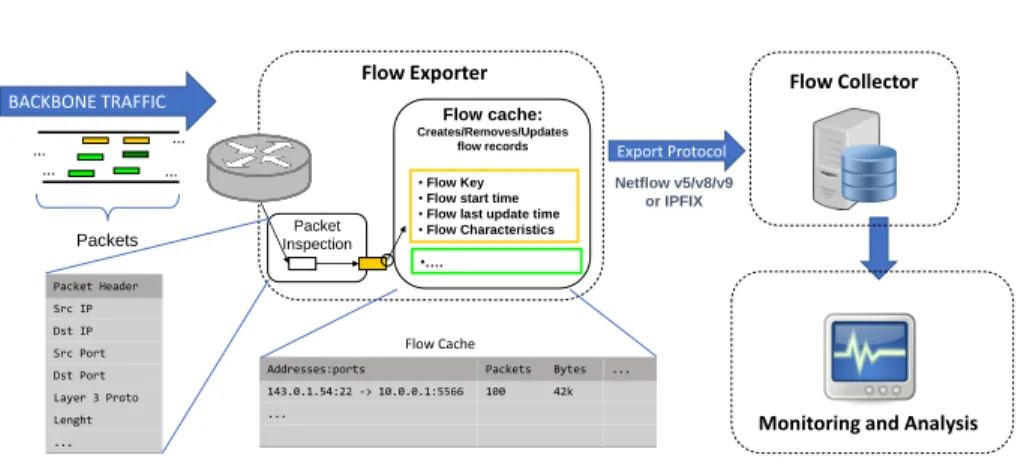
Flow monitoring architecture consists of a hierarchy of functional com-ponents. Features and responsibility of this architecture are spread across these components that perform their tasks subsequently and independently, in a perspective of scalability of the system. Figure 2.1 shows a typical architecture for flow-level network monitoring. Usually, a flow monitoring architecture is composed by a set of Observation Points, where the packets are captured, one or more flow exporter and metering components, and one or more flow collectors. Finally, the captured data are available to a monitoring or an analytics framework for on-line analysis, forensics analysis or both.
2.3.1
Flow Exporter
The flow exporter is the component responsible for the packet observation, the metering process, and the flow exporting process. Observation Point is defined as a monitored network spot where the packets stream is observed. The ports of a router, the interface of a packet forwarding device or the line to which a probe is attached are examples of Observation Points. Flow Exporter exploits a set of Observation Points to read the packets from the line and extracts the header information of each packet passing through them. The final step of packet observation phase is packet filtering and sampling. Packet filtering and sampling algorithms aim to select a
2.3 Flow Monitoring 15 … … … … Packet Inspection Flow cache: Creates/Removes/Updates flow records •Flow Key •Flow start time •Flow last update time •Flow Characteristics •…. Netflow v5/v8/v9 or IPFIX Flow Exporter BACKBONE TRAFFIC Packets Packet Header Src IP Dst IP Src Port Dst Port Layer 3 Proto Lenght ...
Addresses:ports Packets Bytes ... 143.0.1.54:22 -> 10.0.0.1:5566 100 42k ...
Flow Cache
Export Protocol
Monitoring and Analysis Flow Collector
Fig. 2.1 Overview of a typical Flow Monitoring Architecture
certain packets subset for the following phases. The reduction of data to be processed plays a crucial role in using less memory resource, and to preserve the bandwidth. In flow metering stage, the flow exporter aggregates the packets according to a set of key properties (i.e. the flow 5-tuple), into a flow record. All active flow records are stored in a table called flow cache. For each packet, the flow exporter compares the incoming packet header information with the flow entries in the flow cache. If the header information does not match with any existing flows, a new entry is created in the flow cache table. Otherwise, the corresponding flow entry is updated with the information of the new packet header. Flow Exporter looks for expired flow entries in the flow cache. When flow
records expire, the flow exported forwards (i.e.exports) them to the flow
collector. Flow cache entries are considered as expired when they meet one of the following triggering conditions:
• The flow cache memory is full. All the flow entries in the cache table are considered as expired.
• The flow entry exceeds its active timeout. Long-lasting flows active for more in which a specified time are considered as expired. • The flow entry exceeds its passive timeout. After a specified time
that no packets belonging to the flow have been observed for it, the flow is considered as expired.
• FIN or RST flag is observed for a TCP flow. When a TCP packet with a FIN or RST flag has been observed for a flow, the flow is considered as expired.
An example of the fields of a Netflow Version 5 flow record is summa-rized in Table 2.1. Cisco Netflow version 9 [18] and the IPFIX [20] are at state of the art in exporting flow records protocols.
2.3 Flow Monitoring 17 T able 2.1 Flo w record fields of a Cisco Netflo w V ersion 5 Bytes Contents Description 0-3 srcaddr Source IP address 4-7 dstaddr Destination IP address 8-11 ne xthop IP address of ne xt hop router 12-13 input SNMP inde x of input interf ace 14-15 output SNMP inde x of output interf ace 16-19 dPkts P ack ets in the flo w 20-23 dOctects T otal number of Layer 3 bytes in the pack ets of the flo w 24-27 First SysUptime at start of flo w 28-31 Last SysUptime at the time the last pack et of the flo w w as recei v ed 32-33 srcport TCP/UDP source port number or equi v alent 34-35 dstport TCP/UDP destination port number or equi v alent 36 pad1 Unused (zero) bytes 37 tcp_flags Cumulati v e OR of TCP flags 38 port IP protocol type (for example, TCP = 6; UDP = 17) 39 tos IP type of service (T oS) 40-41 src_as Autonomous system number of the source, either origin or peer 42-43 dst_as Autonomous system number of the destination, either origin or peer 44 src_mask Source address prefix mask bits 45 dst_mask Destination address prefix mask bits 46-47 pad2 Unused (zero) bytes
Filtering and Sampling
Before the flow exporting process, filtering and sampling algorithms can be performed to select a subset of flow records. On the one hand, the goal of these phases is to reduce the resources demand of all subsequent steps, which is the same goal of filtering and sampling at the packet level. On the other hand, these two processes are executed on the flow entries in the flow cache instead of the single packet. Thus, when a flow matches any filtering or sampling criteria, either all the packets belonging the flow are considered matching or none.
2.3.2
Flow Collector
The Flow Collector is the component responsible for retrieving and storing of the flow records from the Flow Exporters in the network. At this stage, pre-processing activities are performed for helping further monitoring and analysis process. Examples of pre-processing tasks performed by this component are data anonymization, data compressing, data aggregation, and filtering.
Chapter
3
Intrusion Detection System
This chapter reviews related work in the area of network anomaly detection. The chapter starts with a general overview of the Intrusion Detection Systems. Then, we presented more details on the anomaly detection techniques closely related to the approach proposed in this Dissertation. Finally, some remarks on existing datasets for evaluating network anomaly detection systems are given.
3.1
Introduction
Intrusion detection system (IDS) is an invaluable network security tool that aims to detect potential malicious activities against information systems, and recording useful information for further forensic investigations. IDS is a component in hardware or software that monitors the actions taken in a specific environment (e.g. the host, the network or both) and analyzes
them in order to determine if these activities are a legitimate use of the environment or the evidence of intrusions or attacks against the system. IDS does not prevent the attack from reaching the different resources, either it directly analyzes the real traffic from the client to the server and vice-versa. On the contrary, it analyzes a copy of the traffic that pass through the network probes, such as the routers, computers, etc.
IDS can be classified according to the place where they are deployed
inHost-based, andNetwork-based[25], [74].
3.1.1
Host-Based IDS
Host-based IDS (HIDS) aims to disclose attacks targeted to a specific system (also called host). HIDS running on the monitored host depends on its architecture and operating system. It monitors and analyzes the inbound and outbound traffic only from the host and processes high-level information such as system calls, commands running on the host, changes in specified files. Finally, it reports an alert when it detects a deviation from normal behavior. An HIDS is effective in detecting intrusions that occur within the local network (e.g. a virus installed on the monitored host or if the attacker is on the same network as the victim).
3.1.2
Network-Based IDS
A Network-Based IDS (NIDS) aims to reveal attacks or intrusions on a network as a whole, and its functioning is independent of the architecture of the hosts which may be different from each other and belongs to the monitored network. The primary purpose of these intrusions is due to
3.2 IDS Taxonomy 21
the attacks launched by hackers outside the network who want to obtain unauthorized access to the system for information stealing or to disrupt the normal operation of the network. NIDS is deployed at strategic points within the network to analyze traffic exchanged to and from all hosts within the network itself. NIDS is effective in detecting intrusions from outside the monitored network, such as Denial-of-Service (DoS) attacks, botnet, and network scans.
3.2
IDS Taxonomy
According to the approach used to identify the intrusions, IDSs can be classified in misuse-based and anomaly-based.
3.2.1
Misuse-Based IDS
Amisuse-based IDSsdetects intrusions by matching current pattern with a
set of events, sequences of events (rules) that are the symptom of a security threat. These rules are contained in a predefined knowledge base of attack behaviors. This kind of IDS has a high accuracy to detect well-known attacks, but it is unable to recognize new or variants of known attacks.
3.2.2
Anomaly-Based IDS
On the other hand,anomaly-based IDSsdo not need attack signature
be-cause they perform a comparison with the regular traffic pattern analyzing the network traffic to find abnormal activities, without distinguishing from
malicious and benign. The principal research challenges in ADS are the high number of false alarms rate, the lack of publicly available labeled datasets to be used as ground truth for network anomaly detection[2]. As the network is constantly evolving, the model of normal behaviors may not be accurate in the future. Even if ADSs generate a higher false alarms rate than misuse-based IDSs, they come with the invaluable advantage of being able to detect unknown novel attacks.
3.3
Network Activities
Network activity can be classified according to the purposes of the actors who perform in two types, legitimate (or benign) and malevolent.
3.3.1
Benign Activities
The Benign activities are all the activity that a user or a device performs using the network according to the intended purpose by the network administrator. For example, a student who checks e-mail through the network of the university campus, or a host using a DNS service to resolve the URL of a website perform legitimate activities.
3.3.2
Malicious Activities
On the contrary, a malicious activity is an action carried out by an attacker or a compromised host that has the sole purpose to damage of the services and the hosts on the network. This type of activities can be designed to
3.4 Network Anomalies 23
capture, destroy, modify, or access to information from a network, a host, or users without permission. For example, a bot (i.e a compromised host), which scans a network looking for vulnerable hosts, or a group of hosts that makes a huge number of requests to a service with the only purpose of making it inaccessible to the legitimate users perform malicious activities.
3.3.3
Network Attacks
An attack is defined as an intentional act by which an entity attempts to evade security services and violate the security policy of a system [76]. According to its purpose, an attack can be classified in passive or active attacks.
• Active attacks attempt to alter system resources or affect their opera-tions.
• Passive Attacks try to get information on the target system without changing its resources and subsequently exploit these data to prepare an active attack on the target system.
An attacks Taxonomy was provided by [37].
3.4
Network Anomalies
Network anomalies could be generated either by non-malicious usage of the network and network attacks. In the following, we describe more in these anomalies type.
3.4.1
Alpha flows
Alpha flows are anomalies where the traffic increases from just a few high-volume connections between two hosts. Usually, alpha flows are caused by the transmission of high dimension file over high-bandwidth links.
3.4.2
Flash crowd
Flash crowd consists of an unusually large and quick demand of a specific resource from many clients (i.e. the downloading of a security patch or the live video streaming of a wide interest event). These kinds of events lead the increase of both inbound and outbound traffic (i.e. requests/responses) from the server that contains the resource.
3.4.3
Worms
Worms [71] are self-replicating malicious software that tries to infect other hosts by exploiting specific vulnerabilities. During the propagation phase, the infected hosts send a small number of packets to a large number of target hosts on the Internet.
3.4.4
Network Scans
Network Scan, also known as horizontal scan, is a malicious activity that aims to identify which hosts belonging a specific network (i.e. the target) are alive. To perform a Network Scan, a single host sends a huge number of
3.4 Network Anomalies 25
probe packets to a wide range of destination hosts (i.e. target). Depending on its purpose, an attacker may send each probe packet to a large set of ports or a specific one. In the first case, the attacker is interested in discovering which of the contacted hosts are active. In the second one, they can also detect if the target host has a specific service active on it. The most common scans use probe packets with SYN or ACK TCP flag active, namely SYN scans and ACK scans. Other TCP flags, such as invalid combination for the protocol, can be used.
3.4.5
Port Scans
Port Scan, also know as vertical scan, is a malicious activity that aims to detect all service running on a specific host. Essentially, this type of scan involves a single host that sends the probe packets to a wide range of ports of the target. This operation is performed to check which services are available on the victim host. Usually, this kind of scan uses packets as small as possible for efficiency purpose, such as UDP packet with a one-byte payload.
3.4.6
DoS attacks
DoS attack exploits known vulnerabilities of the communication protocols in order to incapacitate the target host ability to respond to a legitimate request. This malicious activity is performed sending a huge number of requests to the victim server. This overload of requests slows the server in quickly responding to a legitimate user until the target host is unable
to handle all requests both from attackers and legitimate users. Common DoS attacks are TCP SYN Flooding, UDP Flooding, and ICMP Flooding.
TCP SYN Flood
TCP SYN Flood is a DOS attack that takes advantage of the vulnerabilities of the TCP three-way handshake. SYN flood attack aims to occupy all the memory resources of a victim by sending a disproportionate number of TCP SYN requests with spoofed source IP. The victim responds with SYN-ACK packets, but do not get answers because its source IP is forged. Because of the incomplete three-way handshakes, the memory resources of the victim host tend to run out (this depends on the operating system used by the victim), and as a result, the victim is no longer able to accept the legitimate connection requests for a while.
ICMP Flood
ICMP Flood is a flooding attack similar to the SYN flood. It occurs when an attacker overloads his victim with a huge number of ICMP echo requests with spoofed source IP. This type of attack still causes many hardships for network administrators.
3.4.7
DDoS Attacks
Another widely used type of attack is the Distributed DoS (DDoS). It has the same goal of what Dos, however, involves more hosts to give more power to his attack. In DDoS attack, the attacker sends a huge number of
3.5 Datasets 27
packets from multiple hosts toward the victim network. Despite Dos and DDoS threats are not next-generation kinds of attack, they are constantly changing and tend to be a serious threat not only to the users but also for the network infrastructure also.
3.5
Datasets
One of the primary challenge that the anomaly detection poses is the lack of labeled ground truth for evaluating the detection methods. Ground truth data are tough to acquire since they require a solid domain knowledge, may have privacy issue (in the case in which real traffic traces). Last but not less, a high-quality ground truth dataset often needs to be manually created which is a very time-spending process. In the following, useful methods to create a ground truth are presented. Moreover, we provide a brief overview of the available datasets mainly used in literature.
3.5.1
Synthesized traces
One common approach to evaluate a detection method is to use a dataset where the anomalies are synthesized. These anomalies, combined in a background trace (i.e. normal traffic), compose the dataset utilized in the evaluation phase. The background trace can be both real traffic or synthetic traffic. On the one hand, this approach has the invaluable advantage of fully controlling the anomalies inside the dataset. In fact, all the features of each anomaly are defined, such as the duration, start time and end time, the number of packets and their rate, the number of contacted IPs. On the other hand, these datasets have the disadvantage that the anomalies
synthesized refer to well-known behaviors and no recent attacks are being available. Moreover, the distribution of normal traffic and anomalous events is quite unrealistic. Notwithstanding these issues, these kinds of datasets are still spreadly used by researchers in recent work for mainly two reasons: the datasets are publicly available, and they are the unique tool to strictly compare their detection methods with the ones existing in the literature. In the following, we introduce the most important available datasets of synthesized anomalies.
DARPA
The DARPA (US Defense Advanced Research Projects Agency) dataset is one of the most widely used synthetic dataset for anomaly detection evaluation. DARPA 1998/99 dataset was prepared and managed by MIT Lincoln Labs[51]. Its objective was to evaluate intrusion detection systems. The dataset provides five weeks of simulated network traffic collected from the US Air Force-based network and the Internet. More specifically, the traffic data from weeks one and three are anomaly free. The data from weeks two, four, and five contain both normal and simulated attack traffic. Attacks were injected into the synthetic background traffic, using real attack tools in an isolated test bed. The simulated attacks consist of 177 instances of 59 different types of attacks, such as DoS, U2R, R2L, and probe attacks.
KDD99
The KDD99 [KDD] dataset was created by processing the 1998 DARPA Intrusion Detection System Evaluation tcpdump traces. The result is a
3.5 Datasets 29
dataset consisting of nearly five thousand records where each record repre-sents 41 traffic features extracted from labeled connection records. The traffic connection records are labeled, as in DARPA dataset, as normal, DoS, R2L, URL or probe attacks. The KDD Cup dataset provides both training and test set. The KDD set is about 20 years old and has not been updated. Therefore, this dataset may not be a good choice for the evalua-tion of anomaly detecevalua-tion methods that aim to detect current anomalies in nowadays traffic. However, this dataset is still one of the most popular for researchers who want to evaluate their data mining-based methods.
3.5.2
Collected Real Traffic
The other approach to evaluating and validate an anomaly detection method consists in using datasets of traffic collected from real-world networks, such as backbone, campus, and enterprise networks. Using real traffic leads the advantage that anomaly detection methods are “certified” to being able to identify real abnormal events in real network traffic. However, captured datasets are often privacy sensitive, especially when they contain the packet payloads and IP addresses.
CAIDA
CAIDA [CAIDA], the Center for Applied Internet Data Analysis is a collaborative undertaking among organizations in the commercial, gov-ernment, and research sectors aimed at promoting greater cooperation in the engineering and maintenance of a robust, scalable global Internet infrastructure. It collects several different types of data at geographically and topologically diverse locations and makes this data available to the
research community to the extent possible while preserving the privacy of individuals and organizations who donate data or network access. CAIDA provides several traffic datasets for different research purposes such as anonymized backbone traffic, DDoS attack dataset or telescope datasets used for the observation of anomalous behavior. Since these datasets are composed of raw traffic traces that have no labels available, they are unusable as validation set of detection methods.
Abilene
Abilene [Abilene] provides another public available real traffic dataset that is widely used in anomaly detection research domain. The Abilene (also knows as Internet2) is a backbone network that connects various US campus and peering with numerous European and Asian research networks which include 11 Point of Presence (PoP). For each Origin-Destination Flows, with a total of 121 OD flows, this dataset provides the flow statistics measured at five minutes intervals. These statistics are available in Matlab files.
MAWI
The MAWI [16] dataset is a freely accessible real backbone network traffic dataset. The main advantage of this dataset compared to the previous ones is twofold. Firstly the collected traces are very up-to-date. Secondly, MAWI group provides a dataset with labeled anomalies (i.e. MAWILab) for every instance in the traces mentioned above. A more detailed de-scription of MAWI and MAWILab datasets will be provided in chapter 6.
3.6 Anomaly Detection 31
3.6
Anomaly Detection
Anomaly detection is a critical problem common to many research domain. An Anomaly Detection System (ADS) analyzes the characteristics of the
input data with the aim of discoveringdeviationsfrom a normal pattern
of behavior. These deviations are also referred to as anomalies. The term
anomaly often referred as different names such as outliers, exceptions,
aberrations, etc., refers to patterns behavior that differs from what we would normally expect. In the computer network, an anomaly may be caused both by an attack, and a non-malicious traffic activity. According to the IETF definition, “an attack is a deliberate activity by which an entity attempts to evade security services and violate the security policy of a system” [76]. Due to the evolution of the attack methodologies, it is important to use methods able to detect the malicious activity of any nature, both known and unknown. This could be done through an anomaly intrusion detection system. Anomaly IDS approach was introduced for the first time by Denning [26]. Many surveys have been published to classify anomaly detection systems according to the detection methods. The authors in [36], [14] provide a comprehensive review of outliers detection methodologies. They identify three fundamental approaches to the outliers detection problem:
• Unsupervised- This approach operates without ana priori
knowl-edge of data. It is based on the assumption that in the dataset the normality events are statistically more frequent than anomalies.
• Supervised - This approach uses the models of the normality and
the abnormality to operate. In other words, a training set of labeled instance of both normal and anomalous events is needed.
• Semi-supervised- This approach uses models normality. In this case, the training set contains only the instance labeled for the normal events.
It uses two technique: Statistical calculations or Machine Learning (ML) algorithms.
3.6.1
Statistical Methods
Anomaly detection systems based on statistical methods consist of two phases. First, the system observes and collects one or more statistical features of network traffic, subsequent it compares the current state with the stored one using a stochastic method to detect behavior changes. One critical of the challenges in the development of resilient and secure sys-tems is the efficient detection of the malware. In fact, malware is often the point of beginning for various kinds of attacks, such as Distributed Denial of Service (DDoS), phishing and email spamming, which are per-formed through bots deployed on the target hosts. With the purpose to face this challenge, [55] have presented an anomaly detection technique, that uses an Ensemble Empirical Mode Decomposition (E-EMD) algorithm in order to conduct a statistical characterization and decomposition of measured signals. This anomaly detection approach considers the joint network and systems information of every VM gathered at the hyper-visor level. Numerous researchers have successfully applied Principal Component Analysis (PCA) in their network anomaly detector methods (i.e. [49], [49], [72], [44], [48], and [10]). However, as mentioned in [64], PCA detectors are based on the assumption that the data reproduces a combined Gaussian distribution which may be unrealistic in the case of
3.6 Anomaly Detection 33
network traffic. Researchers present in [15] a Holt-Winters forecasting method that uses the entropy of three flow features, (i.e. source IP address, destination IP address, and destination port) to model the normal traffic and exploits the Kullback-Leibler divergence distance to detect network anomalies.
3.6.2
Machine Learning Methods
Machine learning was defined in 1959 by Arthur Samuel as “the field of study that gives computers the ability to learn without being explicitly programmed” [73]. ML allows to uncovering hidden correlation patterns through an iterative learning by sample data (or past experiences) instead of being explicitly programmed. Common classes of problems that ML algorithms can solve are classification, regression, clustering, and outliers detection. Several techniques are applied for anomaly detection and based on the availability of labeled dataset an anomaly detection method can op-erates in Unsupervised, Semi-Supervised, or Supervised mode [14]. Super-vised and semi-superSuper-vised approaches are more suitable for classification problem while unsupervised approach fits better clustering problems.
Unsupervised Anomaly Detection
Cluster analysis (or clustering) is a technique used to group objects of a similar kind into respective categories. Clustering is based on unlabeled data. In machine learning, methods that use labeled samples for the training and validation phases are said to be supervised, or semi-supervised, and methods which rely on unlabeled dataset are said to be unsupervised. Clustering can be achieved by different algorithms that vary in their notion
of what constitutes clusters and how to identify them. Usually, a clustering-based technique requires distance computation between a pair of objects. Clustering was used by [7], [59] (using K-means), and [68].
Semi-Supervised and Anomaly Detection
Both supervised and semi-supervised methods are based on knowledge provided by an external agent and they require labeled training datasets. Specifically, supervised methods need both normal and anomalous in-stances, and semi-supervised methods use only the normal labels. Support Vector Machines (SVM) provide a semi-supervised learning method for the anomaly detection. A flow-based anomaly detection system using a one-class SVM was proposed by [40]. The use of Multi Layer Percep-tron (MLP) neural network for supervised anomaly detection systems was investigated in [41], and [81].
3.7
Flow-based anomaly detection
In literature, there has been a considerable amount of research on anomaly detection based on the flow analysis. Studies related to flow-based traffic analysis have proven useful in identifying anomalies. The authors of [49] analyze various traffic types (i.e. metrics) of sampled flows in an extensive academic network. Each traffic metric brings into focus a different set of anomalies and more specifically, this work reveal that the analysis of
numbers of flows is suitable to identifyDoS,scan, andFlash Crowd.
Sig-nal processing techniques assume that generally, traffic may be modeled as a linear state space model having Gaussian behavior. Authors in [79]
3.7 Flow-based anomaly detection 35
combine Kalman filtering and statistical methods for detecting volume anomalies in large-scale backbone networks. Based on the hypothesis that along their routes anomalies traverse numerous links, this approach monitors multiple links simultaneously. This technique performs anomaly detection on origin–destination (OD) flows to identify the source of the anomaly. Dewaele et al [27] extract sub-traces from randomly chosen traffic traces, model them using Gamma laws and identify the anomalous traces by tuning the deviations in the parameters of the models. Flow-based methods allow faster analysis through a reduction in data size, on the other hand, surveys have already shown how the complete absence of payload could also be the main weakness [80]. The use of these techniques makes it tough to detect attacks for which the variations are only in the payload. Nevertheless, Flow-based Intrusion Detection Systems could be used as a complement when technological constraints or privacy policy make payload-based techniques infeasible. The use of entropy estima-tion for anomaly detecestima-tion relies on the principle that certain types of network anomalies will (meaningfully) disturb the distribution of traffic features (e.g. source/destination ports, source/destination IP addresses) [11], [9]. Authors in [11] show that packet sampling methods employ several trade-offs regarding the detection of anomalies. They analyze in detail the random packet sampling and the impact of its quantification on anomaly detection. Even if since the early 2000 packet sampling is under discussion for standardization by the IETF PSAMP working group [19], there is no standard to describe how to sample flow data. On the one hand, flow sampling decreases the computational load, on the contrary, it makes more difficult the detection process. Studies that describe the impact of flow sampling to the anomaly detection are presented by [4], [6]. Androul-idakis et al. [4] utilized an entropy-based anomaly detection method based
on an intelligent flow sampling to improve the effectiveness of anomaly de-tection and validate it. Bartos et al. [6] proposed an adaptive flow sampling technique. An ideal sampling model used to evaluate the sampling method is provided. This approach preserves the statistics of the traffic features used for anomaly detection. In order to evaluate real anomalies in real traffic, researchers can use typically two approaches, manually checking the alert or comparing their alert events with other anomaly detectors. In the first approach, the event labeling relies on human-based knowledge, thus detected events are verified manually by the domain experts. Fol-lowing this approach, authors in [9] present a histogram-based anomaly detector that identifies anomalous flows by detected the changes in traffic by applying the Kullback-Leibler divergence to several histograms that monitor distinct traffic features. Furthermore, the association rule mining allows for the extraction of the set of traffic features that describes the anomalies detected by the histograms. On the contrary, in this dissertation, we evaluate the accuracy of our anomaly detector by comparing all alert events with the results of MAWILab archive.
Authors of [38] proposed a method for anomaly detection using four flow metrics: volume of bytes; the number of packets; the number of flows to the same destination IP and port, and the number of destination ports. The validation process was performed analyzing simulated anomalies (e.g., UDP flood, ICMP flood, TCP SYN, or Port scan).
A traffic analysis focused on scan in TCP protocol was presented in [60]. The author used Nmap to perform network or port scan. The authors, in an afterward work, presented a solution to detect network anomalies (i.e. scan and flood) in a high-speed network with an accurate identification of the anomalies [61]. The key features that identify alert
3.8 Final remarks 37
consist of attack time, attacker IP and victim IP, the attack category (scan, flood, DoS, and DDoS) and the attack type (scan type, and flood type).
A two steps method to identify and classify the flows involved for the anomalies is proposed by [31]. This technique firstly determines the time slice where the anomaly occurs then find the IP flows responsible for the detected anomalous behavior.
On the contrary, instead of identifying the flows responsible of an anomaly, [24] provided for each anomaly detected, a table of all flows belonging a time slice with the highest flow frequency.
3.8
Final remarks
This chapter has provided background information on Intrusion Detection Systems and its taxonomy. Then, the Anomaly Detection Systems tech-niques present in the literature. Moreover, a brief overview of datasets to evaluate and validate the anomaly detection methods was provided.
Chapter
4
Big Data Analytics and Network
Monitoring
4.1
Introduction
What is Big Data? According to Manyika et al. [53]definition “Big data is datasets whose size is beyond the ability of typical database software tools to capture, store, manage, and analyze”. This definition contains a time-variant aspect. Datasets that today can be considered as Big Data tomorrow could become “normal” data. Since this definition does not use any metric to define big data, we prefer to use Laney et al. [50] definition that defines the data growth challenge as three-dimensional, i.e., concerning an increase in Volume, Velocity, and Variety. Big Data is a relatively novel topic that has received much attention from the community in the last decade. Many research groups (such as biologists, astronomers, and computer scientists) have focused their efforts on several aspects of interest related to this
important research topic, such as methods and technologies to handle big data issues including for i.e. acquisition, storage, analytic and data mining models [3]. Among the sciences, discoveries in astrophysics have always been driven by the analysis of massive data sets. Thus, a new discipline, the Astroinformatics, has born. In this interdisciplinary field of astrophysics and computer science, scientists exploit new methods and analytics tools to solve the big data challenges faced in astronomy [30].
The number of devices connected to the network and the spread of high-speed network are leading the growth in network traffic concerning data Volume and complexity (i.e. Variety), and traffic Velocity. Network monitoring could be considered a Big Data problem as it has all the 3Vs characteristics (i.e. Volume, Velocity, and Variety). Beyond all definition of Big Data, in the context of computer networks, a Big Data problem in-volves a enormous amount of data (to capture, store and analyze) traversing the network infrastructure, so large that it exceed the analytic capabilities of traditional computing methods and architectures. This chapter aims at providing an overview of the new and much less investigated topic related to big data and networking. In particular, we aim at analyzing the existing literature dealing with how computer networks produce big data as well as dealing with how computer networks handle big data. For example, in the first case, network management and intrusion detection systems running distributedly across vast and high-speed networks produce a large amount of data (pertaining the status of hosts, nodes, and the network links) having the 3V properties of big data cited above. On the other hand, the several existing applications dealing with big data have more and more stringent requirements for the network and impose a huge load (in a very broad sense) on such networks.
4.2 Network Solutions for Big Data 41
4.2
Network Solutions for Big Data
Many architectural solutions for the various aspect of the Big Data prob-lems are present in literature. Authors of [82] focused their work on the exponential growing of dataset sizes and the resulting data transfer problem. They proposed an efficient solution based on the Remote direct memory access over Converged Ethernet (RoCE) [5]. Most of the data transfer tools are based on TCP, with a limit of tens of Gbps on current hardware. The work presents a brief overview of the main open issue and a performance comparison between the RoCE and conventional transfer protocols (TCP, UDP), over high-speed network links. This work demon-strates that the transfers based on RoCE achieve comparable performance as TCP or UDP while maintaining a low percentage of the involved CPU resources up to two order of magnitude less than other protocols. MapRe-duce applications consume most than 50 percent of the bandwidth for the Shuffle, and Date-Spreading phases. To avoid potential over-subscription problems due to the uses of static routing, [86] presented a distributed adaptive routing algorithm. The authors presented an approximate Markov chain model to evaluate the convergence time of the aforementioned adap-tive algorithm. This model predicts that, under the condition that the flows do not exceed the 50% of the bandwidth capacity for the edge links of the network, the algorithm would converge in a few iterations to a non-blocking routing assignment regardless the size of the network.
Due to the enormous amount of network traffic produced by batch and real-time big data processes, numbers of new architectural solutions in order to optimize the bandwidth utilization [23], [84] or reduce the network traffic [22] are proposed in the literature. One of these is
Cam-doop [22] that focuses on decreasing traffic by pushing the aggregation to the network core. In this way it reduces the amount of traffic, paral-lelizing the typical shuffle and reduces steps of the MapReduce processes. Camdoop is a framework for the execution of MapReduce-like processes that uses a custom transport protocol, providing a reliable communica-tion, a specific programming for the application of the packets and the packet aggregation through the flows. It runs on CamCube [21], a platform that distributes the switch functionality between servers. Leveraging the way by which CamCube forwards the traffic, Camdoop performs data aggregation during the shuffle phase. It can be used as a Hadoop plug-in, or completely replace it since Camdoop supports the same MapReduce functions. Recent researches as [23], [84] have shown how the benefits brought by SDNs to the optimization of network utilization (e.g., using the adaptive routing) can be exploited to improve the performance of dis-tributed applications. In [84], the author proposed a cross-layer approach for SDN controller that, by fitting the application requirements at run-time, enhances the performance of distributed application. This work combines the high-speed optical switches with SDN controllers to dynamically re-configure them. The SDN controller functioning is based on application level information. Thus, it is interfaced to the master node (such as the Hadoop scheduler) to retrieve the job by scheduling the information used to predict the bandwidth consumption of the next application task. Then, the controller configures the underlying network routing and topology accordingly to the recognized traffic pattern, such as bulk transfers, data partitioning and aggregation (i.e. MapReduce), and low-latency control message, in order to improve the application performance at run-time. Nevertheless, flow-level traffic engineering for big data applications has been postponed by the author as future work. Among the previous work,
4.3 Big Data Solutions for network 43
author of [23] proposes a network management framework that improves Big Data process through the optimization of the network utilization. This framework, named FlowComb, includes a centralized decision engine that by monitoring big data applications through software agents deployed on each application server, is able to predict the application transfer phases before they start. Then, the decision engine (as well as an SDN controller) adapts the network by changing the path using the application domain knowledge.
4.3
Big Data Solutions for network
Achieving the ability to analyze, understand and exploit information in a more efficient way is crucial for several computer network applications such as monitoring, planning, forensics, and security.
In [87], the authors propose a Big Data analytics framework for mobile network optimization (MNO). Data is collected from various sources, the users (i.e. location, mobility pattern, communication pattern, and application usage behaviors), the network core (i.e. network performance information, successful calls, application usage), and the physical level (i.e. cell information, radio signal power, and quality). The framework is composed of a BDA platform and a set of network optimization functions. These features can be useful for several tasks in MNO, such as network planning, QoE modeling, and resource allocation.
Authors in [63] propose a big data framework (i.e. Hadoop MapRe-duce) for change detection in temporally-evolving network traffic data. This approach involves two steps. Firstly, the traffic is sampled using a
random method then the selected time period is partitioned in temporal bins. Then, the change detection method is applied. A distributed applica-tion that uses MapReduce is implemented to perform both the sampling and the change detection phase. A performance comparison that using real traffic traces [CAIDA] shows how the distributed solution achieves better performance than a non-distributed one. However, this comparison does not take into account the accuracy or the efficiency, but only the execution time. Moreover, only a theoretical model is presented without providing a possible comprehensive implementation of the monitoring architecture. An anomaly detector referring to performance metrics of virtual machines running in a cluster is presented by [78]. They proposed a framework for real-time anomaly detection based on Apache Spark. Finally, a big data architecture for security monitoring is proposed by [54]. Data analyzed come from different sources, such as honeypots data, DNS and HTTP traffic, and IP flow records. The system proposed correlates these sources with data correlation schemes useful for network security. Finally, a per-formance assessment of this schemes is performed using five BDA tools, namely Hadoop, Hive, Pig, Shark, and Spark, against four scenarios (i.e. queries). This performance analysis shows how Spark achieves the best performance in all scenarios. Unfortunately, this work does not present any practical implementation for this system and the performance comparison does not consider the efficiency and the accuracy but only the computing time performance.
Among numerous others, we propose a Big Data architecture to analyze the flow network traffic in an efficient manner.
4.4 Big Data Analytics Tools 45
4.4
Big Data Analytics Tools
BDA frameworks, deployed on Cloud or In-House Data Center, have become critical to facing the computational demand tasks. In the following, we present an overview of the most used BDA tools in literature.
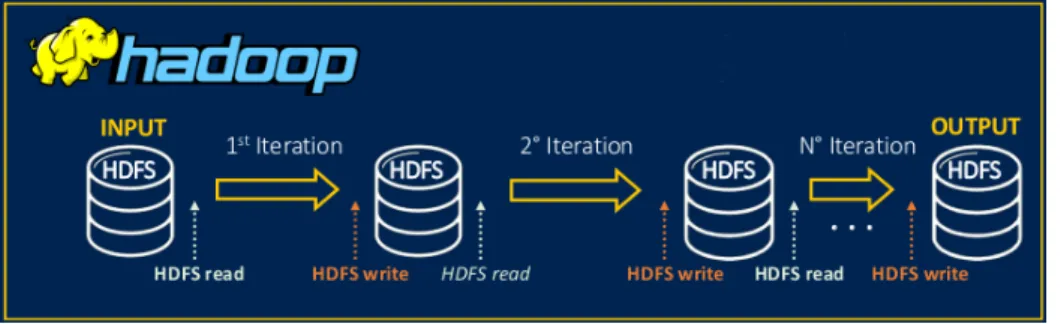
Fig. 4.1 Big Data Analytics framework - Batch Analysis
4.4.1
Apache Hadoop
Apache Hadoop is an open source distributed computing framework for distributed storage and batch processing of large data sets on clusters built from commodity hardware using simple programming models (i.e. MapReduce) [Hadoop]. It is designed to scale up from single to thousands of servers, each of which offers both local computation and storage. It allows processing big data by using batch processing. Rather than rely on hardware to deliver high-availability, the library itself is designed to detect and handle failures at the application layer. Hadoop core components provide services for job scheduling (YARN), a distributed file system (HDFS), and data processing (MapReduce).
HDFS - Hadoop Distributed File System
HDFS [HDFS] is the distributed file system of Hadoop framework. HDFS is designed to store files that have the size of gigabytes to terabytes on clusters of commodity hardware. In an HDFS cluster, there are two types of nodes, namely NameNode and DataNode. The NameNode is responsible for storing and managing the metadata of files and directories in the file system. On the other hand, DataNodes, function as storage for HDFS files. In HDFS, files are split into blocks which are stored independently in a set of DataNodes. In order to provide fault tolerance and high availability, each block is replicated to multiple DataNodes. When a client application writes a file to HDFS, each block is sent to a DataNode, which then replicates it to other DataNodes. On the other hand, when a client needs a file from HDFS, each block of the file is read from the nearest one among the DataNodes hosting the block replicas [Hadoop].
4.4.2
Apache Storm
Storm is a distributed real-time computation system for processing large volumes of high-velocity data. Storm is extremely fast, with the ability to process over a million records per second per node on a cluster of modest size. Enterprises harness this speed and combine it with other data access applications in Hadoop to prevent undesirable events or to optimize positive outcomes.
4.4 Big Data Analytics Tools 47
4.4.3
Apache Kafka
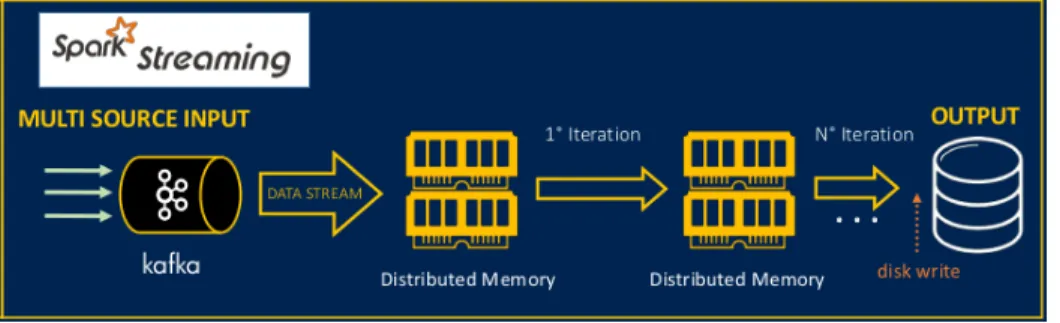
Apache Kafka is a fast, scalable, durable, and fault-tolerant publish-subscribe messaging system. Kafka is often used in place of traditional message brokers like JMS and AMQP because of its higher throughput, reliability and replication [Kafka]. Apache Kafka can work in combina-tion with numerous systems for real-time analysis and the rendering of streaming data, such as Apache Storm, Apache HBase or Apache Spark. Usually, it is employed for two type of application, developing real-time data workflows, exchanging messages between systems or applications in a reliable way, and real-time streaming applications that transform or react to the data stream. Kafka is a message broker horizontally scalable, and fault-tolerant. Regardless of the use case, Kafka brokers massive streams of messages for low-latency analysis in the Apache Hadoop ecosystem.
Fig. 4.2 Big Data Analytics framework - Streaming Analysis
4.4.4
Apache Spark
Apache Spark is a fast, in-memory, general purpose engine for large-scale data distributed computing. It provides development APIs to allow data
Figure

Related documents