Air Force Institute of Technology
AFIT Scholar
Theses and Dissertations Student Graduate Works
3-23-2018
Analysis of a Voting Method for Ranking Network
Centrality Measures on a Node-aligned Multiplex
Network
Kyle S. Wilkinson
Follow this and additional works at:https://scholar.afit.edu/etd Part of theStatistical Models Commons
This Thesis is brought to you for free and open access by the Student Graduate Works at AFIT Scholar. It has been accepted for inclusion in Theses and Dissertations by an authorized administrator of AFIT Scholar. For more information, please [email protected].
Recommended Citation
Wilkinson, Kyle S., "Analysis of a Voting Method for Ranking Network Centrality Measures on a Node-aligned Multiplex Network" (2018).Theses and Dissertations. 1867.
i
ANALYSIS OF A VOTING METHOD FOR RANKING NETWORK CENTRALITY MEASURES ON A NODE-ALIGNED MULTIPLEX NETWORK
THESIS
Kyle S. Wilkinson, Major, USAF
AFIT-ENS-MS-18-M-170
DEPARTMENT OF THE AIR FORCE AIR UNIVERSITY
AIR FORCE INSTITUTE OF TECHNOLOGY
Wright-Patterson Air Force Base, OhioDISTRIBUTION STATEMENT A.
ii
The views expressed in this thesis are those of the author and do not reflect the official policy or position of the United States Air Force, Department of Defense, or the United States Government. This material is declared a work of the U.S. Government and is not subject to copyright protection in the United States.
iii AFIT-ENS-MS-18-M-170
ANALYSIS OF A VOTING METHOD FOR RANKING NETWORK CENTRALITY MEASURES ON A NODE-ALIGNED MULTIPLEX NETWORK
THESIS
Presented to the Faculty
Department of Operational Sciences
Graduate School of Engineering and Management
Air Force Institute of Technology
Air University
Air Education and Training Command
In Partial Fulfillment of the Requirements for the
Degree of Master of Science in Operations Research
Kyle S. Wilkinson, MS
Major, USAF
March 2018
DISTRIBUTION STATEMENT A.
iv AFIT-ENS-MS-18-M-170
ANALYSIS OF A VOTING METHOD FOR RANKING NETWORK CENTRALITY MEASURES ON A NODE-ALIGNED MULTIPLEX NETWORK
Kyle S. Wilkinson, MS
Major, USAF
Committee Membership:
Dr. Richard F. Deckro Chair
Dr. Christine Schubert Kabban Member
Dr. James F. Morris Member
v AFIT-ENS-MS-18-M-170
Abstract
In Joint Concept: Human Aspects of Military Operations (JC-HAMO), the need for identifying critical actors within a target network is clearly identified as a precursor to
successfully influencing decision making and operational outcomes. JC-HAMO seeks
methods to identify critical actors within the context of multiple types of networks and over
a period of time. This problem can be approached structurally using a time-stamped
multilayer network. One method of identifying critical actors in a single
layer—fully-aggregated—network involves ranking actors in order of importance by some set of
network measures. This thesis explores a method for extending such a ranking of critical
actors into a multilayer network context. Specifically, it borrows and applies a
methodology from the field of electoral systems to the problem of ranking actors based on
a set of rankings for each layer.
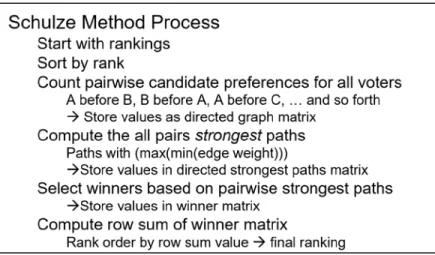
The Schulze method—a deterministic voting methodology based on a modified
shortest path algorithm—is examined and its performance is assessed through statistical
comparison with identified alternative approaches and baseline rankings. Potential
advantages and limitations are identified as well as a method for increasing its robustness
when the networks of interest contain many isolated components. This is done by adopting
a secondary weighting scheme. As a corollary study, an information-theoretic multilayer
network layer-reduction heuristic is explored and the resulting rankings on the reduced
multilayer network are compared with those of the full multilayer network and those of the
vi
distinct multilayer network weighting schemes. Results are based on the study of an open
vii AFIT-ENS-MS-18-M-170
To my wife: This, as with most things, would have been impossible without you To my son: You’ve been more patient and understanding than you should be
viii
Acknowledgments
I would like to express my sincere thanks to my advisor, Dr. Deckro, for his guidance, support, stories, encouragement and considerable time throughout the course of this thesis effort. The overall quality of this work—inasmuch as it is good—is a direct result of your guidance.
Dr. Schubert Kabban, thank you for patiently explaining statistics concepts (seemingly) over and over again. What rigor is present here is owed to you in large part.
Dr. Morris, thank you for your insights and guidance from afar. If this is useful, it’s because you helped make it so.
I am indebted to Dr. Sean Everton and Dr. Dan Cunningham for their generosity in providing the datasets from their books for use in this research.
Whatever errors exist are of my creation alone.
Finally, I must acknowledge and thank my family. To everyone—immediate and extended—who contributed in ways large and small, I recognize the impacts and appreciate the help greatly. We tend to never take the easy path and I couldn’t have done everything else AND this thesis simultaneously without all of your patience, support, enthusiasm, guidance, and love.
ix
Table of Contents
Page Abstract ...v Acknowledgments ... viii Table of Contents ... ixList of Figures ... xii
List of Tables ... xiii
I. Introduction ...14
1.1 Chapter Overview ... 14
1.2 Overview of Thesis Objectives ... 14
1.3 General Issue ... 15 1.3.1 Research Overview.... 19 1.4 Problem Statements ... 20 1.5 Approach ... 20 1.6 Assumptions ... 23 1.7 Implications... 24 1.8 Preview ... 24
II. Literature Review ...26
2.1 Chapter Overview ... 26
2.2 Description ... 26
2.3 Relevant Research ... 27
2.3.1 Overview. ... 27
2.3.2 Social Networks. ... 27
2.3.3 Social Network Components. ... 28
2.3.4 Mathematical Representations of Social Networks. ... 29
2.3.5 Social Network Analysis Centrality Measures. ... 30
2.3.6 Multilayer Networks. ... 31
2.3.7 Reducibility of Multilayer Networks. ... 34
2.3.8 Information Gain on Multilayer Networks. ... 40
2.3.9 Multilayer Social Network Components. ... 42
x
2.3.11 Multilayer Social Network Centrality Measures. ... 45
2.3.12 Rankings. ... 52
2.3.13 Social Choice Theory. ... 53
2.3.14 Schulze Method. ... 61
2.4 Summary ... 64
III. Methodology ...66
3.1 Chapter Overview ... 66
3.2 Research Questions ... 67
3.2.1 Comparative Statistical Questions. ... 67
3.2.2 Correlative Statistical Questions. ... 68
3.2.3 Qualitative Questions.... 69
3.3 Materials and Equipment ... 70
3.4 Data Description ... 70
3.5 Data Processing ... 74
3.6 Node Alignment and Isolates ... 75
3.7 Ranking Methods ... 76 3.8 Weighting Methods ... 77 3.8.1 Vote Weighting.... 78 3.8.2 Layer Weighting.... 82 3.9 Statistical Methods ... 83 3.9.1 Overview. ... 83
3.9.2 Testing for Significant Differences. ... 83
3.9.3 Testing for Correlations. ... 86
3.10 Qualitative Methods ... 89
3.10.1 Comparing Ranked Nodes. ... 89
3.11 Summary ... 91
IV. Analysis and Results ...92
4.1 Chapter Overview ... 92
4.2 Research Questions Answered ... 92
4.2.1 Comparative Statistical Questions. ... 92
4.2.2 Correlative Statistical Questions. ... 97
xi
4.3 Summary ... 121
V. Conclusions and Recommendations ...122
5.1 Chapter Overview ... 122
5.2 Conclusions of Research ... 122
5.3 Significance of Research ... 123
5.4 Recommendations for Action ... 124
5.5 Recommendations for Future Research ... 125
5.6 Summary ... 126
Appendix A ...127
Appendix B ...137
xii
List of Figures
Page
Figure 1: JC-HAMO Central Idea and Four Actions ... 16
Figure 2: Example Multilayer Network with Three Layers ... 32
Figure 3: Multiplex Network Example with Three Layers ... 33
Figure 4: Node-aligned Multiplex Network Example with Three Layers ... 34
Figure 5: Aggregation of Network Layers ... 44
Figure 6: Overview of Schulze Voting Method ... 63
Figure 7: Identification of Important Nodes: Patterns by Ranking Approach ... 119
Figure 8: Identification of Important Nodes: Patterns with Additional Weights... 121
Figure 9: Betweenness Centrality ... 127
Figure 10: Betweenness Centrality, cont. ... 128
Figure 11: Closeness Centrality ... 129
Figure 12: Closeness Centrality, cont. ... 130
Figure 13: Degree Centrality ... 131
Figure 14: Degree Centrality, cont... 132
Figure 15: Eigenvector Centrality ... 133
Figure 16: Eigenvector Centrality, cont. ... 134
Figure 17: PageRank Centrality ... 135
xiii
List of Tables
Page
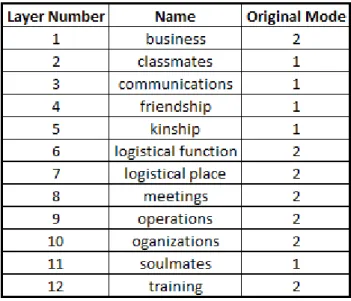
Table 1: List of Network Layers ... 73
Table 2: Table of Weight Distributions ... 81
Table 3: Summary of Weighting Methods Applied ... 88
Table 4: Ranking Comparison Example ... 90
Table 5: Schulze Composite versus Aggregated Rankings WNMT Test Results ... 94
Table 6: Schulze Composite Rankings on Full Multiplex versus Composite Rankings on Reduced Multiplex - WNMT Test Results ... 94
Table 7: Schulze Composite Unweighted Rankings versus Three Weight Distributions – WNMT Test Results ... 96
Table 8: Schulze Overall Composite Unweighted Rankings versus Three Weight Distributions and Aggregated Composite - WNMT Test Results ... 97
Table 9: Overall Summary of Multiple Comparison Test Results ... 97
Table 10: Betweenness Centrality Rankings Correlation Comparisons ... 99
Table 11: Closeness Centrality Rankings Correlation Comparisons ... 100
Table 12: Degree Centrality Rankings Correlation Comparisons ... 101
Table 13: Eigenvector Centrality Rankings Correlation Comparisons... 101
Table 14: PageRank Centrality Rankings Correlation Comparisons ... 102
Table 15: Correlation Chart for Unweighted and Weighted Schulze Composite Rankings ………..103
Table 16: Average Group Auto-Correlations for Five Centrality Measures ... 104
Table 17: Correlations of Overall Schulze Composite Rankings with and without Betweenness Centrality ... 105
Table 18: Comparison of Top 20 Ranked Nodes - Composite versus Aggregated ... 106
Table 19: Comparison of Top 20 Ranked Nodes - Overall Full, Reduced, Aggregated with and without Betweenness... 108
Table 20: Comparison of Top 20 Ranked Nodes - Betweenness Centrality ... 110
Table 21: Comparison of Top 20 Ranked Nodes - Closeness Centrality ... 111
Table 22: Comparison of Top 20 Ranked Nodes - Eigenvector Centrality ... 113
Table 23: Comparison of Top 20 Ranked Nodes - Degree Centrality ... 114
Table 24: Comparison of Top 20 Ranked Nodes - PageRank Centrality ... 115
Table 25: List of Identified Important Actors in Noordin Network ... 118
Table 26: List of Independent Block Designs for Friedman Test ... 137
Table 27: Friedman Test Results ... 138
Table 28: WNMT Multiple Comparison Correction Results ... 139
Table 29: WNMT Multiple Comparison Correction Results, cont. 1... 140
Table 30: WNMT Multiple Comparison Correction Results, cont. 2... 141
14
ANALYSIS OF A VOTING METHOD FOR RANKING NETWORK CENTRALITY MEASURES ON A NODE-ALIGNED MULTIPLEX NETWORK
I. Introduction
1.1 Chapter Overview
This chapter serves as an introduction to the work presented in this thesis. The
general topic is discussed along with the underlying motivation for pursuing this research.
The specific problems are identified and a brief introduction is given to what will be
presented later in the document. This includes the literature review, the methodology of
analysis, the analysis of the results, and a conclusion of the research.
1.2 Overview of Thesis Objectives
This thesis is multifaceted. The primary objective is to demonstrate the utility of a
social choice theory methodology for ranking network measures on a multilayer network.
The secondary objective is to investigate the effects on such rankings of the prior reduction
(partial aggregation of the layers) of the same multilayer network which is reduced using
an information theoretic distance measure and clustering algorithm. The tertiary objective
is to investigate the effects of weighting the data within the methodology.
A cross-disciplinary literature review was conducted which successfully bridged
distinct domains of study in a novel way to produce a new methodology. This methodology
15
a multilayer network. Initial results are promising and suggest ample room for future
research.
Each objective was met using a mixed approach of statistical and qualitative
analyses. Analyses and conclusions were based upon the study of a single multilayer
network dataset, the Noordin Top terrorist network. This dataset is described in detail in
Chapter III.
1.3 General Issue
In Joint Concept for Human Aspects of Military Operations (JC-HAMO), (a publication of future concepts of operations published by the Office of the Joint Chiefs of
Staff), it is rightly recognized “that war is fundamentally and primarily a human endeavor”
and that “the need to understand relevant actors’ motivations and the underpinnings of their
will” continues to be a key challenge within military operations (Office of the Joint Chiefs
of Staff, 2016). To this end, it lists as its central idea four action items for the Joint Force
16
Figure 1: JC-HAMO Central Idea and Four Actions (Office of the Joint Chiefs of Staff, 2016)
In order to accomplish all four action items, relevant actors must be identified by
considering networks similar to those listed in Figure 1, bullet 1 (Office of the Joint Chiefs
of Staff, 2016). A relevant actor is defined as “individuals, groups, and populations whose
behavior has the potential to substantially help or hinder the success of a particular
campaign, operation, or tactical action” (Office of the Joint Chiefs of Staff, 2016).
Additionally, a relevant actor’s “religion, ethnicity, gender, language, tribe, social
class, caste, occupation, or geographic area of birth” will contribute to his or her
perceptions of interest (Office of the Joint Chiefs of Staff, 2016, p. 18). These aspects can
be modeled as network layers. These network layers may be related; some of the layers
may be more or less important than others in determining an actor’s perceptions and
17
In addition to emphasizing the importance of relevant actor identification,
JC-HAMO goes on to identify several required capabilities for the Joint Force. Key among
these in the context of this research is section 7.1, Required Capabilities to Identify the
Range of Relevant Actors and Their Associated Networks. This is mission-specific and can include identification of individuals and any appropriate groupings thereof. The
mission-specificity requirement drives the need for continual re-evaluation of key actors based on
changing mission objectives (Office of the Joint Chiefs of Staff, 2016, p. 26). This
re-evaluation will ideally identify “constraints and enablers of behavior” from the past, in the
present, and for the future (Office of the Joint Chiefs of Staff, 2016, p. 19).
JC-HAMO Section 7.1.1, the ability to understand the evolving operational
environment through the human aspects lens lists several additional networks of interest, including political, religious, and community affiliations, patronage, financial, commercial
and logistic relationships, education and social status, informational, and psychological
considerations (Office of the Joint Chiefs of Staff, 2016, pp. 26-27). An ensemble of such
networks can be modeled using a multilayer network formulation (Kivela, Arenas,
Barthelemy, Gleeson, Moreno, and Porter, 2014).
These identified capability needs for the Joint Force align well with the objectives
of this research. Identify the Range of Relevant Actors and their Associated Networks is
directly related to the problem of identifying critical nodes, but with an extension into a
multilayer context; the primary objective of this research is to offer a method for
identifying relevant actors in terms of some ranking of nodal network measures—measures
18
Once a measure or set of measures is identified to appropriately measure relevance,
such measures may be incorporated into this methodology. The methodology gives rise to
a list of relevant actors under the chosen measure(s).
Additionally, the temporal perspective is addressed when data includes timestamps,
leading to potential identification of key events’ impacts on the actors’ relevance over time.
This allows one to meet the goal of gaining “an appreciation of how behavior evolves over
time as a result of various stimuli, including friendly force operations and activities in the
environment” (Office of the Joint Chiefs of Staff, 2016, p. 28).
The primary benefit of a multilayer representation is clear: additional information
can be recorded to yield new and unique insights not visible when viewing the problem
through the lens of a single network, or at a single time (Brummitt, Lee, & Goh, 2012;
Kivela, et al., 2014). The cost is, of course, an increased need for data to create the
multilayer network in the first place. This is compounded when considering the need to
collect data at repeated time intervals to build a temporal lens, a desired framework given
in JC-HAMO (Office of the Joint Chiefs of Staff, 2016). Such additional need for
information can be met in the form of intelligence products. This aligns well with the
identified intelligence requirement defined in JC-HAMO and is integral with any potential
solution (Office of the Joint Chiefs of Staff, 2016, pp. 27-29).
In fact, as with any analysis, the outcome is largely dependent on the quality of data
evaluated. Understanding relevant actors, their changes over time, and their relative
importance within various network aspects will depend on reliable information. Thus it is
19
Staff, 2016, p. 43). Nevertheless, with good information, a multilayer network model can
be useful in identifying relevant actors. The methodology proposed in this thesis can be
applied to address the problem of identifying relevant actors.
1.2.2 Research Overview.
In this research, a time-stamped terrorist network dataset is analyzed. This dataset
is the Noordin Top network consisting of 139 network actors, 12 relationships, and 120
monthly timestamped data frames (Cunningham, Everton, & Murphy, 2016; Everton,
2013). The timestamps represent whether or not a network member was present in the
network during a given month in the 120 month period (Everton, 2013).
The data are recorded as square adjacency matrices each having 139 rows and
columns corresponding to the 139 actors. These each carry a timestamp value (numbered
1 to 120) and a relationship—or aspect—type (numbered 1 to 12). The matrices are aligned
to form a two-dimensional 1440 matrix array with each entry representing a network layer
within the multilayer networks. This time-stamped data is investigated for trends in
stability of rankings.
The network is also analyzed in its non-time-stamped state. This is a network which
consists of 12 layers which represent the aggregation of the time data for each layer.
Rankings are computed on this single multiplex using a weight-modified Schulze voting
method (Schulze, 2011). The multiplex is next subjected to a Jensen-Shannon distance
layer-reduction algorithm (De Domenico, Nicosia, Arenas, & Latora, 2015) and rankings
are computed on the reduced network. These rankings are compared to the rankings for the
20
drawn as are qualitative conclusions based on the identities of the nodes ranked in the top
20 positions under each set of conditions.
1.4 Problem Statements
1. Can a select voting method be adopted and demonstrated to effectively produce
rankings of nodes for a multilayer network under select network measures?
2. How are such rankings affected by reduction in the number of layers within the
multilayer network using a select layer reduction algorithm?
3. How do changes in weight distributions alter ranking outcomes?
1.5 Approach
A method for identifying critical nodes in a multilayer network context is needed.
Borgatti (2006) defined the key player problem as being of two types, positive and negative
(Borgatti, 2006). He noted that it is an old problem and had been originally approached by
identifying critical nodes using network centrality measures, but that this approach suffered
from two problems: the goal problem and the ensemble problem. The goal problem states
that the solution should reflect more than just finding an optimal cut set, but rather should
consider the quality of the resulting cut (Borgatti, 2006). The ensemble problem states that
the optimal solution for a set of nodes is not necessarily the same as the set of optimal
solutions for single nodes (Borgatti, 2006).
This thesis does not attempt to fully formulate Borgatti’s (2006) definitions of the
key player problem, positive or negative, within a multilayer network context; rather it
21
ranking measures of centrality. Therefore, a method is explored for ranking such measures
to determine critical nodes within a multilayer network context.
Traditionally, the first step to computing centrality rankings on a multilayer
network is to aggregate the network’s layers into one single layer network and then
compute the measure and its ranking. This aggregation can cause information loss, partially
obviating the benefit of conducting critical node identification on a multilayer data set.
One approach considered in the literature is to reformulate existing single layer
network measures of interest to apply within a multilayer network. Some such attempts are
reviewed, and it is noted that such an approach is both non-trivial, and requires a separate
effort for each measure desired.
In contrast, the proposed approach solves the ranking problem on each layer
individually and combines the several rankings to form one composite ranking, which is
representative of the multilayer structure. The challenge lies in how to make a meaningful
aggregation of rankings which might account for the information contained in the
multilayer structure.
Potential approaches to rank aggregation include employing a numerical average,
convex combination, linear combination, or some other summative procedure to arrive at
a composite ranking given several unique rankings associated with each layer of a
multilayer network. Some such approaches are discussed in the literature review.
This thesis instead borrows from the field of social choice theory to propose the use
22
(Schulze, 2011). Social choice theory methods have previously been applied to other
disciplines; in the case of social network analysis, this has been only in the context of single
layer networks. Social choice theory’s application to multilayer social networks is
seemingly a new contribution by this research.
A challenge arises when working with multilayer networks: the computational
complexity of network analysis scales with the number of layers being analyzed. For large
datasets with a large number of layers, this can pose substantial computational challenges.
This motivates the desire for applying layer reduction—selective aggregation—
mechanisms, but their effects on network measures need to be better understood (De
Domenico, et al., 2015). Thus, a corollary problem in this thesis is the investigation of a
layer reduction technique and its effects on resulting network centrality rankings.
Optimal reduction of layers is a combinatorically difficult problem. To ensure an
optimal solution, each potential way of partitioning network layers may be considered.
Different combinations might result in different overlap of information contained within
the aggregated layers, which might then yield different measurement values. The problem
can be reduced to the general set partitioning problem and the set of possible partitions
scales as the 𝑀𝑀𝑡𝑡ℎ Bell number for 𝑀𝑀 layers. Given this, a heuristic is needed for choosing
which layers to aggregate and which to maintain as a separate layer within the reduced
multilayer network. A prominent heuristic is chosen from the literature and investigated
for its effects on rankings.
This work also seeks to make statistical assessments on the resulting measurement
23
addressed. The rankings are directly compared using the Friedman’s test. In this way, the
statistical (dis)similarity of ranking outcomes under different subsets of the full multilayer
network’s information content can be determined. The Spearman’s correlation coefficient
is used to identify correlations between rankings. Correlation values are observed over time
to identify blocks of time where the rankings remain well-correlated, implying stability.
Additional qualitative questions are investigated to establish the utility or benefit
of the proposed methodology. The approaches taken to answer the full set of research
questions are described in Chapter III.
1.6 Assumptions
Several assumptions were made in the course of this research. A notable assumption
is that built-in implementations of algorithms within MATLAB are accurate and precise.
It was also generally assumed that claims in peer-reviewed research are accurate excepting
minor editing errors. If findings were presented in a paper, those findings were accepted
unless testing was specifically conducted during this research which demonstrated
otherwise.
The data used are assumed to be accurate; analysis is predicated on the data serving
as a ground truth reference. Data of the sort is often collected in a snowballing manner in
which a target of interest (or one on whom it is easiest to find information) is observed or
investigated further. This creates a snowball effect around the target, so that most data will,
by definition, relate to the original target. Snowballing can introduce some bias and thus
does limit the final conclusions that can be drawn in general. These conclusions must
24 1.7 Implications
The proposed methodology demonstrates use of a new tool for identification of
critical nodes in a multilayer network. Critical can be defined in many ways; the
methodology discussed is not dependent on any particular definition. This is true so long
as the measure of criticality can be computed for each node. It also requires that a numeric
ranking of the measure imply an ordinal valuation of the nodes.
If it can be shown that the proposed method is applicable, even with limitations, to
the identification of critical nodes on a multilayer network, then a new aperture will be
opened between two research domains: the literature of ranking nodes on multilayer
networks and the literature of social choice theory and the various voting methods therein.
1.8 Preview
Chapter I described the desire to balance computation costs with information
derived from additional layers within a network. It described a need for additional research
into identifying critical nodes in a multilayer context. Chapter II will present a review of
the relevant literature focusing on social network analysis, multilayer networks, multilayer
network reduction methods, multilayer network centrality measures, and social choice
theory.
Chapter 3 will list the methodology in detail to include a description of the data and
their processing, layer reduction, centrality rankings, statistical comparisons, and
25
V presents a final summary of the work along with directions for future research and
26
II. Literature Review
2.1 Chapter Overview
This chapter describes the relevant literature reviewed in the course of conducting
the studies in this thesis. In this literature review, a very brief review of social network
analysis literature is conducted. Next it discusses multilayer social networks and their
measurement. A short review of multilayer network reduction techniques that allow for
adequate rank comparisons is then produced. Finally, the field of social choice theory and
voting theory is explored.
2.2 Description
Judicious application of resources toward operational ends involves identifying
targets of highest impact by whatever measures are deemed important. It is natural to first
measure a set of possible targets to give each target a values. The possible targets can then
be ranked based on their relative values. These rankings then correspond to a list of targets,
which are prioritized by the chosen measure. Incorporating multiple network layers and
multiple measures of value produces multiple rankings. Aggregation of rankings to
produce a final, composited ranking is of interest.
Information gathering and targeting practices involve the judicious use of limited
resources. Any ability to gain additional benefits from equivalent resources or identical
benefits from fewer resources is of interest to the Department of Defense. For a social
network, additional data in the form of a new set of relational ties can be represented as
27
different information to the analysis of a social network. However, gathering the
information needed to build these layers can be expensive in terms of resource allocation.
Any ability to reduce the required number of layers—and thus amount of data—while
maintaining statistically equivalent analytic conclusions is of great interest.
2.3 Relevant Research
2.3.1 Overview.
This literature review begins by focusing on basic concepts in social network
analysis (SNA). This review then examines extensions of social networks and SNA into
multilayer network formulations. Multilayer networks are networks with more than one
layer where each layer represents a distinct relationship between nodes (Kivela, et al.,
2014). Multilayer networks may be able to represent real world systems with greater
fidelity since real-world social networks are seldom well-described by a single relation
(Boccaletti, et al., 2014). The potential benefits of these multilayer formulations are
explored through a brief exposition of information theoretic applications and findings.
Some attempts at developing multilayer centrality measures are then explored. Finally, a
brief review of the field of social choice theory with a focus on voting theory is conducted.
2.3.2 Social Networks.
SNA is the analysis of networks of social relationships between individuals or
groups (Wasserman & Faust, 1994) through the use of network and graph theories (Otte &
28
social relations, their structure, and their influence on behavior, attitudes, beliefs, and
knowledge (Prell, 2012).
SNA is based in part on an assumption of the importance of relationships among
interacting individuals. The unit of analysis is not the individual itself, but rather a system
consisting of both a collection of individuals and of the links among them (Wasserman &
Faust, 1994). SNA therefore implicitly assumes that information is gained by examining
the structure of the network that cannot otherwise be identified considering only the
components of the network.
There is a growing awareness of the importance of links or interdependencies in
explaining the complexity inherent to social systems (Prell, 2012). These connections may
be strong, weak, or absent and their strength can represent time, intensity, intimacy, and
reciprocity (Granovetter, 1973). This makes for a rich field of research; a basic review of
this research follows.
2.3.3 Social Network Components.
Wasserman and Faust (1994) described certain fundamental components used in
modeling a social network. These include actors, relational ties, dyads, triads, subgroups,
groups, and relations. According to Wasserman and Faust, actors are represented as nodes
on the network and relational ties are the arcs between nodes (Wasserman & Faust, 1994).
Dyads and triads refer to sets of 2 and 3 nodes and their inclusive arcs, respectively. Both
dyads and triads are also subgroups, which can additionally include any number of nodes
and their interconnecting arcs. A group is a finite set of actor nodes between which is a set
29
measurements taken between nodes and are represented with relational ties or arcs
(Wasserman & Faust, 1994). These components can be represented mathematically and the
history of SNA includes a history of its corresponding mathematical models.
2.3.4 Mathematical Representations of Social Networks.
SNA has its roots in a methodology known as sociometry, or the measurement of
interpersonal relations in small groups, developed by Moreno (Moreno, 1953) and Moreno
and Jennings (Moreno & Jennings, 1938). Moreno represented social networks using a tool
called a sociogram, which resembles a digraph but with additional qualitative information
represented by size of nodes, colors, and so forth. The sociogram has been extended and
formalized through the application of the field of mathematics known as graph theory
(Wasserman & Faust, 1994).
Modern social network analysts most commonly represent networks as graphs
(Wasserman & Faust, 1994). Graphs consist of both vertices and edges that can represent
entities and their pairwise relationships or links, respectively (Harary, 1969). The
introduction of graph theory formalisms to SNA allowed for the development of a robust
quantitative framework within the field (Wasserman & Faust, 1994). This was motivated
by studies into structural balance and reciprocity in networks, specifically triad systems,
pioneered by Cartwright and Harary (1956) and Davis (1967) (Cartwright & Harary, 1956;
30
2.3.5 Social Network Analysis Centrality Measures.
Many measures have been developed for the analysis of social networks, which
include node centrality measures, clustering/community and modularity measures, shortest
paths and distance measures, and adjacency matrix decompositions, among others
(Boccaletti, Bianconi, Criado, del Genio, Gomez-Gardenes, Romance, Sendina-Nadal,
Wang, and Zanin, 2014).
Centrality measures are of specific interest here. Centrality concerns finding nodes
that have a central structural role within a network and is of broad interest in SNA
(Boccaletti, et al., 2014). A brief survey of network centrality measures identifies node
degree, closeness, betweenness, eigenvector centralities, and PageRank centrality
(Boccaletti, et al., 2014), as well as stress, load and communicability centrality (Guzman,
Deckro, Robbins, Morris, & Ballester, 2014). Each of these includes variations, which
makes for a long list of social network centrality measures (Wasserman & Faust, 1994;
Boccaletti, et al., 2014; Guzman, et al., 2014).
Betweenness, closeness, eigenvector, degree and PageRank centralities were
chosen for study in this thesis due to their low inter-correlation values and history of study
and application (Guzman, et al., 2014; Boccaletti, et al., 2014). As a testament to the
prevalence of these measures, MATLAB also includes built in functions for each. It is these
functions that are used to compute the centrality values throughout this research.
The previous sections focused on traditional SNA involving single layer networks.
Real social networks often include more than just one relation between individuals, but
31
social relations represent distinct layers and their combination results in what is called a
multilayer network (Kivela, et al., 2014).
It is increasingly apparent that multilayer network models are important across
many scientific disciplines (Kivela, et al., 2014). The body of knowledge concerned with
multilayer networks is commonly known as complex network theory and falls within the
field of complexity science (Boccaletti, et al., 2014). An effective construct for
representing complex networks may constitute the “new frontier in many areas of science”
(Boccaletti, et al., 2014). The following sections describe the formulation and analysis of
multilayer networks in greater detail and compare and contrast these with their traditional
single layer network counterparts.
2.3.6 Multilayer Networks.
Within a social network, many relations may exist between the same set of nodes
representing a wide variety of interpersonal or intergroup relations (Kivela, et al., 2014).
These might include friend relations, family relations, professional or workplace relations,
acquaintance relations, and time-varying relations (Kivela, et al., 2014). Each relation can
be modeled as a separate set of edges, resident on a separate layer of the network. Layers
may alternatively be categorized as similarities, social relations, interactions, and flows
(Borgatti, Mehra, Brass, & Labianca, 2009). Further, these relations may represent
differing strengths of connections; thus, failure to account for layers individually implicitly
assumes interpersonal ties are identical (Hamill, Deckro, Chrissis, & Mills, 2008).
A network that includes more than one layer is most often referred to as a multilayer
32
interdependent network, and many other names (Boccaletti, et al., 2014). Subtle
differences in meaning across authors and disciplines can be a significant cause of
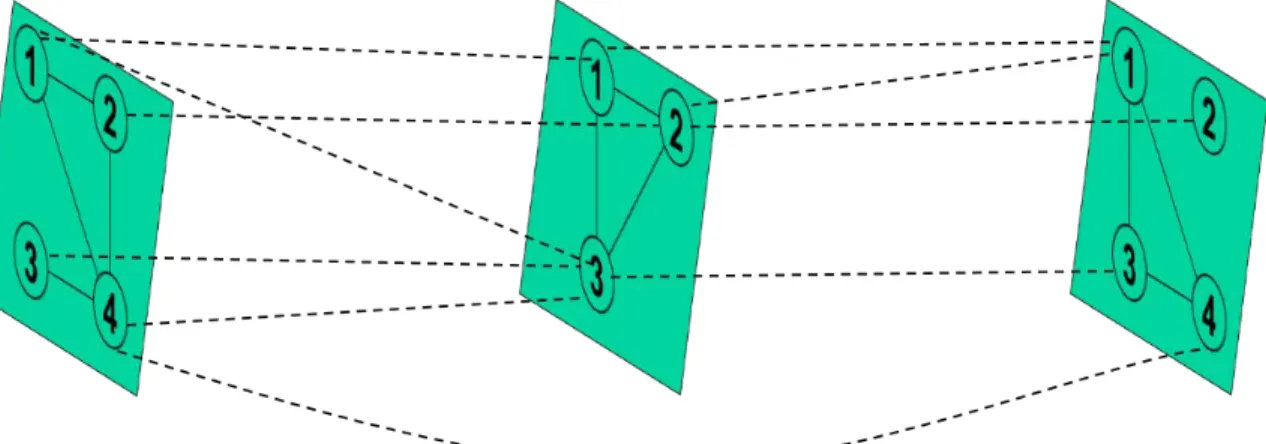
confusion (Kivela, et al., 2014). An example of a multilayer network with three layers is
shown in Figure 2. Intra-layer edges are represented by solid lines and inter-layer edges by
dashed lines. In a general multilayer network, inter-layer edges may connect nodes to
different nodes directly, as represented by the diagonal dashed lines in Figure 2.
Figure 2: Example Multilayer Network with Three Layers
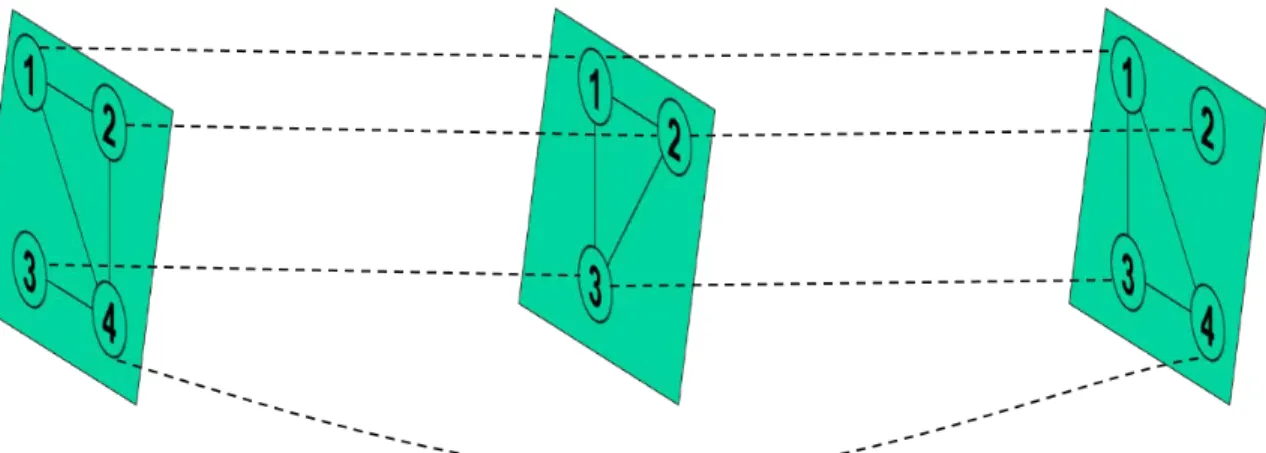
This study adopts the definition of a multiplex network as a special case of
multilayer networks where a node does not connect to another node across layers, but only
within layers; this construct is especially useful within the field of SNA (Boccaletti, et al., 2014). Each node in this case might represent a person and each layer contains that person
and their connections to other nodes corresponding to that layer’s relation only. A three
layer multiplex network is shown in Figure 3. This is the same network shown in Figure 2,
33
Figure 3: Multiplex Network Example with Three Layers
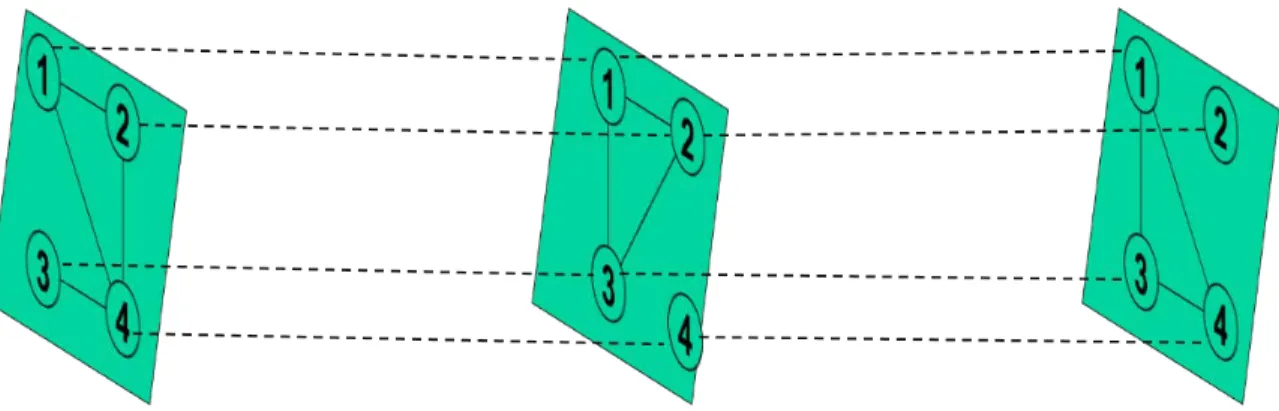
Node alignment is the existence of the same community of actors on all layers
within a multilayer network (Kivela, et al., 2014). Node alignment ensures that intra-layer
adjacency matrices for each layer are of equal size, by maintaining a constant set of nodes
in each network layer. This has the benefit of simplifying mathematical expressions, but
can produce many nodes which are represented as being in a layer, without actually having
any meaningful connections in that layer. Thus, node-alignment can introduce additional
isolated nodes, or nodes which are not connected to any other nodes. Figure 4 illustrates
this by including node four on layer two where it was not previously located. Inter-layer
edges are drawn to the new node four, but within layer two no additional intra-layer edges
34
Figure 4: Node-aligned Multiplex Network Example with Three Layers
Despite this potential difficulty of isolated nodes, there is a benefit to the use of a
node-aligned multiplex network formulation. Inter-layer edges may be understood to exist
uniformly; therefore there is no need to store their edge values (Boccaletti, et al., 2014). In
the cases where inter-layer edges cannot implicitly be assumed to be uniform, but
node-alignment occurs, an additional inter-layer adjacency matrix must be created. In the case
of node-alignment this matrix—sometimes referred to as a super-adjacency matrix—is in
ℝ𝑛𝑛𝑛𝑛×𝑛𝑛𝑛𝑛 where 𝑛𝑛 is the number of nodes and 𝑚𝑚 is the number of layers (Boccaletti, et al.,
2014).
2.3.7 Reducibility of Multilayer Networks.
Multilayer network reduction is a concept which has received increasing attention
over the past few years beginning with a paper titled Structural Reducibility of Multilayer
Networks (De Domenico, et al., 2015). The stated motivation for reducing the structure of a multilayer network is to reduce the computational complexity when performing network
operations and analysis. In this sense, structural reducibility is a proposed method for
35
In the case of the Noordin Top dataset considered in this thesis, the computational
savings resulting from the reduction of the number of layers is negligible, as the total
dataset is relatively small. However, the case is easily made that larger datasets—such as
large social media or communications datasets—may see a substantial reduction in
subsequent network processing times if a quantity of layers can be removed from
consideration while maintaining similar analytic results. The impact of the reduction on
further analysis of the network is left as an open area of research by
De Domenico et al. (2015). This thesis examines the question in the context of centrality
rankings under the proposed rank aggregation method.
Other reduction methods have been proposed, both quantitative (Wang & Liu,
2017; Stanley, Shai, Taylor, & Mucha, 2016; Taylor, Shai, Stanley, & Mucha, 2016) and
qualitative (Crawford, Gera, Miller, & Shrestha, 2016). Wang and Liu (2017) apply a
modified version of the method described by De Domenico et al. (2015) to help identify
community structures. They suggest an improvement to the heuristic by using simple rules
to eliminate certain combinations a priori (Wang & Liu, 2017).
Taylor, et al., (2016) first develop a stochastic block modeling approach to
selectively aggregating network layers for the purposes of reducing the network and then
use their method to help identify communities of nodes within the multilayer network
(Taylor, et al., 2016; Stanley, et al., 2016).
Finally, Crawford, et al. (2016) apply a subject matter expert binning process to
36
interest (Crawford, et al., 2016). They then investigate the effects on community structures
after reducing the network according to this process (Crawford, et al., 2016).
The reduction method chosen for study is the method originally discussed by De
Domenico et al. (2015), referred to as the Jensen Shannon distance (JSD) method. The JSD
method consists of applying a distance metric to all pairs of layers of a multilayer network,
choosing the smallest pairwise distance, aggregating the associated pair of adjacency
matrices, recomputing the pairwise distances, and repeating until all layers have been
aggregated into a single layer network. At each iteration, the cardinality of the set of layers
decreases by one and a corresponding quality function is evaluated.
The maximum value of the quality function is identified and the corresponding set
of layers and their aggregation pattern is adopted as the (sub)-optimal reduction of the
multilayer network. The optimal solution can only be guaranteed by a complete
enumeration of the problem space, which is an NP-hard problem equivalent to finding all
possible partitions of a set and scales as the Mth Bell number—or super-exponentially—
with the number of layers, M (De Domenico, et al., 2015).
This heuristic is roughly equivalent to the agglomerative hierarchical clustering
heuristic first given by Ward (Ward, 1963). The distance proposed in De Domenico et al.
(2015) is the JSD. The objective function maximizes the distinguishability between the
fully-aggregated network—considered the baseline value—and the reduced network using
the relative Von Neumann entropy values for each network (De Domenico, et al., 2015).
The Jensen Shannon distance is defined as the square root of the quantum Jensen
37
Kulback-Liebler divergence has been used to evaluate the similarity between networks;
specifically, it was used to compare constructed networks to the exemplar upon which they
are constructed (Nystrom, Robbins, Deckro, & Morris, 2015). This allowed for the
selection of the most similar network to the exemplar despite deliberate changes to network
features, such as overall size (Nystrom, et al., 2015). The Jensen Shannon distance,
however, meets more of the qualifications to be considered a metric under specific
circumstances, though a general proof has not yet been developed (De Domenico, et al.,
2015).
The Kulback-Liebler divergence (𝐷𝐷𝐾𝐾𝐾𝐾) is given in equation 1 (De Domenico, et al.,
2015) as:
𝐷𝐷𝐾𝐾𝐾𝐾(𝜌𝜌||𝜎𝜎) =𝑇𝑇𝑇𝑇[𝜌𝜌�𝑙𝑙𝑙𝑙𝑙𝑙2(𝜌𝜌)− 𝑙𝑙𝑙𝑙𝑙𝑙2(𝜎𝜎)�] 1
where 𝜌𝜌 and 𝜎𝜎 represent the combinatorial Laplacian matrices of the two graphs being
compared (De Domenico, et al., 2015).
The combinatorial Laplacian (ℒ) matrix of a graph is defined by De Domenico et
al. (2015)as a diagonal matrix of the row sums of the original adjacency matrix less the
original adjacency matrix rescaled by one over twice the number of edges. This is given by
equation 2 as:
38
where D is the diagonal matrix of the row sums of the nodes of the original graph, A is the
adjacency matrix of the original graph, and c is defined as 1
2|𝐸𝐸| where |E| is the number of
edges in the original graph.
The Jensen Shannon divergence (𝐷𝐷𝐽𝐽𝐽𝐽) is a variation of the Kulback-Liebler
divergence involving a mixed state of the density matrices (De Domenico, et al., 2015) and
is given by equation 3 as:
𝐷𝐷𝐽𝐽𝐽𝐽(𝜌𝜌||𝜎𝜎) = 12𝐷𝐷𝐾𝐾𝐾𝐾(𝜌𝜌||𝜇𝜇) +12𝐷𝐷𝐾𝐾𝐾𝐾(𝜎𝜎||𝜇𝜇) =ℎ(𝜇𝜇)−2 [1 ℎ(𝜌𝜌) +ℎ(𝜎𝜎)] 3
where µ is the mixture (average) of the two density matrices ρ and σ.
This then yields the Jensen Shannon distance (𝐷𝐷𝐽𝐽𝐽𝐽) which is defined as the square
root of the Jensen Shannon divergence (De Domenico, et al., 2015) and shown in equation
4 as:
𝐷𝐷𝐽𝐽𝐽𝐽 = �𝐷𝐷𝐽𝐽𝐽𝐽 4
The Von Neumann entropy (ℎ𝐴𝐴) of a graph is given by equation 5 (De Domenico,
et al., 2015) as:
ℎ𝐴𝐴 = −𝑇𝑇𝑇𝑇[ℒ𝑙𝑙𝑙𝑙𝑙𝑙2ℒ] 5
where 𝑇𝑇𝑇𝑇 is the trace of a matrix and ℒ is defined in equation 2.
The Von Neumann entropy of a graph can also be formulated as the Shannon
entropy of its power spectrum which is given in the following equivalence shown in
39 ℎ𝐴𝐴 =−𝑇𝑇𝑇𝑇[ℒ𝑙𝑙𝑙𝑙𝑙𝑙2ℒ] =− � 𝜆𝜆𝑖𝑖 𝑁𝑁 𝑖𝑖=1 𝑙𝑙𝑙𝑙𝑙𝑙2(𝜆𝜆𝑖𝑖) 6
where N is the number of nodes in the graph and 𝜆𝜆𝑖𝑖 is the ith eigenvalue of the Laplacian
matrix associated with the graph.
The average Von Neumann entropy (𝐻𝐻�(𝒜𝒜)) across the M layers of the multilayer
network can thus be defined as follows in equation 7 (De Domenico, et al., 2015) as:
𝐻𝐻�(𝒜𝒜) = ∑𝑀𝑀𝛼𝛼=1𝑀𝑀ℎ𝐴𝐴[𝛼𝛼] 7
where 𝒜𝒜 is the set of adjacency matrices representing each layer in the multilayer network,
𝛼𝛼 is the index referring to a given layer within the multilayer network, 𝐴𝐴[𝛼𝛼]is the adjacency
matrix for layer 𝛼𝛼, ℎ𝐴𝐴[𝛼𝛼] is the Von Neumann entropy of layer 𝛼𝛼, and 𝑀𝑀 is the number of
layers within the multilayer network such that 𝑀𝑀= |𝒜𝒜|.
Let ℛ be defined as the set of adjacency matrices for the reduced multilayer network
where |ℛ|≤ 𝑀𝑀. Then the average Von Neumann entropy for the reduced multilayer
network ℛ, (𝐻𝐻�(ℛ)) is given by equation 8 as:
𝐻𝐻�(ℛ) = ∑ ℎ𝑅𝑅[𝛼𝛼]
|ℛ|
𝛼𝛼=1
|ℛ|
8
The quality function (𝑞𝑞(ℛ)) is defined as the unit difference of the ratio of the
average Von Neumann entropies on the reduced set of layers of the multilayer network
against the Von Neumann entropy of the fully aggregated network. The quality function
measures the distinguishability of the baseline fully-aggregated network compared with
40
𝑞𝑞(ℛ) = 1−𝐻𝐻�ℎ(ℛ)
𝐴𝐴
9
where ℎ𝐴𝐴 is the entropy of the fully-aggregated graph corresponding to the linear of
combination of the multilayer network’s adjacency matrices.
The JSD method given by De Domenico et al. (2015)attempts to reduce the number
of layers as much as possible while avoiding both spurious reductions and failure to reduce
mostly redundant layers. A spurious reduction is a combination of layers which are actually
distinct from each other and mostly redundant layers are those which are most highly
similar to each other.
The resulting reduction of layers is a structural reduction and the JSD method
guarantees nothing about how the reduced network’s structure might or might not alter any
analytic results (De Domenico, et al., 2015). This thesis applies statistical analyses to
determine if significant changes occur to rankings of network centrality measurements
taken on a multilayer network reduced with this method versus those taken on the original
multilayer network.
2.3.8 Information Gain on Multilayer Networks.
The analysis of a multilayer network can take on several general forms: a multilayer
network can be analyzed after a single layer is produced by aggregating or projecting the
41
alternatively, a multilayer network can be analyzed as separate layers (Boccaletti, et al.,
2014).
The first approach—aggregating the layers of a multilayer network into a single
layer prior to analysis—requires choosing an appropriate aggregation method. Aggregation
refers to the summation of layer edge values to produce a single set of edge values
(Boccaletti, et al., 2014). This single set of values produces a single network layer and
corresponding adjacency matrix. Aggregation can be computed in several ways: binary,
summative, and weighted. A binary aggregation is also referred to as a projection and
yields a final single layer network with edge values equal to zero or one (Kivela, et al.,
2014). This is computed by first summing edge weights for all layers and then assigning a
value of one if a non-zero edge weight is present; a value of zero is maintained if a
zero-valued edge weight is present.
A summative aggregation is the simple linear combination of edge weights for all
layers. The summative aggregation of layers thus represents a summative accounting of the
occurrence of edges across the layers (Boccaletti, et al., 2014). The resulting edge weights
will take on natural number values (including zero) between zero and the number of layers
in the multilayer network.
Weighted aggregation can be computed by first applying a uniform weight to each
edge within a given layer. By similarly applying such layer weights to every layer in the
network prior to aggregation, a weighted aggregation becomes a weighted linear
42
take on any additive combination of values of weights between zero and the sum of weights
for all possible layers.
These different aggregation approaches will usually result in different values when
the aggregated network is measured. Such values will also usually differ when compared
with measures taken on the original multilayer network; this is similarly true when
analyzing individual layers in isolation and combining results.
Such differences suggest emergent or synergistic effects can be present between
layers. This creates fundamental limitations on the analysis of a network without full
knowledge of its multiplexity and thus motivates the study of multilayer networks per se
(Brummitt, et al., 2012). A multilayer network should ideally be analyzed directly in its
multilayer state (Cozzo, Banos, Meloni, & Moreno, 2013). However, doing so can present
substantial challenges.
2.3.9 Multilayer Social Network Components.
Multilayer network models include a number of identical or similar components as
those of single layer networks (Boccaletti, et al., 2014). Nodes, arcs, groups, subgroups,
actors, relational ties, dyads, triads, and relations are each present in multilayer social
network formulations since a single layer network can be considered a special case of a
multilayer network that has only one layer.
In some cases, the meanings of these single layer components are altered or
extended to account for additional layers (Boccaletti, et al., 2014; Battiston, Nicosia, &
Latora, 2014). These concepts are sometimes further altered by interpretations of possible
43
interlayer connections exist only between identical nodes on each layer, but within
multilayer networks more generally, connections can occur between any nodes both on the
same layer and on different layers (Boccaletti, et al., 2014).
A key addition to this list of common single layer network components when
modeling multilayer networks is the idea of a layer. In its simplest form, a layer includes
everything that a single layer network does, but has the distinction within the multilayer
network framework of being repeatable (Boccaletti, et al., 2014). In other words, while a
single layer network consists of only one layer, by definition a multilayer network includes
one or more layers.
2.3.10 Mathematical Representations of Multilayer Social Networks.
A method for including multiple relations between nodes on the same networks can
involve defining multiple distinct edges between the same pair of nodes, with each edge
representing a different relation shared by the pair. As the number of relations being
represented on a multiplex network increases, the dimensionality of the necessary
mathematical representation increases. An adjacency matrix is often used to represent
whether an edge exists between two nodes within a single layer network.
Adjacency matrix representations are limited to describing only a single value
between any two nodes (De Domenico, Sole-Ribalta, Cozzo, Kivela, Moreno, Porter,
Gomez, and Arenas, 2013). Many researchers have used aggregation to account for all
layers using only one adjacency matrix. This process is a surjective mapping—it causes a
one-way loss of information—as the vector value corresponding to a set of edges that
44
edge weight on the single aggregated layer (Kivela, et al., 2014; Boccaletti, et al., 2014).
As illustrated in Figure 5, it is clear that the aggregation of the three layers will result in
only one possible single layer network (for a given set of edge weights on each layer);
however, any attempt to reverse the process produces several possible layer combinations
which could produce the same single layer network.
Figure 5: Aggregation of Network Layers
When an additional layer is added to a multilayer network, an additional set of
edges is created. Incorporation of additional edge sets to describe additional relations
involves increasing the dimensionality of the corresponding adjacency matrix. A tensor is
the more general form of a scalar, vector, or matrix. A matrix is a second order tensor, and
therefore an increase in dimensionality can be represented more generally with a tensor
whose order is greater than two (De Domenico, et al., 2013).
Tensor index notation has been suggested as a succinct method of representing
higher-dimension social network data (Kivela, et al., 2014; De Domenico, et al., 2013). To
represent a dataset which is both ordinally-coupled along a temporal dimension and
categorically-coupled as distinct layers representing different relationships, a sixth order
45
remain used when possible as perhaps a more intuitive method and will be used in this
thesis (Battiston, et al., 2014).
2.3.11 Multilayer Social Network Centrality Measures.
Many single layer network centrality measures cannot be applied directly within
the context of multilayer networks. For instance, node degree within a multilayer network
must be represented in vector form and thus does not present a clear method to construct
an ordered list of nodes (Boccaletti, et al., 2014). Measures such as closeness and
betweenness are based on the structure of the network and can therefore be more easily
translated into a multilayer setting, though they may still be complicated by any distinction
between intra-layer and inter-layer arcs (Boccaletti, et al., 2014).
There is therefore an interest in developing new but analogous multilayer measures
(Boccaletti, et al., 2014). Some attempts to develop centrality measures specific to
multilayer networks are offered by Sole-Ribalta, De Domenico, Gomez and Arenas (2014),
Halu, Mondragon, Panzarasa, and Bianconi (2013), and Sola, Romance, Criado, Flores,
Garcia del Amo, and Boccaletti (2013) for betweenness, PageRank, and eigenvector
centralities, respectively (Sole-Ribalta, et al., 2014; Halu, et al., 2013; Sola, et al., 2013).
What follows is a description of these methods.
These three papers attempt to extend a different single layer network centrality
measure into a multilayer network context. Each paper describes a qualitative difference
between the single layer measure’s ranking and its multilayer variant’s rankings. Halu, et
al. (2013) and Sole-Ribalta, et al. (2014) stop short of a statistical analysis; however, Sola
46
correlation coefficients between rankings on the eigenvector centralities of the aggregated
network and the proposed multiplex eigenvector centrality rankings (Halu, et al., 2013;
Sole-Ribalta, et al., 2014; Sola, et al., 2013).
Sole-Ribalta, et al. (2014) define their multilayer analogue to betweenness
centrality beginning with the standard definition of betweenness centrality for a node 𝜈𝜈 as
the number of shortest paths for all node pairs which contain
node 𝜈𝜈 (Freeman, 1977). Their primary extension is to include interlayer edge links as part
of the possible paths (Sole-Ribalta, et al., 2014). This accounts for individuals who serve
as bridges or hubs between layers to be ranked more highly in relative betweenness scores
than they might be in the aggregated network (Sole-Ribalta, et al., 2014). They examine
only unweighted graphs, but claim edge weights can be incorporated easily with the use of
Dijkstra’s algorithm as opposed to the breadth-first approach they take in the paper
(Sole-Ribalta, et al., 2014). Thus, a weighting scheme could be created which weights path edges
that exist between networks, though it is left unclear how such weights should be
developed.
Halu, et al. (2013) created a multilayer extension to the PageRank algorithm under
a node-aligned multiplex network structure (Halu, et al., 2013). The central idea of the
Multiplex PageRank is that a node’s PageRank score on one layer should interact with the
same node’s PageRank score on another layer (Halu, et al., 2013). An underlying
assumption is that such interaction effects are positive in nature. In other words, if a node
47
another layer (Halu, et al., 2013). Multiplex PageRank was defined in four versions:
additive, multiplicative, combined and neutral (Halu, et al., 2013).
The additive definition states that a node’s centrality on network A can be
augmented by the centrality it has on network B (Halu, et al., 2013). The multiplicative
definition states that a node’s centrality on network A involves an interaction effect
between the centrality value on network A and that on network B (Halu, et al., 2013). The
combined version of Multiplex PageRank centrality simply combines the additive and
multiplicative versions. Finally, the neutral version is a reduction to the standard PageRank
definition for each layer in isolation. Thus the PageRank for a node on network A has no
effect on the PageRank for a node on network B (Halu, et al., 2013). With the exception of
the neutral variety, the Multiplex PageRank centrality produces a single vector of values
(Halu, et al., 2013).
Sola et al. (2013) define variations on an eigenvector centrality for directed or
undirected, unweighted node-aligned multiplex networks. They identify two scalar
measures—the eigenvector centrality of the projection graph and the uniform
eigenvector-like centrality—and three vector measures—the independent layer eigenvector-like centrality, the local heterogeneous eigenvector-like centrality, and the global heterogeneous eigenvector-like centrality—corresponding to eigenvector centralities for
a node-aligned multiplex network (Sola, et al., 2013).
The two scalar-valued measures correspond to a standard interpretation of the
eigenvector centrality under different aggregation modes. Both of these scalar-valued
measures assign a scalar centrality score to each node. These are produced by summing
48
projection (binary aggregation) and an unweighted aggregation (linear combination) of
network edges (Sola, et al., 2013).
They define a projection network as the binary combination of the transposed
adjacency matrices for the layers within the multiplex network. This then implies that the
eigenvector centrality of the projection graph is the usual single-layer eigenvector centrality as measured on a binary aggregated network. This corresponds to an unweighted
version of the network were it represented in single layer form (Sola, et al., 2013).
In contrast, the uniform eigenvector-like centrality is defined similarly on the linear
combination or summative aggregation of the transposed adjacency matrices of all layers
in the multiplex network. In this case, the aggregation network is not a binary projection,
but rather a network whose edge weights represent the summative accounting of all edges
present on each layer of the multiplex (Sola, et al., 2013).
The three vector-valued measures correspond to an eigenvector centrality score on
the full multiplex network resulting in a vector-valued centrality score for each node.
Defining the eigenvector centrality of a network, denoted by 𝑐𝑐𝑘𝑘, as the principal
eigenvector of the transpose of the adjacency matrix for the network’s kthlayer of 𝑀𝑀 layers,
Sola et al. (2013) first define the independent-layer eigenvector-like centrality as the matrix
which is the augmented vector 𝐶𝐶 = (𝑐𝑐1|𝑐𝑐2| … |𝑐𝑐𝑛𝑛) (Sola, et al., 2013). Thus the vector 𝑐𝑐𝑖𝑖. (Sola et al. (2013) use dot notation: 𝑐𝑐𝑖𝑖. is the row vector corresponding to the ith row of 𝐶𝐶
for all 𝑗𝑗) is the vector-valued independent-layer eigenvector-like centrality for node 𝑖𝑖.
Next, Sola et al. (2013) introduce the concept of a directed, non-negative influence
49
layer. Though they define 𝑊𝑊 to be generally directed, their study focuses on two varieties
of 𝑊𝑊: symmetric and asymmetric. The symmetric variety renders the graph to be
undirected. The asymmetric topology chosen maintains a directed graph whose adjacency
matrix’ lower triangular values are equal to the square of the reflection of the upper
triangular values about the diagonal. In this thesis, a set of vectors of weights has been
applied to each layer rather than the use of such an influence matrix approach. The
influence matrix approach reduces to the vector of weights approach if the matrix 𝑊𝑊 has
identical rows 𝑤𝑤𝑖𝑖. all equal to the chosen vector of weights.
A local heterogeneous eigenvector-like centrality is defined as the principal
eigenvector of the weighted transposed adjacency matrix for each layer where the weights
are the entries 𝑤𝑤𝑖𝑖𝑖𝑖. Thus 𝑐𝑐1∗ is the principal eigenvector for the matrix given by
𝐴𝐴1∗ =∑𝑛𝑛𝑖𝑖=1𝑤𝑤1𝑖𝑖𝐴𝐴𝑖𝑖. The local heterogeneous eigenvector-like centrality for the entire
multiplex is then given as the augmented matrix of these positive, normalized eigenvectors
represented by 𝐶𝐶∗ = (𝑐𝑐1∗|𝑐𝑐2∗| … |𝑐𝑐𝑛𝑛∗) for multiplex layers 1 …𝑀𝑀. As before, the vector
𝑐𝑐𝑖𝑖.∗ (the row vector corresponding to the ith row of 𝐶𝐶∗) is the vector-valued local
heterogeneous eigenvector-like centrality for node 𝑖𝑖.
Finally, the global heterogeneous eigenvector-like centrality is defined as the
Khatri-Rao product of the influence matrix 𝑊𝑊 and the block matrix consisting of each