M. Simpson, P. Lawrinson, J. Copeland & P. Gates
The Australian Alcohol Treatment Outcome Measure (AATOM-C):
Psychometric Properties
THE AUSTRALIAN ALCOHOL
TREATMENT OUTCOME MEASURE
(AATOM-C): PSYCHOMETRIC
PROPERTIES
Melanie Simpson, Peter Lawrinson, Jan Copeland &
Peter Gates
Technical Report Number 288
ISBN: 978 0 7334 2584 4
©N
ATIONALD
RUG ANDA
LCOHOLR
ESEARCHC
ENTRE,
U
NIVERSITY OFN
EWS
OUTHW
ALES,
S
YDNEY,
2007
This work is copyright. You may download, display, print and reproduce this material in unaltered form only (retaining this notice) for your personal, non-commercial use or use within your organisation.
All other rights are reserved. Requests and enquiries concerning reproduction and rights should be addressed to the information manager, National Drug and Alcohol Research Centre, University of New South Wales, Sydney, NSW 2052, Australia.
Table of Contents
LIST OF TABLES... ii APPENDICES... iii ACKNOWLEDGEMENTS... iv EXECUTIVE SUMMARY...V 1. INTRODUCTION...1 1.1 Background ...11.2 Alcohol treatment in Australia: An overview ... 2
1.3 Outcome measurement: An overview ... 2
1.4 Steps towards development of AATOM-C ... 3
1.5 Aims... 4
2. PHASE ONE: LITERATURE REVIEW AND CONTENT DEVELOPMENT... 5
2.1 Review of available instruments ... 5
2.2 Establishment of the expert advisory group... 5
2.2.1 Expert advisory group meeting ...6
2.2.2 Expert advisory group feedback ...6
2.2.3 Structure and content of the AATOM-C ...7
2.2.4 Administering the AATOM-C ... 11
3.0 PHASE TWO: RELIABILITY AND VALIDITY TESTING OF THE AATOM-C .... 12
3.1 Aim ... 12
3.2 Method ... 12
3.2.1 Materials... 12
3.2.2 Recruitment of treatment agencies ... 13
3.2.3 Recruitment of participants... 14
3.2.4 Participants ... 14
3.3 Results: Psychometric properties of the AATOM-C ... 15
3.3.1 Characteristics of the participants... 15
3.3.2 Test-retest and Inter-rater reliability ... 15
3.3.3 Concurrent validity... 17 3.3.4 Internal reliability... 18 3.3.5 AATOM-C structure ... 18 3.3.6 Content validity... 19 3.4 Discussion ...20 4.0 REFERENCES...22
L
IST OFT
ABLESTable 1: Kappa coefficients (k) as a measure of test-retest reliability of
AATOM-C categorical items………... 16
Table 2: Test-retest intra class coefficients (ICC) reliability for AATOM-C health and well-being scale scores and items………… ………... 16
Table 3: Concurrent validity scores of the AATOM-C scales……… 18
Table 4: Internal reliability of AATOM-C scales………... 18
Table 5: Factor loadings of AATOM-C scale scores………. 19
Table 6: Demographic characteristics of AATOM-C psychometric participants……….. 28
A
PPENDICESAppendix 1: Demographic characteristics of AATOM-C psychometric
participants………. 27
Appendix 2: Distribution of AATOM-C scale scores……….. 31
Appendix 3: AATOM-C baseline interview………. ……….... 35
Appendix 4: AATOM-C follow-up interview……….. 49
A
CKNOWLEDGEMENTSThe Australian Alcohol Treatment Outcome Measure (AATOM) is being conducted by the National Drug and Alcohol Research Centre in collaboration with Turning Point Alcohol and Drug Centre Inc. The project is funded by the Alcohol Education and Rehabilitation Foundation Ltd.
The authors would like to thank the AATOM advisory group members for their input and advice regarding the structure and content of the AATOM instruments; the Network of Alcohol and other Drug Agencies (NADA) for their assistance in recruiting treatment agencies into the project; and the clinical staff and workers at participating alcohol treatment agencies for their interest and enthusiasm in becoming involved in the feasibility phase of the AATOM-C project and their valued help in the recruitment of participants.
E
XECUTIVES
UMMARYApproximately 57% of males and 39% of females report weekly consumption of alcohol, with one in three persons (39% of males, 30% of females) consuming alcohol in a
manner that puts themselves at risk of alcohol-related harm on at least one occasion in the past 12 months (AIHW, 2002). With the exception of tobacco-related disorders, alcohol use disorders were the most common of the substance use disorders. The criteria for either alcohol abuse or alcohol dependence are met by 3% and 3.5% of persons, respectively (Teesson et al., 2000). The public health impact of alcohol use is substantial. In Australia, in 1998 it was estimated that approximately 3,200 died as result of the hazardous or harmful effects of alcohol consumption, with over 71,422
hospitalised (Ridolfo and Stevenson, 2001). Recent data highlights a 4% increase in the number of alcohol treatment episodes in the year 2004-05 from that of 2003-04, with alcohol (as the primary drug of concern) alone accounting for 50,324 episodes (AIHW, 2006b). Given the substantial outlay of public and private funds, healthcare providers are coming under increasing pressure to objectively demonstrate the effectiveness of the services they provide.
The Australian Alcohol Treatment Outcome Measure (AATOM-C) was developed for routine clinical use to monitor treatment outcomes for clients receiving treatment for problems arising from their alcohol use. It was designed to be a multi-dimensional, standardised, valid and reliable instrument for use by health professionals within the Australian context. As a clinical tool, the AATOM-C was designed to be brief, easy to administer and flexible enough to be incorporated into existing data collection and reporting practices across a range of treatment settings. Intended for both “one-off” and on-going evaluation of alcohol treatment service clients, the instrument covers a range of treatment outcomes useful for documenting the efficacy, effectiveness and
cost-effectiveness of treatment whilst taking into account differences in client characteristics, treatment settings and services.
The AATOM Psychometrics project was conducted in Sydney by the National Drug and Alcohol Research Centre (NDARC) in collaboration with Turning Point Alcohol and Drug Centre Inc. Victoria.
The aim of this study was to determine reliability and validity of the AATOM-C in the context of Australian alcohol and other drug treatment services.
An expert advisory group was established to decide upon the content and format of the AATOM instruments. The group consisted of recognised experts within the alcohol and drug field including researchers, clinicians and policy makers.
Two versions of the AATOM instrument were developed: one intended for use amongst clinicians for the purpose of routine measurement of treatment outcome, useful for service development and funding requirements (the AATOM-C); and the other for use amongst researchers (the AATOM-R). This report focuses on the development of the AATOM-C.
The AATOM-C instrument is comprised of five sections assessing: client demographic and treatment information; health and well-being; alcohol use; other drug use; and health service utilisation. An electronic version of the AATOM-C was also developed in order to automate data collection, collation and reporting, thereby substantially reducing the burden of administration on clinicians.
To assess the psychometric properties of the AATOM-C instrument, 203 alcohol treatment service clients were recruited from a range of alcohol and other drug (AOD) treatment agencies across Sydney. Trained researchers conducted AATOM-C interviews with all study participants at two time points, approximately seven days apart. At the second time point, participants were also administered, in addition to the AATOM-C, analogous subscales from pre-existing instruments in order to assess concurrent validity. Scales and items within the AATOM-C were also assessed for internal, test-retest and inter-rater reliability. The results of the study demonstrate that the AATOM-C is, overall, a valid and reliable instrument, taking on average 11 minutes to administer.
The AATOM-C has the potential to be a very useful clinical tool for those working within the alcohol treatment field. It can assist with treatment planning and tracking client progress throughout the course of treatment and after treatment completion. It is intended that clients are administered the AATOM-C at the commencement of
treatment in order to establish a “baseline” level of functioning; at regular intervals during the course of treatment; and, if possible, at a time-point following the cessation of treatment. Face-to-face administration of the AATOM-C is advised, although if the client has left treatment prior to the follow-up period a phone interview can be
conducted. Follow-up reviews can be completed as regularly as every three months or as deemed necessary. To assist with the standardisation of data, the interview should at all times be conducted in accordance with the procedures set out in the administration and procedures manual.
1. I
NTRODUCTIONThe Australian Alcohol Treatment Outcome Measure (AATOM) was developed to identify key outcome variables for alcohol treatment, useful for documenting the efficacy, effectiveness and cost-effectiveness of treatment whilst taking into account differences in client characteristics, treatment settings and services.
Two versions of the AATOM instrument were developed: one intended for routine use amongst clinicians for the monitoring of treatment outcomes for individuals and groups of clients, informing planned changes in service provision and demonstrating
accountability for expenditure of funds (the AATOM-C); and the other for use amongst researchers: (the AATOM-R). This report will focus primarily on the development and psychometric testing of the clinical version of the instrument, the AATOM-C.
As a clinical tool, the AATOM-C was designed to be brief, easy to administer and flexible enough to be incorporated into existing data collection and reporting practices across a range of treatment settings. Intended for both “one off” and on-going evaluation of alcohol treatment service clients, the instrument comprises a range of measures, including client health and well-being, current alcohol/other drug use, alcohol dependence and treatment goals
1.1 Background
The rising level of drug and alcohol use within the Australian community is creating significant strain on health care resources and treatment facilities, with current figures showing that alcohol use alone costs the community $7.5 billion during the year 1998-99 (Collins & Lapsley, 2002). With the exception of tobacco-related disorders, alcohol use disorders are the most common of the substance use disorders. Recent findings from the Australian Institute of Health and Welfare (AIHW) show that 84% of the Australian population in 2004 had consumed alcohol in the previous 12 months, with 11% of males and 6% of females reporting drinking alcohol on a daily basis (AIHW, 2006b). In addition, of those who were drinking, one in 10 were engaging in risky drinking
behaviours (AIHW, 2006b). The criteria of alcohol abuse or alcohol dependence are met by 3% and 3.5% of persons respectively (Teesson et al., 2000). The public health impact of alcohol use in Australia is substantial. In 1998 it was estimated that approximately 3,200 people died as a result of the hazardous or harmful effects of alcohol consumption with over 71,000 hospitalised (Ridolfo & Stevenson, 2001). Subsequent data from the National Minimum Data Set (NMDS) has highlighted a 4% increase in the number of closed drug and alcohol treatment episodes in the year 2004-05 from that of 2003-04. Alcohol, as the primary drug of concern, alone accounted for 50,324 of the closed treatment episodes (AIHW, 2006b).
Given the substantial outlay of public and private funds, healthcare providers are coming under increasing pressure to objectively demonstrate the effectiveness of the services they provide. Many studies have shown that the provision of treatment can produce
substantial savings within the community, for example the California Drug and Alcohol Treatment Assessment (CALDATA) study (an ongoing study conducted in California, US) demonstrated significant benefits of treatment, including $1.5 billion dollars in savings for community tax payers (Gerstein et al., 2004), and Holder & Blose (1992) estimated that for every $10,000 spent on brief intervention for alcohol or drug abuse, between $13,500 and $25,000 is saved in medical expenses.
1.2
Alcohol treatment in Australia: An overview
In Australia, alcohol is the most commonly reported principle drug of concern for both males and females seeking treatment in AOD treatment services. Half of people over the age of 30 report alcohol to be of greatest concern (AIHW, 2006b). In the year 2004-2005 the most commonly accessed treatment type for alcohol use was counselling (44%), followed by withdrawal management (21%), assessment only (15%) and rehabilitation (9%) (AIHW, 2006a). Alcohol was also the primary drug of concern for those receiving treatment in residential facilities (42%), followed by non-residential facilities (37%), at home (38%) and outreach settings (30%) (AIHW, 2006a). Sixty per cent of clients seeking treatment for a primary alcohol problem successfully completed treatment. An increasing proportion of clients, however, left treatment in 2004-2005 without notice (17%) (AIHW, 2006a). Currently there are several forms of treatment available for those seeking help for alcohol abuse, i.e. residential rehabilitation and therapeutic communities, counselling and outpatient services. The direct comparison of treatment type
effectiveness in Australia, however, is unavailable as there is currently no standardised instrument that measures alcohol treatment outcomes across multiple treatment settings; the AATOM is intended to address this deficit.
1.3
Outcome measurement: An overview
Outcome monitoring is one of the more predominant paradigms emerging within the broader frame of health service research. In essence an outcome measure is a systematic standardised collection of data on client and treatment provision characteristics and Treatment Outcome Measures across many AOD treatment programs at the local, state or national level (Centre for Substance Abuse Treatment, 1995). The information gained from an outcome measure is designed to reach not only clients and clinicians, but also managers and policy makers within the broader health community (Health and Welfare Canada, 1992). Outcome measures are useful feedback tools for gaining an
understanding of the connection between client outcome and treatment intervention. The large-scale, standardised collection of data (a central feature of an outcome
monitoring system) provides both the means of collecting outcome information useful in the establishment of treatment benchmarks and a mechanism for comparing treatment types across a range of settings. In this context, the purpose of routine outcome measurement is to provide reliable, aggregated and comparable data that can be used to examine and evaluate the quality of health care delivery (Rock et al., 2001).
Increasing costs of drug and alcohol abuse for the community has led funding bodies and healthcare providers to focus more on providing effective treatment and
Evidence highlights the most efficient way to assess such services is via a standardised outcome measurement tool, allowing comparisons across treatment settings, even at a national level (Copeland et al., 2000; Teesson et al., 2000). The successful establishment of the NMDS has highlighted that a national collection of treatment data is possible across multiple sites and settings within Australia (Copeland et al., 2000). However, the NMDS falls short of answering the kind of clinically relevant questions that can be used to shape and maintain a client’s treatment plan. Since the introduction of the NMDS, and the implementation of the Brief Treatment Outcome Measure (BTOM) (Lawrinson et al., 2003) in New South Wales opiate maintenance pharmacotherapy treatment services, it has become clear that there is a need to provide a set of data that will not only have the potential to account for treatment services through client outcome data, but also operate on a clinical level to assist with client assessment and management.
1.4
Steps towards development of AATOM-C
In NSW, along with most other states and territories in Australia, the collection of nationally agreed upon data items on the utilisation of AOD services, including client demographic items – the NMDS, commenced in July 2000 (Copeland & Conroy, 2001). This has paved the way logistically and ideologically for the routine collection of
treatment outcome data that is brief, reliable, appropriate and valid, placed within the context of ongoing improvement of treatment processes. Additionally, the NSW government highlighted the need to standardise treatment outcome measurement across AOD services, particularly in opioid maintenance pharmacotherapy services (New South Wales Government, 1999; New South Wales Government, 2003). This led to the
development of the BTOM, a brief, multi-dimensional tool designed for routine, ongoing assessment of treatment outcomes for AOD clients in NSW (Lawrinson et al., 2005). The BTOM was designed to integrate outcome measurement with routine clinical assessment and client management whilst allowing for meaningful comparisons to be made between and across services. The BTOM is primarily intended for use with injecting drug using clients and lacks specificity for use with clients seeking treatment for problems with their alcohol use.
Prior to the development of the AATOM-C, there was no instrument that could monitor the progress of alcohol treatment clients suitable for the Australian treatment context. The development of an alcohol treatment outcome measure and its successful integration into routine clinical practice will serve the needs of clients, clinicians, policy makers and treatment evaluation researchers.
To assist in the facilitation of routine data collection, an electronic version of the AATOM-C was developed (the E-AATOM). The E-AATOM, designed to automate data collection, collation and reporting and thereby substantially reduce the burden of administration on clinicians. A summary sheet can also be generated (and printed) which contains all scores and scale results collected during the interview. This resource is useful to store on file for client case management and patient record keeping. The E-AATOM also enables de-identified data aggregation across multiple study sites into a single secure database. All data collected using the E-AATOM can be easily transferred into statistical packages for analysis such as Microsoft Excel and the Statistical Package for the Social Sciences (SPSS). Whilst individual patients will differ in the extent to which they
improve or even decline over the course of the treatment, as the data collected from individual clients is aggregated into grouped client data, overall there would be an
expectation of improvement. If there are sufficient numbers of clients (n>100) it should be possible to relate the extent of improvement to client and treatment-related factors. For instance, it may be worth determining whether gender, age, marital status, or the provision of ancillary services such as mental health influence treatment outcome. Determining which specific treatment components work best with different patient groups can provide valuable information that can be used to improve treatment processes.
1.5 Aims
The overall aim of the AATOM project was to develop a reliable and valid alcohol treatment outcome measurement tool to serve the needs of health professionals and their clients, policy makers, funding bodies and the research community. In addition, the development of a standardised alcohol treatment outcome measure will substantially advance the evidence base for alcohol treatment, and provide comparability between different treatment outcome studies.
The AATOM project was divided into three stages of development, which are outlined below:
Phase One: Literature Review and Content Development
• To update the current literature on alcohol treatment outcome evaluation and monitoring instruments.
Phase Two: Reliability and Validity Testing
• To determine whether the AATOM-C is a reliable and valid instrument in the context of Australian alcohol treatment services.
Phase Three: Feasibility Study
• To ascertain the feasibility of implementing and conducting routine treatment outcome monitoring in alcohol-abuse treatment services.
This report will focus on Phases One and Two of the AATOM project, with findings of the AATOM-C reliability and validity testing based on data collected within NSW.
2. P
HASEO
NE:
L
ITERATURER
EVIEW ANDC
ONTENTD
EVELOPMENT2.1
Review of available instruments
There are many measurement instruments currently used in alcohol and drug treatment research. Multi-dimensional instruments, which measure outcomes across a range of domains of client functioning, are most useful for outcome monitoring in that they reflect the complex nature of drug use and its consequences. Such instruments include the Drug Use Screening Inventory (Tarter & Hegedus, 1991), the Treatment Outcome Profile (Holcomb et al., 1997), the Addiction Severity Index (McLellan et al., 1980), the Opiate Treatment Index (Darke et al., 1992) and the Maudsley Addiction Profile (Marsden et al., 1998). However, none of these multi-attribute instruments are specific to alcohol. In relation to alcohol specific, multi-dimensional tools, there are a number of well-designed instruments. These include the Comprehensive Drinker Profile (Miller & Marlatt, 1984) and the parallel Brief Drinker Profile (Miller & Marlatt, 1984), Alcohol Use Inventory (Horn et al., 1974), Form 90 (Miller & Del Boca, 1994), and the Project MATCH assessment battery (Connors et al., 1994) comprising 37 individual scales. Alcohol outcome research has also used a collection of single-dimensional instruments, such as the MAST (Selzer, 1971), Socrates (Miller & Tonigan, 1996), the Psycho-Social Functioning Inventory (Feragne et al., 1983), the Religious Background and Beliefs Scale (Connors et al., 1996), the Timeline Follow-back (Sobell & Sobell, 1992) and Controlled Drinking Self Efficacy Scale (Sitharthan et al., 2003).
There are a number of reasons why the automatic adoption of one of these
multi-dimensional instruments or a single scale (or combinations of single-scale instruments) is not recommended for Australia. Some of the tools are quite dated and they do not reflect current best practice thinking in outcome measurement. Furthermore, the instruments were often developed and tested for an American or British research and practice community and therefore do not use Australian-specific terminology (for example, alcohol brands or packaging) or safe drinking guidelines and, importantly, they cannot be assumed to be valid or reliable for use in Australia, given that the
psychometric properties of any instrument are context specific (Switzer et al., 1999).
2.2
Establishment of the expert advisory group
An expert advisory group was established to decide upon the content and format of the AATOM-C instrument. Recognised experts within the alcohol treatment field including clinicians, policy makers and researchers were invited to join the advisory group. Emphasis was placed on ensuring that the group was comprised of representatives from rural/remote areas, specialist indigenous groups, and youth and women’s facilities. Members of the advisory committee were involved in the following:
• reviewing appropriate scales and associated psychometric properties of each domain; and
• selecting the best scale for each domain.
Following the draft compilation of the baseline AATOM-C, a follow-up instrument was drafted and submitted to the advisory group for comment and revision. It was also decided that an electronic version of the AATOM-C should be developed. An
administration and procedure manual was developed for both the paper and electronic version of the AATOM-C which were designed to assist with the administration of the instruments and to aid in the standardisation of data collection across and within treatment sites and agencies.
2.2.1 Expert advisory group meeting
The aim of the expert advisory group meeting was to draft an instrument (the AATOM-C) suitable for use within the Australian alcohol treatment context.
Attending members of the advisory group were asked to prepare for the meeting by reviewing a list of possible domains and properties of existing scales (both single and multi-attribute) currently used within the alcohol treatment field. It was hoped that by providing members with such material prior to the day, more informed choices regarding scale selection would be made which would subsequently enhance productivity of the meeting. Members were advised, however, that the material provided was not intended to be an exhaustive list of all scales available and were encouraged to bring any other relevant scales with them on the day. Copies of scales were made available for use during the meeting.
2.2.2 Expert advisory group feedback
Following the initial advisory group meeting, members were sent updated versions of the AATOM-C baseline and follow-up instruments for comment and revision as they developed. The majority of those who attended the meeting provided feedback on the AATOM-C and updated versions of the AATOM instruments. Overall comments focused on the order and length of particular questions whilst some expressed agreement with the revised choice of some measures. More specifically, concerns were raised regarding:
1) the clinical utility and relevance of the specific measures (i.e. craving scale, goals of treatment);
2) the suggested rewording of a number of questions to minimise confusion and retain consistency;
3) the addition of extra questions/sections to gain a better understanding of a patient’s experiences (i.e. history of drinking problems, family history of dependence); and
All feedback was taken into consideration and the drafting of the AATOM has been an ongoing process.
2.2.3 Structure and content of the AATOM-C
Key considerations in the design of the AATOM-C were that it: • be brief and easy to administer;
• would measure treatment outcome across a range of client functioning; • be sensitive to measuring change in outcome over time;
• have good reliability, validity and sensitivity;
• would be able to be integrated into existing data collection practices and reporting requirements; and
• be broadly accepted and appropriate for use by treatment providers across the Australian AOD field.
The following section will outline the content of the two AATOM-C instruments (Time 1 and Time 2) used within the psychometric phase of the AATOM project. The ATOM-C Time 2 differs only by the additional analogous subscales it contains in order to assess the concurrent validity of the scales within the AATOM-C. For copies of instruments used within the AATOM project (AATOM-C Baseline and Three Monthly Follow-up) please refer to the Appendix 2 and 3 of this report.
The AATOM-C interview is comprised of five sections which are detailed below: Section A: Demographic Details
Section B: Health and Well-being Section C: Alcohol Use
Section D: Other Drug Use
Section E: Health Service Utilisation
2.2.3.1 The AATOM-C: Section A: Demographic Details
The first section of the AATOM-C contains items from the NSW Minimum Data Set which are designed to collect social, demographic and treatment service information (New South Wales Department of Health, 2006). Data items that are collected about the client include: sex, date of birth, Australian Torres Strait Islander status, country of birth, preferred spoken language, main source of income, usual living arrangements and usual place of accommodation. Treatment service details such as treatment delivery setting, main treatment type, and source of referral to treatment, previous treatment received and date of treatment commencement are also collected.
Section B: Health and Well-being
Research has shown that significant alcohol use is commonly associated with poor health, frequent medical visits (and expenses), subsequent loss of employment and low productivity (Hunkeler et al., 2001) all of which are known to contribute to an
individual’s deteriorating sense of health, social and personal well-being. Upon
presentation to treatment, a client’s psychological state (level of distress, anxiety etc.) is commonly found to be a significant predictor of treatment outcome (Moos et al., 1990; Ward et al., 1998). In addition, clients of alcohol and drug treatment centres are found frequently to report lifetime chronic illnesses, recent infections and episodes of trauma (Hunkeler et al., 2001; Larson et al., 2006). Section B of the AATOM-C is designed to assess the general health and well-being (physical and mental) of the client and his or her level of psychological functioning. The items within Section B will be examined below:
Item 9. The physical health of each participant is examined using a question derived from the SF-36 Health Survey (Brazier et al., 1992). Participants are asked to think about their health over the past 30 days and indicate their response on a five-item scale ranging from excellent to poor. The time-frame of this question was adapted to be within the past 30 days to be consistent throughout the instrument.
Item 10. The general well-being of the participant was measured by asking the participant to rate his or her present quality of life on a 10-point Likert scale ranging from 0 (my life is really awful just now) to 10 (my life is really good just now).
Item 11. The Kessler 10 (K-10) (Kessler et al., 2002) was included within the AATOM-C to assess the client’s level of psychological distress over the 30 days prior to interview. Clients are asked to indicate on the scale from (1) none of the time to (5) all of the time how often they had felt down, nervous, hopeless, restless, worthless and sad.
Section C: Alcohol Use
Alcohol use, in particular establishing the context, frequency and amount of alcohol a client is consuming at regular time points throughout the course of treatment (including pre-and post-treatment) is an important indicator of treatment outcome (Kadden & Litt, 2004; Lawrinson et al., 2005). Levels of dependence, craving and knowledge of alcohol treatment access history are also useful predictors of treatment outcome (Lawrinson et al., 2007; McLellan et al., 1994). A client’s readiness to change and motivation for treatment are also likely to be early tell-tale signs of treatment success (Copeland et al., 2000). Section C of the AATOM-C instrument was designed to assess a client’s alcohol use, dependence, craving, lifetime history of alcohol use and treatment goals and
confidence. Such items will be examined below:
Item 12. Part A attempts to establish the client’s “typical” pattern of alcohol use. Clients are asked how many days in the last 30 they had drank alcohol and the average number of drinks they consumed on a typical day. A standard drinks chart was used to aid in the standardisation of the instrument.
Part B, participants were asked to identify the number of days in the past 30 that they had drunk alcohol at risky levels. Risky drinking was defined as more than seven
standard drinks on one day for males and more than five standard drinks on one day for females (National Health and Medical Research Council, 2001).
Part C recorded whether the participant had consumed alcohol “much more heavily than usual” in the past 30 days. “Heavy” drinking was subject to the interpretation of the participant; however, it reflected an amount that was considered more than average. The number of days of “heavy drinking” was also recorded.
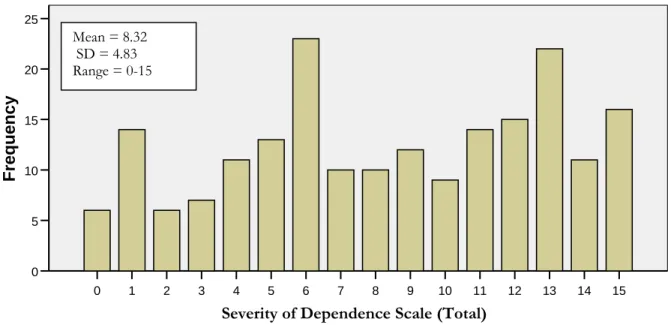
Item 13. The Severity of Dependence Scale (SDS) was used to measure the participant’s psychological dependence to alcohol (Gossop et al., 1995). The scale is comprised of five items which examine how the participant has been thinking and feeling about his or her alcohol use during the three months prior to interview.
Items 14-17. The participant’s lifetime history of alcohol use was assessed by examining the age at which they experienced significant alcohol-related life events. Participants were asked to indicate the age at which they: 1. first had a full serve of alcohol, 2. first drank on a regular basis, 3. realised drinking was a problem, and 4. first sought treatment for alcohol use.
Item 18. Participants were asked to indicate whether they had ever needed to go to hospital for treatment of alcohol-related complications.
Item 19. To assess craving, participants were asked to rate their desire for alcohol on a scale from 0 (no desire) to 10 (uncontrollable desire). The craving scale was used as an additional measure of dependence and desire.
Item 20. Part A. From a list of treatment goals ranging from complete abstinence to no change in their alcohol use, participants were asked to assess what they wanted to achieve as a result of their current treatment episode.
Part B. Using the treatment goal nominated in Part A, participants were then asked to assess their confidence (at the time of the interview) in achieving this goal as a result of their current treatment episode. Responses were recorded on a Likert scale ranging from 0 (not at all confident) to 10 (very confident).
Item 21. Parts C-D. The following questions were derived from the Controlled Drinking Self-Efficacy Scale (CDSES) (Sitharthan & Kavanagh, 1990) and again asked participants to rate their confidence of achieving their treatment goal, now looking three months into the future and when experiencing particular social/emotional situations.
Section D: Other Drug Use
It is important for an outcome measurement tool to be multi-dimensional and capable of capturing the extent of a client’s alcohol and other drug use (Lawrinson et al., 2005; Teesson, et al., 2000). Identifying a client as a poly-drug user is of particular relevance to those involved in treatment planning (e.g. health and safety planning). In particular, research has shown that hazardous drinking is common among injecting drug users (Anderson et al., 2001), highlighting a range of health and safety issues relating to the potential risk and contraction of blood borne viruses (Crofts & Aitken, 1997). Section D of the AATOM-C was designed to identify and capture the client’s illicit drug use in the past three months and more specifically the days of use in the past month across seven major drug categories. This drug use measure was adapted from the BTOM Occasions of Drug Use Index (Lawrinson et al., 2005). The items will be examined below:
Item 22. Participants were asked to list (up to five) drugs that had caused them concern over the past three months. Once again, this question relied on participant opinion and did not necessarily elicit all drugs the participant had used in that time frame.
Items 23-30. In addition, participants were asked specifically about any illicit drug use in the past 30 days across seven drug categories (tobacco, heroin, illicit opioid-based drugs, cannabis, cocaine, amphetamines and tranquilisers). The number of days the drug was used was recorded.
Item 31. If participants had ever injected an illicit drug they were asked indicate when this last occurred. The given response time-frames were: in the last three months, three-12 months ago and more than three-12 months ago. For those who had never injected, this was also recorded.
Section E: Health Service Utilisation
Individuals with alcohol/drug dependence are known to be significant consumers of medical resources, with notable increased risk of medical conditions (i.e. chronic illness, vulnerability to infections) and such individuals often become frequent users of
emergency departments and hospital services (Larson et al., 2006; De Alba et al., 2004; Rees et al., 2002; Hunkeler et al., 2001).
The final section of the AATOM-C was designed to enhance a clinician’s understanding of the client’s general health and well-being by eliciting the number of times health services were accessed in the three months prior to interview.
Item 32. This question was derived from the service section of the Global Appraisal of Individual Needs (GAIN) scale (Dennis et al., 1993) and identifies the number of times each client visited the accident and emergency department, the number of nights they spent in the hospital, number of times they visited a GP and the number of days they took prescribed medication. The type of medication taken was also noted.
2.2.4 Administering the AATOM-C
The AATOM-C instrument was designed to be administered to clients new to treatment and those who had not had treatment for at least one month prior to the current episode. This was to allow for a true baseline assessment. It is suitable for use with clients seeking treatment for problems with their alcohol use and who understand spoken English. As a clinical tool, the AATOM-C was designed to be brief, easy to administer and flexible enough to be incorporated into existing data collection and reporting practices across a range of treatment settings. Typically, the AATOM-C has taken 10-15 minutes to administer. Face-to-face administration of the instrument is recommended; however, when following up clients who have left treatment, a phone interview can be conducted. Intended for both the ”one off” and on-going evaluation of alcohol treatment services, the instrument comprises a range of measures, including client health and well-being, current alcohol/other drug use, alcohol dependence and treatment goals. Such data is useful as an aid in case management. Follow-up reviews can be completed as regularly as every three months and are intended to be conducted in conjunction with general client follow-up procedures.
To increase the accuracy of results and to assist with standardisation, it is necessary that staff receive comprehensive training in the administration of the AATOM-C and conduct the interviews in accordance with the procedures set out in the administration and procedure manual. The more knowledgeable a clinician/worker is about the content and purposes of the instrument, the more successful its implementation as a routine measure will be.
Prior to the interview being administered, the purpose and usefulness of the AATOM-C should be explained to the client and any queries and concerns raised by the client answered. Data confidentiality should also be ensured. It may help to inform the client that the interview is quick and brief and should only take 10-15 minutes, with follow-up occurring at three and 12 months in the future.
3.0 P
HASET
WO:
R
ELIABILITY ANDV
ALIDITYT
ESTING OFTHE
AATOM-C
Good psychometric properties are fundamental for establishing an instruments credibility and usefulness. Reliability and validity are generally the primary properties examined to determine the effectiveness of an instrument and to ensure any differences measured over time reflect real differences and real changes in client characteristics and behaviour.
Reliability is the consistency in results or the repeatability of a measure. If an instrument is designed to be administered on an ongoing basis and/or administered by multiple interviewers, good reliability is especially important. Determining the validity of an instrument ensures that the questions are measuring what they are intended to. Validity is often assessed by comparing components within an instrument to similar constructs within well-known, established measures. Standardising the administration of an instrument increases the reliability and validity of results.
The following section will outline Phase Two of the AATOM-C project, and present results of the AATOM-C psychometric data testing within NSW.
3.1 Aim
To determine whether the AATOM-C is a reliable and valid instrument in the context of Australian AOD treatment services.
3.2 Method
3.2.1 Materials
The AATOM-C (see section 2.2.3.1) and the AATOM-C Time 2 described below:
AATOM-C Time 2: Additional scales assessing concurrent validity
To assess the concurrent validity of the AATOM-C instrument, the AATOM-C Time 2 interview contained additional analogous subscales from validated instruments. Those scales will be discussed below:
Health rating: Short Form Health Survey (SF-12) (Ware et al., 1996).
The SF-12, a much shorter but just as valid derivative of the Short Form Health Survey (SF-36) (Ware et al., 1993) was used to capture the physical and mental well-being of the participant over the 30 days prior to interview.
Personal well-being: Personal Well-being Index (PWI Scale) (Cummins et al., 2004). The Personal Well-being Index created from the Comprehensive Quality of Life Scale (ComQol) (Cummins et al., 1994) queries participants about their satisfaction with life across seven domains. Participants were asked to reflect on their own lives and personal circumstances and give a score ranging from 0 (completely dissatisfied) to 10 (completely satisfied).
Alcohol use: TimeLine Follow Back (TLFB) (Sobell & Sobell, 1992).
This TLFB instrument is commonly used for assessing self-reported alcohol
consumption over a specified time period. In the current study, participants were asked to reconstruct their drinking, day by day, for the 30 days prior to interview. If
participants showed difficulty remembering, interviewers would help the participant with the aid of some basic memory jogging techniques.
Alcohol craving: Alcohol Craving Questionnaire Short Form Revised (ACQ-SF-R) (Singleton et al., 1994).
The ACQ-SF-R is an adapted version of the Alcohol Craving Questionnaire (ACQ-NOW) which consists of 12 items examining four subtypes of craving along a seven-point rating scale. Participants were asked to select a seven-point on the scale ranging between “strongly disagree” to “strongly agree”.
Confidence of achieving treatment goal: Brief Situational Confidence Questionnaire (BSCQ) (Annis & Graham, 1988).
The BSCQ, adapted from the Situational Confidence Questionnaire (Annis & Graham, 1988) was created from the relapse prevention model that states certain situations are more likely to lead to relapse then others (Marlatt & Gordan, 1985). Participants were asked to rank their self confidence of being able to resist the urge to drink in a number of defined situations, including both positive and negative circumstances.
3.2.2 Recruitment of treatment agencies
The Network of Alcohol and Other Drugs (NADA) – the peak body for
non-government AOD treatment services in NSW–online database was used to identify drug treatment agencies offering alcohol treatment services within residential and therapeutic community settings and outpatient settings. A general internet search for AOD agencies within the greater Sydney region was also conducted.
Information packs (which included the offer of a free information session about the AATOM project) were sent either via email or post to co-ordinators of eligible AOD treatment agencies. Twenty agencies responded with interest to the offer and were provided with an information session outlining the aims of the project. A further
information session was conducted with agencies that expressed an interest to participate in the project in order to explain the administration and implementation guidelines for the AATOM-C instrument in both paper and electronic format.
Institutional ethics approval was granted for the study from the University of New South Wales Human Research Ethics Committee and relevant treatment agencies.
3.2.3 Recruitment of participants
Recruitment of participants occurred in two ways: 1) face-to-face recruitment of AOD agency clients, and 2) indirectly via newspaper advertisements, posters and flyers. Eligible participants were aged 18 years or older, fluent in English and able to give informed consent prior to the interview. All participants had a current concern for their alcohol use, regardless of whether they were involved in treatment at the time of
interview.
Researchers trained in the administration of the AATOM-C instrument conducted the interview with each participant on two occasions, typically seven days apart. On completion of the second interview, participants were reimbursed $30 for travel expenses. Participants were advised in advance that the second interview was slightly longer than the first because it contained additional questions. All interviews were conducted at the site of treatment with the exception of those not currently in treatment, in which case the interview occurred at the National Drug and Alcohol Research Centre.
3.2.4 Participants
In total, 224 participants with a concern for their alcohol use completed the first
interview, with 203 participants interviewed on both occasions. Of those interviewed at both time points, 177 participants were currently receiving treatment for alcohol use. Those receiving treatment came from residential rehabilitation programs (54.8%), therapeutic communities (30.5%) and counselling/outpatient services (14.7%). Each participant was interviewed on two occasions (approximately 7-10 days apart) in order to examine the test-retest and inter-rater reliability of the AATOM. One hundred and thirty-nine participants were interviewed by the same interviewer on both occasions and 64 participants were interviewed by a different interviewer on the second occasion.
3.3
Results: Psychometric properties of the AATOM-C
3.3.1 Characteristics of the participants
The mean age of the 203 participants was 37.5 years (SD 10.9, range 18-66 years) and 50.7% were female. The majority of participants were born in Australia (79.8%) with 5.5% indicating they had an Aboriginal or Torres Strait Islander background. Over half of the participants (59.1%) reported Centrelink benefits to be their main source of income, 57.6% were living in rented accommodation and 41.9% were living alone.
Participants who had used alcohol in the previous month, reported drinking on average 19 standard drinks per day on approximately 19 out of the past 30 days. In addition, 36.0% of participants reported using an illicit drug at least once in the past month with 18.0% of all participants reporting injecting an illicit drug in the past three months. Overall, 67.0% of participants had received treatment for alcohol use previously.
The mean retest interval for all participants was 7.7 days (SD 3.1, range 5-14 days); for the same interviewer it was 7.8 days (SD 3.6, range 5-14 days); and for different interviewers it was 7.4 days (SD 1.17, range 6-11 days). The mean interview time was 11.4 minutes (SD 4.6, range 5-35 minutes).
3.3.2 Test-retest and Inter-rater reliability
The test-retest reliability of AATOM-C categorical data was assessed using Cohen’s kappa (k). Inter-rater reliability was also assessed (N=62). Reliability scores were typically lower where participants were interviewed by different interviewers on the first and second occasion compared with scores where the same interviewer interviewed the participant on both occasions. Results of the analysis are presented below in Table 1. All items were statistically significant at the P < 0.001 level (two tailed). Kappa values of less than 0.40 are considered poor agreement; values between 0.40 and 0.60 as fair agreement; values between 0.61 and 0.75 as good agreement; and values above 0.75 as excellent agreement (Landis & Koch, 1977).
Table 1: Kappa coefficients (k) as a measure of test-retest reliability for AATOM-C categorical items
Item All subjects (k) [N = 194] Same interviewer (k) [N = 132] Different interviewer (k) [N = 62] 6. Income 0.681 0.750 0.541 7. Living arrangement 0.731 0.679 0.821 9. Health 0.360 0.388 0.300 18. Hospital admission 0.677 0.662 0.684 20a. Treatment goal 0.658 0.642 0.684 31. When last injected 0.823 0.825 0.819
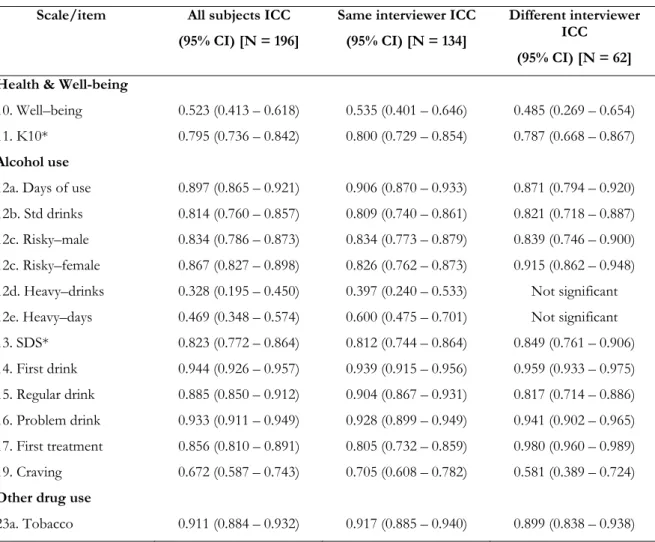
The test-retest and inter-rater reliability of the AATOM-C was assessed by calculating intra-class correlation coefficients (ICC) on the total scores of the AATOM-C scales obtained at the first and second interviews (Table 2). It is generally accepted that an ICC above 0.75 indicates excellent reliability; 0.65 – 0.74 good reliability; 0.40 – 0.64 fair reliability and below 0.40 poor reliability (Cicchetti, 1994).
Table 2: Test–retest intra-class correlation coefficients (ICC) reliability for AATOM-C health and well-being scale scores and items
Scale/item All subjects ICC (95% CI) [N = 196]
Same interviewer ICC (95% CI) [N = 134]
Different interviewer ICC
(95% CI) [N = 62] Health & Well-being
10. Well–being 0.523 (0.413 – 0.618) 0.535 (0.401 – 0.646) 0.485 (0.269 – 0.654) 11. K10* 0.795 (0.736 – 0.842) 0.800 (0.729 – 0.854) 0.787 (0.668 – 0.867) Alcohol use
12a. Days of use 0.897 (0.865 – 0.921) 0.906 (0.870 – 0.933) 0.871 (0.794 – 0.920) 12b. Std drinks 0.814 (0.760 – 0.857) 0.809 (0.740 – 0.861) 0.821 (0.718 – 0.887) 12c. Risky–male 0.834 (0.786 – 0.873) 0.834 (0.773 – 0.879) 0.839 (0.746 – 0.900) 12c. Risky–female 0.867 (0.827 – 0.898) 0.826 (0.762 – 0.873) 0.915 (0.862 – 0.948) 12d. Heavy–drinks 0.328 (0.195 – 0.450) 0.397 (0.240 – 0.533) Not significant 12e. Heavy–days 0.469 (0.348 – 0.574) 0.600 (0.475 – 0.701) Not significant
13. SDS* 0.823 (0.772 – 0.864) 0.812 (0.744 – 0.864) 0.849 (0.761 – 0.906) 14. First drink 0.944 (0.926 – 0.957) 0.939 (0.915 – 0.956) 0.959 (0.933 – 0.975) 15. Regular drink 0.885 (0.850 – 0.912) 0.904 (0.867 – 0.931) 0.817 (0.714 – 0.886) 16. Problem drink 0.933 (0.911 – 0.949) 0.928 (0.899 – 0.949) 0.941 (0.902 – 0.965) 17. First treatment 0.856 (0.810 – 0.891) 0.805 (0.732 – 0.859) 0.980 (0.960 – 0.989) 19. Craving 0.672 (0.587 – 0.743) 0.705 (0.608 – 0.782) 0.581 (0.389 – 0.724) Other drug use
Scale/item All subjects ICC (95% CI) [N = 196]
Same interviewer ICC (95% CI) [N = 134] Different interviewer ICC (95% CI) [N = 62] 23b. No. of cigarettes 0.857 (0.814 – 0.890) 0.846 (0.789 – 0.888) 0.879 (0.807 – 0.925) 24. Heroin 0.827 (0.776 – 0.866) 0.811 (0.743 – 0.862) 0.849 (0.761 – 0.906) 25. Opioids 0.649 (0.589 – 0.724) 0.579 (0.453 – 0.682) 0.972 (0.955 – 0.983) 26. Cocaine 0.862 (0.821 – 0.894) 0.910 (0.876 – 0.936) 0.555 (0.355 – 0.706) 27. Cannabis 0.806 (0.750 – 0.850) 0.777 (0.699 – 0.836) 0.880 (0.809 - 0.926) 28. Amphetamines 0.726 (0.651 – 0.786) 0.762 (0.679 – 0.825) 0.685 (0.527 – 0.798) 29. Tranquilisers 0.817 (0.764 – 0.859) 0.847 (0.791 – 0.889) 0.695 (0.540 – 0.804) Health service utilisation 32. HSU* 0.804 (0.747 – 0.864) 0.813 (0.744 – 0.864) 0.784 (0.666 – 0.864) 32a. A & E 0.323 (0.191 – 0.443) 0.350 (0.192 – 0.491) 0.275 (0.029 – 0.489) # 32b. Hospital 0.475 (0.357 – 0.578) 0.304 (0.138 – 0.453) 0.875 (0.801 – 0.923) 32c. Doctor 0.601 (0.503 – 0.684) 0.451 (0.304 – 0.578) 0.647 (0.476 – 0.771) 32d. Medication 0.779 (0.716 – 0.829) 0.839 (0.779 – 0.883) 0.644 (0.471 – 0.769) * indicates a scale # indicates significance to p < 0.015 3.3.3 Concurrent validity
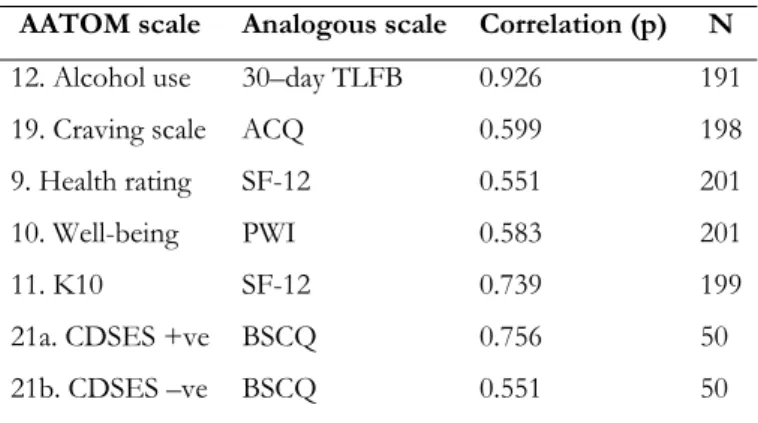
At the second interview, participants were administered analogous subscales from validated instruments in order to assess the concurrent validity of the AATOM-C scales. Pearson’s product moment correlation coefficient was calculated between AATOM-C scale scores and relevant scales from validated instruments as described in Table 3 below. Although not assessed for concurrent validity in this study, recent findings have
demonstrated the Severity of Dependence Scale (SDS) to be a reliable and valid measure of alcohol dependence (Ferri et al., 2000; Gossop et al., 2002; Lawrinson et al., 2007). All scores were statistically significant, p < 0.001, with result correlation coefficients ranging from 0.55-0.93 (Table 3).
Table 3: Concurrent validity scores of the AATOM-C scales
AATOM scale Analogous scale Correlation (p) N 12. Alcohol use 30–day TLFB 0.926 191 19. Craving scale ACQ 0.599 198 9. Health rating SF-12 0.551 201 10. Well-being PWI 0.583 201 11. K10 SF-12 0.739 199 21a. CDSES +ve BSCQ 0.756 50 21b. CDSES –ve BSCQ 0.551 50
3.3.4 Internal reliability
Cronbach’s coefficient alpha (Cronbach, 1951 cited in Switzer et al., 1999) was calculated on individual scales to determine the internal reliability of the AATOM-C (Table 4). A coefficient alpha of between 0.5 and 0.8 is considered an acceptable level of internal reliability for scales where group comparisons are to be made (Ware, 1984 cited in Switzer et al., 1999). The health service utilisation scale (HSU) was constructed from number of times the client has visited the accident and emergency department in the past three months (Item 30a), the number of nights the client spent in hospital in the past three months (30b) and the number of times the client visited a GP in the past 3 months (30c). All scales produced an acceptable level of internal reliability (Table 4).
Table 4: Internal reliability of AATOM-C scales Scale Co-efficient Alpha No. of baseline interviews
SDS 0.903 190 K10 0.886 192 HSU 0.730 189
3.3.5 AATOM-C structure
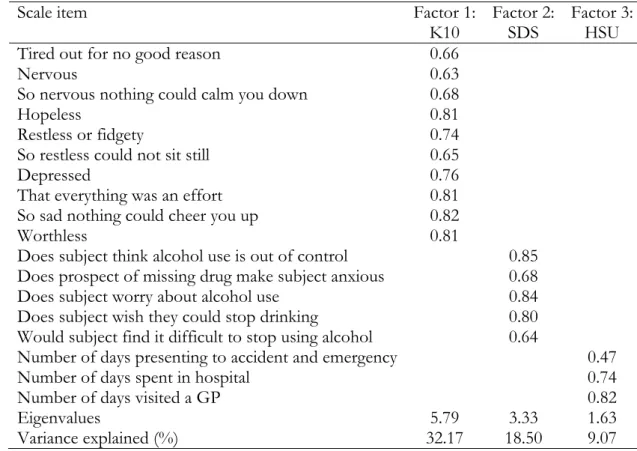
The Kaiser-Meyer-Olkin measure of sampling adequacy (0.905) and Bartlett’s Test of Sphericity (x2(153) = 1751.62, p < 0.001) indicate that it was appropriate to conduct a
factor analysis with the scales contained within the AATOM-C dataset. Three factors emerged from the analysis; the results are presented in Table 5 below.
Factors one contains all 10 items from the K10 and accounts 32% of the variance. Factor Two contains all five items from the SDS, accounting for 19% of the variance and Factor Three contains items from the constructed health service utilisation scale (HSU) and accounts for 9% of the variance.
3.3.6 Content validity
A comprehensive review of the treatment outcome literature and existing measures of treatment outcome, the establishment of an expert content advisory group and on-going consultation with treatment agency staff and other key stakeholders has ensured that the AATOM-C has excellent content validity.
Table 5: Factor loadings of AATOM-C scale scores
Scale item Factor 1:
K10 Factor 2: SDS Factor 3: HSU
Tired out for no good reason 0.66
Nervous 0.63 So nervous nothing could calm you down 0.68
Hopeless 0.81
Restless or fidgety 0.74
So restless could not sit still 0.65
Depressed 0.76
That everything was an effort 0.81
So sad nothing could cheer you up 0.82
Worthless 0.81 Does subject think alcohol use is out of control 0.85
Does prospect of missing drug make subject anxious 0.68
Does subject worry about alcohol use 0.84
Does subject wish they could stop drinking 0.80 Would subject find it difficult to stop using alcohol 0.64
Number of days presenting to accident and emergency 0.47
Number of days spent in hospital 0.74
Number of days visited a GP 0.82
Eigenvalues 5.79 3.33 1.63
3.4 Discussion
The AATOM-C was designed as a core set of treatment outcome measures with particular relevance for Australian alcohol treatment services. It is intended to be brief and easy to administer. The AATOM-C collects demographic and treatment
information and assesses client functioning over a range of domains, including general health and psychological well-being, alcohol use, alcohol dependence, other drug use and health service utilisation.
The aim of this study was to assess the psychometric properties (reliability and validity) of the AATOM-C instrument. In order to do so, 203 participants with a concern for their alcohol use were interviewed at two time points, approximately seven days apart. Overall, the study’s findings indicate that the AATOM-C instrument has good
psychometric properties.
The majority of AATOM-C scales/scores revealed good to excellent reliability indicating consistency of measurement over time and with different interviewers. Several items, however, did reveal poor to fair retest reliability: well-being (Item 10), binge drinking (12d and 12e), number of days accessing accident and emergency in the past three months (32a), nights spent in hospital in the past three months (32b) and number of times visited the GP in the past three months (32c). In an attempt to explain why such items revealed low reliability, the ICC result for each item was broken down by the interviewer to examine any discrepancies between reliability scores. It was found that one interviewer repeatedly produced poorer retest reliability scores. Removing the interviews conducted by this interviewer from the dataset increased the overall reliability scores for the instrument. This highlights the crucial importance of conducting
comprehensive and consistent training with all persons who would administer the AATOM-C (or any standardised psychometric instrument) to treatment recipients. Inconsistency in instrument administration compromises the value of the data collected and the veracity of any conclusions regarding treatment effectiveness that may be drawn from the data. Ultimately, this may lead to the resources and time expended by clinicians on monitoring and evaluation being squandered.
For a number of items (Items 12b, 12c, 12d, 12e, 17, 24, 25, 27, 32b and 32c), inter-rater reliability scores were higher than test-retest reliability scores. Such differences again raise the importance of the need for more comprehensive and regular training for those using the AATOM-C instrument in order to enhance the reliability of responses and to ensure any differences that are observed over time represent real changes. It was
assumed that participants would exhibit very little change over the test-retest interval (i.e., 7-10 days). This, however, may not have been the case for every participant.
Within the alcohol use section of the instrument, excellent reliability scores (both test-retest and inter-rater) were obtained for the quantity and frequency of use (Items 12a and 12b). However, substantial concern was raised regarding the reliability of Items 12d and 12e “days of ‘heavy’ drinking in the past 30 days” and “number of drinks consumed on a ‘heavy’ drinking day in the past 30 days”. Overall both items revealed poor retest
reliability, with inter-rater reliability scores considerably worse, producing non-significant values. Such results suggest ambiguity in the wording of the question and therefore, it was decided that Items 12d and 12e be removed from the AATOM-C interview to assist in maintaining overall good reliability.
The retest reliabilities for categorical data were good to excellent overall with the exception of Item 9 (client’s general health) where both test-retest and inter-rater reliability was poor. Regardless of such results, it was decided that Item nine would remain within the AATOM-C instrument because of its importance; further studies will continue to examine its performance. The internal reliability of all the AATOM-C scales are considered satisfactory, with the K10 and SDS both producing an α < 0.88, and the HSU scale producing α = 0.73. The results of the factor analysis reveal four factors present within the AATOM-C scale structures. Of which, the K10, the SDS and the constructed HSU scale loaded to single factors.
Concurrent validation of the AATOM-C scores with analogous scales from validated instruments produced acceptable agreement with correlation coefficients above 0.55. The content validity of the AATOM-C was ensured through a review of treatment outcome literature, the establishment of an expert advisory group and on-going
consultations with clinical staff and key stakeholders who informed the development of the instruments content.
As a clinical tool, the AATOM-C provides a multi-dimensional platform upon which reliable evaluation of treatment modalities for alcohol dependence can be made by providing current, comparable and accurate information within the Australian context. To be acceptable to clinicians and other AOD workers, the instrument was designed to be clinically relevant, brief and easy to administer and applicable across a range of treatment settings. To assist with the implementation of the instrument, an electronic version of the AATOM-C (the E-AATOM) was developed. The feasibility trial of the AATOM-C is currently underway. Results from the feasibility study will further add to the development and consolidation of the AATOM-C instrument.
4.0 R
EFERENCESAnderson, B. J., Gogineni, A., Charuvastra, A., Longabaugh, R., & Stein, M. D. (2001). Adverse drinking consequences among alcohol abusing intravenous drug users.
Alcoholism: Clinical and Experimental Research 25, 41-45.
Annis, H. M., & Graham, J. M. (1988). Situational Confidence Questionnaire (SCQ 39): Users Guide. Addiction Research Foundation, Toronto.
Australian Institute of Health and Welfare. (2002). Australia's Health 2002. AIHW Cat. No. AUS 25. Australian Institute of Health and Welfare, Canberra.
Australian Institute of Health and Welfare. (2006a). Alcohol and Other Drug Treatment Services in New South Wales 2004-05: Report on the National Minimum Data Set. Australian Institute of Health and Welfare, Canberra.
Australian Institute of Health and Welfare. (2006b). Alcohol and Other Drug Treatment Services in New South Wales 2004-05: Findings from the National Minimum Data Set (NMDS). Australian Institute of Health and Welfare, Canberra.
Brazier, J. E., Harper, R., Jones, N., O'Cathain, A., Thomas, K. J., Usherwood, T., & Westlake, L. (1992). Validating the SF-36 health survey questionnaire: A new outcome measure for primary care. British Medical Journal 305, 160-164.
Centre for Substance Abuse Treatment. (1995). Developing State Outcome Monitoring Systems for Alcohol and Other Drug Abuse Treatment: Treatment Improvement Protocol (TIP) Series 14. Centre for Substance Abuse Treatment, Rockville, MD, pp 95-3031.
Cicchetti, D. V. (1994). Guidelines, criteria and rules of thumb for evaluating normed and standardized assessment instruments in psychology. Psychological Assessment 6, 284- 290.
Collins, D. J., & Lapsley, H. M. (2002). Counting the Cost: Estimates of the Social Cost of Drug Abuse in Australia 1998-99. Commonwealth Department of Health and Aged Care, Canberra.
Connors, G. J., Allen, J. P., Cooney, N. L., DiClemente, C., Tonigan, J. S., & Anton, R. F. (1994). Assessment issues and strategies in alcoholism treatment matching research. Journal of Studies on Alcohol, Supplement No. 12, 92-100.
Connors, G. J., Tonigan, J. S., & Miller, W. R. (1996). A measure of religious background and behaviour for use in behaviour change research. Psychology of Addictive Behaviours 10, 90-96.
Copeland, J., & Conroy, A. (2001). Australian National Minimum Data Set for Clients of alcohol and other drug treatment services: findings of a national pilot and
developments in implementation. Drug and Alcohol Review 20, 295-298.
Copeland, J., Rush, B., Reid, A., Clement, N., & Conroy, A. (2000). Alcohol and Other Drug Treatment: Predictors of Outcome and Routine Monitoring. National Drug and Alcohol Research Centre, University of New South Wales, Sydney.
Crofts, N., & Aitken, C. (1997). Incidence of blood-borne virus infection and risk behaviours in a cohort of injecting drug users in Victoria, 1990-1995. Medical Journal of Australia 167, 17-20.
Cronbach, L. J. (1951). Coefficient alpha and the internal structure of tests. Psychometrika 16, 297-334.
Cummins, R. A., Eckersley, R., Lo, S. K., Okerstrom, E., Hunter, B., & Davern, M. (2004). Australian Unity Wellbeing Index: Cumulative Psychometric Record. Australian Centre on Quality of Life, School of Psychology, Deakin University, Melbourne.
Cummins, R. A., McCabe, M. P., Romeo, Y., & Gullone, E. (1994). The Comprehensive Quality of Life Scale: Instrument development and psychometric evaluation on tertiary staff and students. Educational and Psychological Measurement 54, 372-382.
Darke, S., Hall, W., Heather, N., Wodak, A., & Ward, J. (1992). Development and validation of a multi-dimensional instrument for assessing outcome of treatment among opiate users: The Opiate Treatment Index. British Journal of Addiction 87, 733-742.
De Alba, I., Samet, J. H., Saitz, R. (2004). Burden of medical illness in drug and alcohol dependent persons without primary care. American Journal of Addiction 13, 33-45.
Dennis, M. L., Rouke, K. M., & Caddell, J. M. (1993). Global Appraisal of Individual Needs (GAIN): Resource manual (NIDA Grant No. R01-DA07864). Research Triangle Park, Research Triangle Institute, NC.
Feragne, M. A., Longabaugh, R., & Stevenson, J. F., (1983). The psychosocial functioning inventory. Evaluation and the Health Professionals 6, 25-48.
Ferri, C. P., Marsden, J., De Araujo, M., Laranjeira, R. R., & Gossop, M. (2000). Validity and reliability of the Severity of Dependence Scale (SDS) in a Brazilian sample of drug users. Drug and Alcohol Review 19, 451-455.
Gerstein, D. R., Johnson, R. A., Harwood, H., Fountain, D., Suter, N., & Malloy, K. (2004). Evaluating Recovery Services: The California Drug and Alcohol Treatment Assessment (CALDATA) Executive Summary. California Department of Drug and Alcohol Programs, Sacramento.
Gossop, M., Darke, S., Griffiths, P., Hando, J., Powis, B., Hall, W., & Strang, J. (1995). The Severity of Dependence Scale (SDS): Psychometric properties of the SDS in English and Australian samples of heroin, cocaine and amphetamine users. Addiction 90, 607-614. Gossop, M., Marsden, J., Stewart, D. (2002). Dual dependence: Assessment of
dependence upon alcohol and illicit drugs, and the relationship of alcohol dependence among drug misusers to patterns of drinking, illicit drug use and health problems. Addiction 97, 169-178.
Health and Welfare Canada (1992). How Effective are Alcohol and Other Drug Prevention and Treatment Programs: A Review of Evaluation Studies. Health and Welfare Canada, Ottawa.
Holcomb, W. R., Parker, J. C., & Leong, G. B. (1997). Outcomes of inpatients treated on a VA psychiatric unit and a substance abuse treatment unit. Psychiatric Services 48, 699-704. Holder, H., & Blose, J. O. (1992). The reduction of health care costs associated with alcoholism treatment: A 14 year longitudinal study. Journal of Studies on Alcohol 18, 293-302.
Horn, J. L., Wanberg, K. W., & Foster, F. M. (1974). The Alcohol Use Inventory. Centre for Alcohol Abuse, Research and Evaluation, Denver Colarado.
Hunkeler, E. M., Hung, Y-Y., Rice, D. P., Weisner, C., & Hu, T-W. (2001). Alcohol consumption patterns and health care costs in an HMO. Drug and Alcohol Dependence 64, 181-190.
Kadden, R. M., & Litt, M. D. (2004). Searching for treatment outcome measures for use across trials. Journal of Studies on Alcohol 65, 145-152.
Kessler, R. C., Andrews, G., Colpe, L. J., Mroczek, D. K., Normand, S-L.T., Walters, E. E., Zaslavsky, A. (2002). Short screening scales to monitor population prevalence and trends in non-specific psychological distress. Psychological Medicine 32, 959-976.
Landis, J., & Koch, G. G. (1977). The measurement of observer agreement for categorical data models. Biometrics 33, 159-174.
Larson, M. J., Saitz, R., Horton, N. J., Lloyd-Travaglini, C., & Samet, J. H. (2006). Emergency department and hospital utilisation among alcohol and drug dependent detoxification patients without primary medical care. The American Journal of Drug and Alcohol Abuse 32, 435-452.
Lawrinson, P., Copeland, J., & Indig, D. (2003). The Brief Treatment Outcome Measure: Opioid Maintenance Pharmacotherapy (BTOM) Manual. National Drug and Alcohol Research Centre, University of New South Wales, Sydney.
Lawrinson, P., Copeland, J., & Indig, D. (2005). Development and validation of a brief instrument for routine outcome monitoring in opioid maintenance pharmacotherapy services: The brief treatment outcome measure (BTOM). Drug and Alcohol Dependence 80, 125-133.
Lawrinson, P., Copeland, J., Gerber, S., & Gilmour, S. (2007). Determining a cut-off on the Severity of Dependence Scale (SDS) for alcohol dependence. Addictive Behaviors 32, 1474-1479.
Marlatt, G. A., & Gordon, J. R. (1985). Relapse Prevention, Guilford, New York.
Marsden, J., Gossop, M., Stewart, D., Best, D., Farrell, M., Lehmann, P., Edwards, C., & Strang, J. (1998). The Maudsley Addiction Profile: A brief instrument for assessing treatment outcome. Addiction 93, 1857-1868.
McLellan, A. T., Alterman, A. I., Metzer, D. S., Grissom, G. R., Woody, G. E., Luborsky, L., & O'Brien, C. P. (1994). Similarity of outcome predictors across opiate, cocaine and alcohol treatment services. Journal of Clinical and Consulting Psychology 62, 1141-1158.