IMPLEMENTATION AND ASSESSMENT
A Thesis Presented to
The Faculty of Graduate Studies of
The University of Guelph
by
GORDON CLEMENT
In partial fulfilment of requirements for the degree of
Master of Science August, 2011
c
TECHNOLOGY IN MATHEMATICS EDUCATION: IMPLEMENTATION AND ASSESSMENT
Gordon Clement Advisors:
University of Guelph, 2011 Professor Jack Weiner
Professor Herb Kunze
The use of technology has become increasingly popular in mathematics education. Instructors have implemented technology into classroom lessons, as well as various applications outside of the classroom. This thesis outlines technology developed for use in a first-year calculus classroom and investigates the relationship between the use of weekly formative online Maple T.A. quizzes and student performance on the final exam. The data analysis of the online quizzes focuses on two years of a five-year study. Linear regression techniques are employed to investigate the relationship between final exam grades and both how a student interacts with and performs on the online quizzes. A set of interactive class notes and a library of computer demon-strations designed to be used in and out of a calculus classroom are presented. The demonstrations are coded in Maple and designed to give geometric understanding to challenging calculus concepts.
To the great teachers who have inspired me to follow this path and to my family and friends
Acknowledgements
This work would not have been possible without the support and guidance of my advisory committee. I would like to thank committee members Jack Weiner, Herb Kunze and Jeremy Balka for teaching me so much throughout my undergraduate and graduate experiences at the University of Guelph. Your passion in the classroom and commitment to your students is what inspired me to pursue research in this area and a career in the field of education. Each of you lent your expertise to different aspects of this thesis, which was instrumental in the completion of this work. Your friendship and guidance has been invaluable to me during my time at the University of Guelph. Thank you to David Kribs, Dan Ashlock and Anthony Vannelli for taking time from your busy schedules to be part of the examining committee. Your input and suggestions were very much appreciated.
Thank you to my “unofficial” advisory committee member Hosh Pesotan for being supportive throughout my graduate degree. Hosh was always the first person to respond with insightful edits to each version of this thesis. Thank you to Gary Umphrey for lending your statistical expertise and suggestions to the data analysis sections of this thesis.
Thank you to the Natural Sciences and Engineering Research Council of Canada, Maplesoft and the University of Guelph for providing funding that made this research possible.
on task and opportunities to relax, exactly when I needed them, making the timely completion of this thesis possible.
Contents
List of Tables viii
List of Figures ix
1 Introduction 1
2 Review of the Literature 4
2.1 Assessment of Computer-Assisted Instruction . . . 6
2.2 Assessment of Regular Online Testing . . . 8
2.2.1 Comparing online testing with paper-based assessment . . . . 9
2.2.2 Analysis of student attitude towards online testing . . . 12
2.2.3 Analysis of the use of formative online quizzes on student learning . . . 15
3 Analysis of Data 19 3.1 Introduction of Technology Used in the Classroom . . . 19
3.2 Analysis of Winter 2010 Data . . . 25
3.2.1 Model 1: Analysis of number of quizzes completed . . . 27
3.2.2 Model 2: Analysis of performance on Maple T.A. quizzes . . . 30
3.2.3 Model 3: Analysis of number of attempts per quiz . . . 32
3.2.4 Results of the attitudinal survey . . . 35
3.3 Analysis of Winter 2011 Data . . . 36
3.3.1 Model 1: Analysis of number of quizzes completed . . . 38
3.3.2 Model 2: Analysis of performance on Maple T.A. quizzes . . . 39
3.3.3 Model 3: Analysis of number of attempts per quiz . . . 40
3.3.4 Models 4 and 5: Analysis of date of first attempt of quiz . . . 41
3.3.5 Results of the attitudinal survey . . . 43
4 Presentation of Material Developed for First-Year Calculus Topics 47
4.1 The Formal Definition of a Limit . . . 49
4.1.1 Description of the Lesson . . . 49
4.1.2 Introduction of the Learning Tool . . . 50
4.1.3 Discussion and Suggested Use . . . 53
4.2 Rolle’s Theorem, the Mean Value Theorem and the Intermediate Value Theorem . . . 55
4.2.1 Description of the Lesson . . . 55
4.2.2 Introduction of the Learning Tool . . . 57
4.2.3 Discussion and Suggested Use . . . 59
4.3 Graphing Equations in Polar Coordinates . . . 61
4.3.1 Description of the Lesson . . . 61
4.3.2 Introduction of the Learning Tool . . . 62
4.3.3 Discussion and Suggested Use . . . 62
4.4 The Proof of the Fundamental Theorem of Calculus . . . 64
4.4.1 Description of the Lesson . . . 64
4.4.2 Introduction of the Learning Tool . . . 64
4.4.3 Discussion and Suggested Use . . . 68
5 Results and Future Work 69 5.1 Future Work . . . 70 Bibliography 72 Appendix A 77 Appendix B 80 Appendix C 88 Appendix D 95
List of Tables
3.1 A table of various correlations between pairs of variables for the W10
semester. . . 27
3.2 Results from Model 1 for the W10 semester (Equation (3.1)). . . 30
3.3 Results from Model 2 for the W10 semester (Equation (3.2)). . . 31
3.4 Results from Model 3 for the W10 semester (Equation (3.3)). . . 34
3.5 A table of various correlations between pairs of variables for the W11 semester. . . 37
3.6 Results from Model 1 for the W11 semester (Equation (3.1)). . . 38
3.7 Results from Model 2 for the W11 semester (Equation (3.2)). . . 39
3.8 Results from Model 3 for the W11 semester (Equation (3.3)). . . 40
3.9 Results from Model 4 for the W11 semester (Equation (3.4)). . . 41
List of Figures
3.1 An example of feedback the user can see after a Maple T.A. quiz has been completed. . . 22 3.2 An example of a Maple T.A. quiz question, asking the user to enter
information at some key steps of the problem. . . 23 3.3 Box plot of final exam scores vs. number of quizzes completed. . . 28 3.4 Studentized Residuals versus fitted values for Model 1 in the W10
semester, using ordinary least squares regression techniques. . . 29 3.5 Histogram of average attempts per Maple T.A. quiz. . . 33 3.6 Scatter plot of average attempts per online quiz and final exam grade 33 3.7 Histogram of the average number of days before the due date that
students first attempted the online quiz. . . 42 4.1 A series of frames from an example FormalLimitanimation. . . 51 4.2 A series of frames from an exampleFormalLimitAtInfinityanimation. 52 4.3 A series of frames from an exampleFormalLimitToInfinityanimation. 53 4.4 A common sample problem in a first-year formal limit definition unit,
along with a common error students may make. . . 55 4.5 A series of frames from an exampleMVT animation demonstrating the
mean value theorem. . . 58 4.6 A series of frames from an exampleIVT animation demonstrating the
intermediate value theorem . . . 59 4.7 A series of frames from an example PolarAnimateanimation. . . 63 4.8 Illustrations of A(x),A(x+h) and A(x+h)−A(x). . . 66 4.9 A series of frames from the animation used to motivate a key step in
Chapter 1
Introduction
There are various ways of integrating technology into a mathematics classroom. Some instructors choose to utilize a computer algebra system for in-class demonstra-tions, or have students use the system to complete assignments. One may also post learning modules on the internet for students to use as a self-study guide. The use of online testing is also wide-spread. Online testing systems can be used as a diagnostic tool for placing students into the correct course, for summative testing, and for for-mative assessment. With all of these options available, the assessment of technology in education becomes very important. The assessment of technology use in education is challenging, as measuring learning is difficult and with many confounding factors it is hard and probably wrong to attribute that learning to any one cause.
The development of new uses of technology to engage students is an important task. Interactive class notes give the instructor an opportunity to present the math-ematical concepts in the classroom in an innovative way. Notes can be developed
using mathematical software to display graphics or answers that the software gives to problems completed in class. Computer demonstrations can be utilized to help stu-dents visualize concepts in the classroom and explore topics on their own time. One effective method is to design demonstrations that bring a geometric understanding to challenging mathematical concepts.
The structure of this thesis is as follows. Chapter 2 presents a review of relevant literature pertaining to technology use in mathematics education. It also discusses the difference between formative and summative assessment and the challenges in designing an educational experiment. In Chapter 3, results of a five-year study of the use of the online testing system Maple T.A. in a first-year University of Guelph calculus course are presented. The testing system was utilized to provide students with regular formative quizzes. Based on techniques learned through the literature search, the data analysis focuses on how students interact with the testing system and not necessarily just their performance on the online quizzes. The availability of information such as the number of times a student attempted each quiz and the date on which the student first attempted each quiz allows our data analysis to test the effect of how the student interacts with the system in ways not found in the litera-ture. Student attitude towards the online testing is assessed through survey results. In Chapter 4, a set of interactive class notes and a small library of computer demon-strations designed for a first-year calculus class are presented. This gives the reader examples and inspiration for how computer-aided instruction may be beneficially
uti-lized in a mathematical setting. Finally, Chapter 5 gives a summary of the results and some discussion of future work.
Chapter 2
Review of the Literature
The literature regarding the use of technology in mathematics classrooms is di-verse. One can find many papers discussing implementations of new technologies for various courses (for instance, see Jacobs [16]), but it is difficult to find papers that evaluate the success or failure of the technologies in a statistically meaningful way. This could be due to the difficulty in designing a proper experiment in an educa-tional setting. Many authors have attempted to measure the effect of technology in the classroom using a control versus treatment design, (i.e., Bonham et. al [3], Brown and Liedholm [4], Ashton et. al [2], Dinov et. al [9], McSweeney and Weiss [18] and Spradlin [23]). Generally these experiments involve having one section of a course presented in a traditional way and another presented with technology. A common issue in designing a study this way is students cannot be randomly placed into the sections, since students must be free to arrange their own schedules, resulting in a quasi-experimental design. There are also numerous sources of variation in an
educational setting that can be very difficult to account for; for instance, different sections having different instructors, various levels in student preparation coming into the course, differences in student effort in the given subject and students not using the learning tools in the way they are intended. There are also ethical concerns in performing experiments in an educational setting. For example, restricting access to the learning tool to all students in the control group eliminates a possible positive learning experience for those students. Some studies have even limited some students’ access to online material to reduce variability in students’ willingness to work as a factor in the experiment. Many educational institutions require student consent be-fore s/he is involved in the study, which can lead to the issue that Stillson and Alsup [25] had where only 55% of their class agreed to be involved in the study (nearly half of their data needed to be discarded). With the issues involved in conducting an experiment, some studies, such as the study presented in this thesis and the one of Angus and Watson [1] have chosen instead to perform an observational study in which the instructor presents the course with the technology as s/he normally would. Linear regression techniques are then used to attempt to account for sources of vari-ation. This does not give the benefit of comparing to a control group, but it also avoids the aforementioned issues.
Since many of the studies that we focus on will discuss formative versus summa-tive assessment, let us define these terms. In the broadest sense, formasumma-tive assessment is assessment for learning, whereas summative assessment is assessment of learning.
Formative assessment typically occurs during the course by allowing students to com-plete exercises in an environment that is less stressful than a formal test and giving students feedback to allow them to identify strengths and weaknesses. Ideally, for-mative assessment would not count towards the students final grade; however, many instructors find that a small percentage of the course grade must be allocated to the formative assessment in order for the student to take it seriously and complete it. Summative assessment is any assessment designed to evaluate the student’s knowl-edge of the subject material and produce a grade for the student. The most common form of summative assessment is a final exam.
2.1
Assessment of Computer-Assisted Instruction
Computer-assisted instruction (CAI) refers to any instruction done in or out of the classroom that utilizes computers or technology. Many authors have investigated the effects of this type of instruction. A report on their findings follows.
Bruce and Ross [5] investigated the use of the interactive program CLIPS (Critical Learning Instructional Paths Support, see http://www.oame.on.ca/clips/index. html) in several grade 11 and 12 classrooms to further understanding in the trigonom-etry unit. This program was designed to give students independent lessons, including video demonstrations and assigned readings, followed by quizzes and other activities. They found that students benefitted the most when they were exposed to the learning tool after having the lesson presented in class, not before the in-class lesson. They
also found CLIPS had little effect on student attitude. Students were less positive about using the technology when exposed to it before the in-class lesson.
Brown and Liedholm [4] ran three versions of a microeconomics course: a control group with three hours of lecture each week; a hybrid class with two hours of lecture each week, supplemented with various online components including a large interactive problem set; and a fully online course. The online course had access to the same online components as the hybrid course, as well as live streaming of the in-class lectures. A common exam was written by all three class types at the completion of the course. They found that the control class outperformed the online class, and all other pairwise comparisons were not significant. There was no difference between the class types on the basic definition questions, but there was a marked difference between the online course and the in-class courses on the questions that called for more in-depth knowledge of the subject material.
Dinov et. al [9] performed various experiments using an online computational resource in an introductory statistics course. Comparisons were made between a tra-ditional class and a class that viewed many in-class demonstrations and completed assignments with the computational tool. They found a statistically significant dif-ference in performance between students who were exposed to the resource and those who were in the control group. While students who were exposed to the resource performed better, the size of this difference was small.
positive effect of students being exposed to a computer-assisted instruction environ-ment. The analysis showed that CAI packages that were designed specifically for one course had a larger effect on student performance than that of generally published CAI packages. They also found gains were higher when the technology was used con-sistently throughout the course, not just as a one-time instance. The study compared CAI packages that provided feedback to students with ones that did not. There was no evidence to support the hypothesis that CAIs that provided feedback to students generated a greater improvement in student performance. A possible explanation for this result may come from the research of Cazes et al. [8], which measured the amount of time students spent reading the CAI feedback page. This study noted that students only briefly viewed the feedback screen before clicking to move on. We see one of the challenges of using a CAI package is motivating students to use the system as the instructor intends.
2.2
Assessment of Regular Online Testing
Computer-assisted assessment is any assessment method the students complete via a computer, typically automatically graded by the computer program. There are three main research questions in the literature regarding computer-assisted assessment:
1. Can online testing adequately replace traditional paper-based testing methods?
3. Do regular online formative assessments enhance student learning?
The first question has been discussed by many authors, but will not be the focus of this study. With increasing class sizes and the lack of funds to hire markers, many instructors are not faced with the question of “Should we have regular online quizzes or weekly paper-based quizzes?” but rather “Should we have regular online quizzes or no quizzes at all?”. The second and third questions must both be answered “yes” in order to have a successful implementation of online formative testing. The second question is of particular importance because students and instructors may reject the online assessment tool if they are faced with technical difficulties. An example of this is noted by Bonham et al. [3], where a sluggish server and errors in the programming of quiz questions led to a rejection of the technology by both instructor and students.
2.2.1
Comparing online testing with paper-based assessment
The main disadvantage of current online assessment techniques is that the com-puter grades only the final answer and does not follow through the student’s solution to award partial credit as a human grader would. Ashton et al. [2] attempted to incor-porate partial credit in online assessment in two different ways. The first was based on having students enter information at each key step of the problem; for instance, if the question asked for the equation of the tangent line to a function at a particular point, the user would be asked to enter the derivative of the function, the value of the function at the point and finally the equation of the tangent line. The issue they
noted with this approach was that students were given the strategy to solve each question. To attempt to fix this issue, the questions were designed to ask only for the final answer, but give students the option to press a button labeled “Steps”, which would then ask for the additional information. If the student chose to use “Steps”, they were deducted any marks reserved for the strategy of the question; for instance, in the tangent line example they would lose one of four marks. The second method of accounting for the lack of partial credit was to ask only for the final answer, but allow students to see if their answer is correct and change it if it is not. This method was based on the belief that most errors would be simple arithmetic errors and if the student was aware there was a mistake, s/he would be able to look over the work and correct it. Groups of students at five different schools wrote a standardized mathe-matics test using one of the above methods or a traditional paper-based test. They found very few students in the “Steps” group actually used the “Steps” option (it was used 75 times out of a total of 520 opportunities). Overall they found no significant difference in student performance between the three testing methods; however, the experiment had many issues. For instance, many students were not able to finish the computer version of the test in the allotted time as they were unfamiliar with the system, which limited the analysis to only those questions that all students were able to complete. Unfamiliarity with the system also resulted in students making many input errors, so many tests had to be manually graded anyway. An approach to online testing that avoids these issues with partial credit is to ask only fundamental
questions that require only one or two steps and reserve the more in-depth, multi-part questions for written exams.
Some instructors have found ways around issues with grading in an online envi-ronment. For example, Cann [6] developed “extended multiple choice” questions with ten or more possible answers. This helped to avoid problems with grading rounded numerical answers and issues with students guessing the correct answer in typical mul-tiple choice questions. However, new technologies and advancements in online testing systems that allow for mathematical grading have enabled instructors to ask the kind of questions that would have previously been reserved for hand-marked assignments or, in some cases, would not have been possible to pose before. For instance, Sangwin [20] utilized the online testing system AIM (Alice Interactive Mathematics) which gives the question designer access to the Maple mathematical engine to ask students very challenging, open ended questions, such as ‘Find a singular 5×5matrix with no repeated entries’. However, some may consider this to be an abuse of the power that these testing systems give, as challenging multi-step questions should be graded by hand to award students points for the logic they use to solve such problems.
Bonham et al. [3] compared two groups of students, one submitting weekly written assignments and one completing weekly randomized online quizzes. The students were able to submit the online quizzes multiple times, leading to a higher average on the online quizzes than the written homework. There was no significant difference in exam score between the two groups. They also noted that even though the written
homework group had more experience submitting full written solutions, their exam papers did not have a higher level of detail compared to the online homework group (as measured by the number of words, equation signs, written variables and units given in the written portion of the exam).
Spradlin [23] performed a study at a small university that compared two sections of developmental mathematics students submitting daily written homework with two sections completing regular online quizzes using a tool that was provided with the course textbook. The online quizzes were mostly multiple choice and matching ques-tions. The experiment performed was a non-randomized control group versus treat-ment pre-test post-test design. They found no significant difference in post-test scores after adjusting for pre-test scores in the two groups.
The above studies give some indication that online testing can adequately replace paper-based methods. Comparisons of performance between students completing homework by hand and online have not yielded significant differences. Current testing systems give instructors the ability to ask sophisticated mathematical problems and grade them accurately.
2.2.2
Analysis of student attitude towards online testing
Typically, student attitude towards online testing is measured via surveys or testi-monials of students in the classroom. Reported results are very positive. For instance, Engelbrecht and Harding [11] combined weekly online quizzes and had online
com-ponents to the midterms and final exam. They found that 56% of students surveyed preferred the online assessment over paper assessment. Shafie and Janier [21] utilized an online testing package provided by the textbook and found that approximately 80% of students agreed that the online component of the course had a positive im-pact on their learning. The study by Angus and Watson [1], which is discussed in detail in the next section, resulted in over 90% of survey respondents agreeing that the online quizzes were a useful tool to help them study consistently throughout the semester.
Cassady et al. [7] suggested using formative testing to allow students to write in a stress-free environment in order to identify strengths and weaknesses. They found that, although changing the testing format from written to online showed no difference in test anxiety, the online tests had a lower perceived threat. They also found students with limited or no use of the formative online quizzes that were available before the written tests had a high level of test anxiety.
Instructors at Macquire University in Sydney, Australia, have developed the pow-erful randomized testing system MacQTEX, as reported by Griffin and Gudlaugsdottir [13][14]. Quizzes are generated as PDF documents via LATEXwith javascript process-ing built in to handle randomization and gradprocess-ing of student responses. The main advantage of this system is that server communication is required only to initialize and submit quizzes and not continuously while the student is writing the quiz, as with most testing systems. A disadvantage of this system is that question authoring
requires a good deal of programming savvy, but a large bank of questions is available for instructors to choose from. The quizzes are designed to encourage students to review previous mathematical topics and test only technical ability, with questions requiring deeper understanding reserved for written tests. Griffin and Gudlaugsdottir chose to implement the quizzes using a pass/fail system, where passing was defined as committing no more than two errors. Students were allowed unlimited attempts at each quiz, and full solutions to all questions were displayed after the quiz was sub-mitted. This was designed to encourage students to immediately try the quiz again if they did not pass. The classes had a very high pass rate on the quizzes. Although no attempt was made to measure whether the quizzes had a positive impact on stu-dent learning, survey data indicated that stustu-dents had a positive attitude towards the testing system. More than 75% of students agreed that the quizzes helped them understand the concepts in the course, 70% believed the quizzes helped the students express their solutions in a clear and logical way, and 75% agreed that completing the quizzes helped them remember the processes for solving particular problems. Sur-prisingly, more than half of the class claimed they did quizzes again for more practice even after they had passed.
The above demonstrates that it is possible to have students recognize and embrace online testing as a means of better understanding course materials. Of course, this depends on the particular implementation of online testing, but it is a positive sign to see these successful outcomes.
2.2.3
Analysis of the use of formative online quizzes on
student learning
Determining whether online testing has a positive outcome on student learning is very difficult. This is due to the many confounding factors involved in education, as well as the lack of ability to determine if the students are using the online quizzes as designed. Authors have compared performance on online quizzes to performance on written exams; for instance, Smith [22] found that final exam grades correlated higher to online assignment grades than to written assignments or laboratory report scores. This, however, is not conclusive in determining whether the online quizzes helped students learn the material, as perhaps the online quiz questions were more similar to the questions tested on the final exam.
Stillson and Alsup [25] used the online testing system ALEKS (Assessment and Learning in Knowledge Spaces), which is designed to identify student strengths and weaknesses and allow students to master all material in the course. They found that performance on the online material did not correlate highly to final exam grades. They also found time spent working in the system correlated highly with exam scores. Unfortunately, this study looked only at the correlation between time spent on the system and exams scores without considering other variables, such as those related to past performance of the students. This made it impossible to determine whether using ALEKS resulted in better learning or if stronger students were using ALEKS more.
McSweeney and Weiss [18] performed an experiment to determine the effect of the Math Online system in a first-year calculus course. The system was designed to allow students to review fundamentals and pre-calculus topics independently, as the instructors found these issues took up too much class time. The online assignments were randomly generated multiple choice questions. Multiple instructors each taught two sections of the course concurrently, one section using the system and one section without. The study included data from 12 different sections with 25 to 35 students in each section. They found the averages on the written tests were statistically sig-nificantly higher in the Math Online group. A multiple-choice pre-test was given to all students during the first week of classes and the same test was given to all stu-dents at the end of the semester. The difference in a student’s pre-test and post-test scores was interpreted as their algebraic improvement over the semester. The study showed evidence that the students using Math Online had a higher average pre-test to post-test improvement score. They also found that within the Math Online group, each online quiz a student completed resulted, on average, in an additional half point improvement score from pre-test to post-test. Additionally, they noted that to see these improvements, the instructor needed to be actively encouraging students to complete the quizzes, as there were no differences in the sections taught by a more passive instructor.
In the study most comparable to the present work, Angus and Watson [1] utilized retrospective regression methodology to test whether exposure to online formative
quizzes had a positive effect on student learning. They introduced four formative online quizzes (worth 2% each) to a first-year applied mathematics course. Data was collected from two sections of the course in two subsequent years, the first hav-ing approximately 400 students, the second approximately 1200. The quizzes were randomized and required the input of a single calculated number, with grading toler-ances set to avoid grading issues with rounded numbers. Students were allowed two attempts at each quiz. Unlike many authors, they did not focus on student perfor-mance on the quizzes, just on the amount the student engaged with the quizzes. They attempted to account for various sources of variation, such as previous mathematical ability, in-course mastery of subjects and the level of effort put towards the course by including many explanatory variables. Previous mathematical ability was accounted for using variables indicating which high school mathematics courses the student had taken; in-course mastery was measured by midterm grades; effort towards the course was measured by attendance at voluntary peer-led study groups. Each student’s interaction with the online system was measured by whether or not the student at-tempted all four online quizzes. They found a significant positive impact on students completing all four quizzes, even after accounting for the explanatory variables men-tioned. Completion of all quizzes was associated with 2.5% improvement on the final exam for given values of the explanatory variables. Limitations of this study are that they looked only at the number of quizzes completed, but not other indicators of how the student interacted with the online quizzes, such as when the student wrote the
quizzes or the number of attempts the student had on each quiz.
The current literature has shown much promise that formative online testing can have a positive impact on student learning. Care must be taken to control or account for the various sources of variation in studies, as it is very easy to confound the effects of the online instrument with other factors. The study discussed in the next chapter of this thesis uses lessons learned in the literature to attempt to investigate the relationship between student usage of online testing and final exam performance.
Chapter 3
Analysis of Data
3.1
Introduction of Technology Used in the Classroom
Beginning in the winter semester of 2006, there has been a wide range of technology used in two first-year calculus courses at the University of Guelph (Math*1200 and Math*1210). Through a joint research program with Maplesoft, a Waterloo-based mathematics software company, Professor Jack Weiner utilized Maplesoft products in the classroom and beyond. These first-year calculus classes included students from a wide variety of programs including Arts, Chemistry, Physics, Computer Science, Engineering and Mathematics. During this research period (2006-2011), typical class sizes ranged from 400 to 600 students. During the period of this study in both courses, students’ final grades were determined by three different types of assessments.
1. Three midterm tests, worth 15% each. These were closed-book and given during the teaching semester.
2. Numerous online Maple T.A. quizzes, worth 20% for the semester. These will be described in detail later.
3. A final examination, worth 35%, closed-book, given after the teaching semester.
Students were required to purchase a course manual, with the class notes 70-80% completed, the remaining as blanks to be filled in during lecture. These notes were also created as Maple documents and made available for download from the course website. The Maple class notes were fully executable, meaning that students could investigate each example during and after class to see what answer the software gave to a particular question. They could also change the parameters within questions and immediately see how the answer was affected. Maple was also used by the instructor in class to display plots and animations to the students.
The course had an associated website. The website gave students access to com-pleted class notes, solutions to previous tests, announcements and grades achieved to date. The website also featured a discussion forum. Here students were able to post questions they had on the class material, which could be answered by the Professor, the Teaching Assistants or fellow classmates.
The final use of technology was the weekly online Maple T.A. quizzes. The quizzes were designed to be formative in nature, meaning they were designed to help students master the course material and discover which topics they needed to review, not to simply generate grades for the students. The small grade attached to the quizzes (2% per quiz) was intended to motivate students to complete the quizzes. The online
quizzes could be thought of as enforced homework, providing motivation to complete numerous practice problems on each topic. Each quiz typically had ten short ques-tions, each focusing on one specific learning objective that was covered in lecture. A sample version of each quiz, with full solutions, was available in the course manual. Students were allowed an unlimited number of attempts at each quiz. A practice version of each quiz could be attempted anonymously by students at any time during the semester and did not count for grades. The practice version allowed students to check their answer to each question as they went along. They were thus able to focus on specific question types that were giving them difficulties. The homework version of each quiz was only available to students for one to two weeks, directly after the material needed for that quiz had been covered in lecture. Upon completing a quiz, a student received their grade as well as question-by-question feedback. The feedback included the student’s answer, the correct answer and, at the instructor’s discretion, comments on common errors or an explanation of the correct strategy. Sample feedback is shown in Figure 3.1.
Maple T.A. was chosen as the online quiz software for one very important reason: the access to Maplesoft’s mathematical engine. Many authors have noted that other online assessment tools are limited to multiple choice or fill in the blanks style of questions (for instance see Engelbrecht and Harding [12]). Maple T.A. questions can be designed to be algorithmically generated and mathematically graded. The algorithmic design of the questions and quizzes means that almost every quiz opened
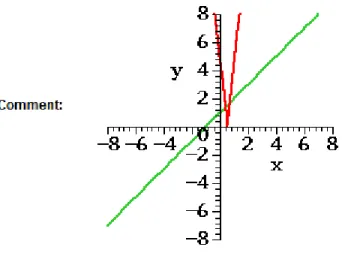
Figure 3.1: An example of feedback the user can see after a Maple T.A. quiz has been completed.
up is unique. It gives the instructor the power to randomly select quiz questions from the question bank and also randomize the numbers or functions within each question. With high probability, each student receives a different quiz from their peers and with every attempt. This reduces problems of academic misconduct. It also gives students access to a very large set of sample problems. The software also allows the instructor to set up questions requiring students to enter information at each key step of the
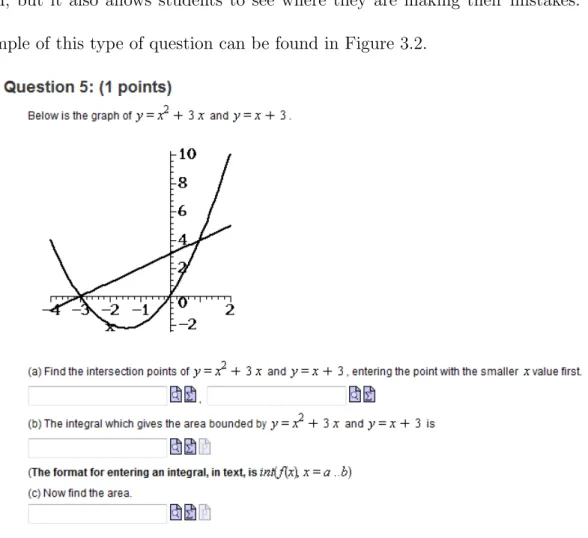
solution. This not only more closely mimics how the question would be graded by hand, but it also allows students to see where they are making their mistakes. An example of this type of question can be found in Figure 3.2.
Figure 3.2: An example of a Maple T.A. quiz question, asking the user to enter information at some key steps of the problem.
As a guide on how to complete these online quizzes effectively, students receive a “T.A. Syntax Sheet” and a “T.A. Protocol Sheet” at the beginning of each semester. The syntax sheet shows students how to correctly enter common mathematical sym-bols and functions into the online testing system. The protocol sheet outlines a suggested strategy for completing these quizzes that should lead to mastery of the
material. Both the “T.A. Syntax Sheet” and the “T.A. Protocol Sheet” can be found in Appendix A, but I will outline the strategy suggested by the protocol sheet.
The suggested strategy is based on three steps. The first is to work out full solutions to a sample quiz that can be found in the course manual. The course manual also contains full solutions to this quiz. This step is designed to help the students understand the mathematics in these questions and allow them to recognize when they need to review the material in the notes before attempting the quiz. The second step is to do a practice version of the online quiz, checking their answer to each question as they complete the quiz. This step is designed to get the students comfortable with entering the answers into the online system, to avoid common syntax errors and to allow students to complete questions that they have not seen before. The students are asked to delay attempting a homework version of the quiz until they have achieved a perfect score on the practice version of the quiz. The final step is to then do a homework version of the quiz.
The aim of this study is to investigate the relationship between the use of tech-nology and student test performance. Data has been collected every year since 2006; however, we will report on two specific semesters (Winter 2010 and Winter 2011). The results from other semesters were similar. We will look at correlations between certain variables, as well as several linear models. Student attitude toward the technology will be analyzed through the results of surveys administered each winter semester.
3.2
Analysis of Winter 2010 Data
In the Fall 2009 (F09) and Winter 2010 (W10) semesters, the first year calculus courses in question were not taught by the creator of the Maple content used in the class. The instructor of these courses did implement all the technology listed at the beginning of this chapter. The new instructor implemented one major change in W10: instead of having ten weekly online quizzes consisting of 8-12 questions each, there were 18 quizzes consisting of 2-4 questions each. The questions used on the quizzes were the same as in previous years.
We wish to investigate the effect of technology on student learning. This is difficult to assess, as there are many confounding factors involved. These factors include a student’s previous mathematical preparation, the student’s willingness to utilize the technology the way the instructor intends and overall student effort to the subject material. We will include several explanatory variables in our models to try to account for some of these factors.
We focus on the winter semesters for two reasons, the first being that students should be well acquainted with the technology used and more importantly, we can use the student’s grade from the fall semester F09 as a measure of student preparedness. One measure of student learning over the semester is their score on the final exam. We will use this score as our response variable.
The explanatory variables we will investigate are the student’s overall grades on the Maple T.A. quizzes, the combined grade of all three midterms, the student’s
grades in the F09 calculus course, the average number of attempts on each online quiz and the total number of the online quizzes the student attempted. All grade data has been scaled to be out of 100 for interpretability. A total of 484 students wrote the final exam in the winter 2010 semester; of these, 423 completed Calculus I in the F09 semester.
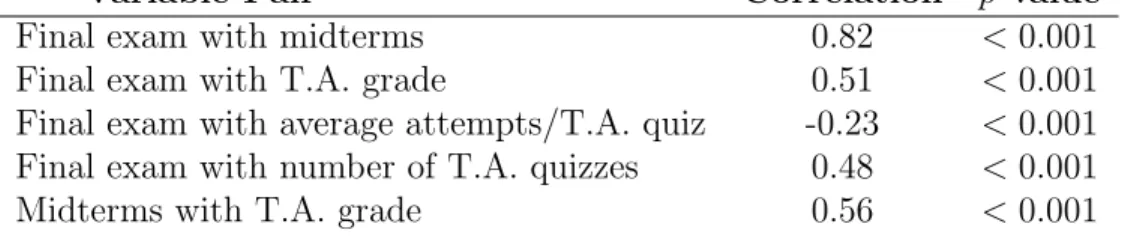
We begin with correlations between our variables of interest, which are found in Table 3.1. We see a very strong relationship between the final exam grade and midterm grades. This is expected as both are closed-book, written and hand-marked tests, making them the most similar of our variables. We see that there is some relationship between the T.A. scores and the grades on the final exam and midterms. This seems to indicate that on average a better score on the online quizzes is associated with a better score on the written tests. There is also a relationship between the number of quizzes completed and the final exam score. This may be evidence of the success of the formative nature of the quizzes; students who complete all quizzes tend to do better on the final exam. However, at this point, we cannot discern whether the quizzes are helping students learn or if the stronger students are completing all quizzes. Finally, we see a weak negative correlation between final exam scores and the average number of attempts on each quiz. This indicates that students with fewer attempts at each homework quiz tend to do better on the final exam. We will now try gain an understanding of the nature of these effects through linear regression techniques.
Variable Pair Correlation p-value
Final exam with midterms 0.82 <0.001
Final exam with T.A. grade 0.51 <0.001
Final exam with average attempts/T.A. quiz -0.23 <0.001 Final exam with number of T.A. quizzes 0.48 <0.001
Midterms with T.A. grade 0.56 <0.001
Table 3.1: A table of various correlations between pairs of variables for the W10 semester.
3.2.1
Model 1: Analysis of number of quizzes completed
The first model we will use was adapted from Angus and Watson [1]. We look to explain student learning through only the usage of the formative online quizzes, not the student’s performance on these quizzes. The model accounts for the student’s previous mathematical preparedness using the grade from the previous semester, and the student’s in-course mastery of the topics in the course using the midterm grades. We measure each student’s usage of the online quizzes by the number of the 18 quizzes the student completed. The main advantage of this model over the model used by Angus and Watson is that we can measure previous student preparedness much more precisely with the grade from the fall semester F09 calculus course. The model used by Angus and Watson did this through the use of dummy variables that indicated which mathematics courses the students took in high school, but not individual performance in these courses. The model we will use to analyze the data is as follows,
where the response variable is the final exam grade, denoted as FE. The midterm grade is denoted MT, the grade from the fall course is labeled FALL. The variables of interest are LOW and HIGH. The variable LOW is assigned a value of 1 if the student completed 9 or less of the 18 online quizzes during the semester, 0 otherwise. HIGH is assigned a value of 1 if the students completed 16 or more of the online quizzes, 0 otherwise.
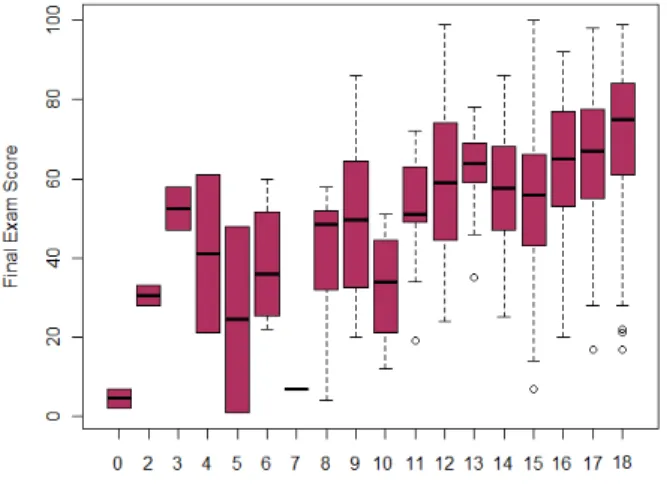
These variables group students into three groups: low use, moderate use and high use of the online quizzes. There were 29 students with low usage, 52 with moderate usage and 349 with high usage. Figure 3.3 gives some indication that students who wrote a higher number of quizzes tended to perform better on the final exam. The goal of this model is to assess whether simply using the online quiz system is associated with a higher final exam grade.
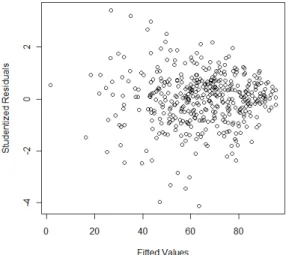
This model was run using ordinary least squares regression techniques. Issues with heteroscedasticity were observed (see Figure 3.4), as the variance appears to be smaller for larger fitted values. Common transformations, such as the logit, were con-sidered and carried out, but these did not result in an improved fit. Interpretability of the parameters on the original scale of measurement was desired, so the decision was made to run models on the untransformed data. In the inference procedures, heteroscedasticity was accounted for by using robust standard errors based on the heteroscedastic consistent covariance matrix (HCCM) (White [27]). Based on the recommendation of Long [17], the HC3 variation of the HCCM was chosen. Com-putations were carried out in the statistical package R, using the package car. The results given by this model can be found in Table 3.2.
Figure 3.4: Studentized Residuals versus fitted values for Model 1 in the W10 semester, using ordinary least squares regression techniques.
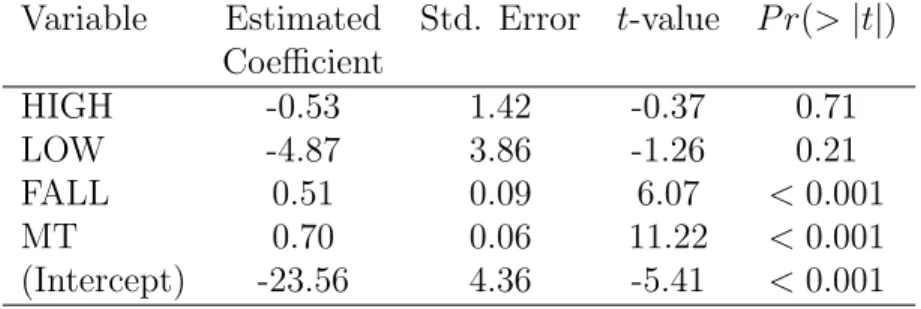
Variable Estimated Std. Error t-value P r(>|t|) Coefficient HIGH -0.53 1.42 -0.37 0.71 LOW -4.87 3.86 -1.26 0.21 FALL 0.51 0.09 6.07 <0.001 MT 0.70 0.06 11.22 <0.001 (Intercept) -23.56 4.36 -5.41 <0.001 R2 = 0.7216
Table 3.2: Results from Model 1 for the W10 semester (Equation (3.1)).
We note from Table 3.2 that most of our explanatory variables are behaving as expected. A higher grade on the midterms or in the previous course is associated with a higher exam score. There is no significant relationship between students with high and moderate usage or between low and moderate usage after accounting for the fall grade and midterm scores. The comparison between low and high usage also yielded no significance after accounting for fall and midterm grades (estimated coefficient for HIGH 0.50, p-value 0.79).
3.2.2
Model 2: Analysis of performance on Maple T.A. quizzes
Here the model of interest involves student performance on the online quizzes. We wish to see if there is a relationship between scores on the Maple T.A. quizzes and final exam grades, after accounting for the midterm scores and final grade from the F09 semester. We introduce the following linear model,
We continue to use final exam score as our response variable. We account for student mathematical preparedness using the student’s grade from the F09 semester and midterm grades as we did in Model 1. The variable of interest is each student’s combined grade on all Maple T.A. quizzes from the semester (denoted as TA). The results provided by this model are available in Table 3.3.
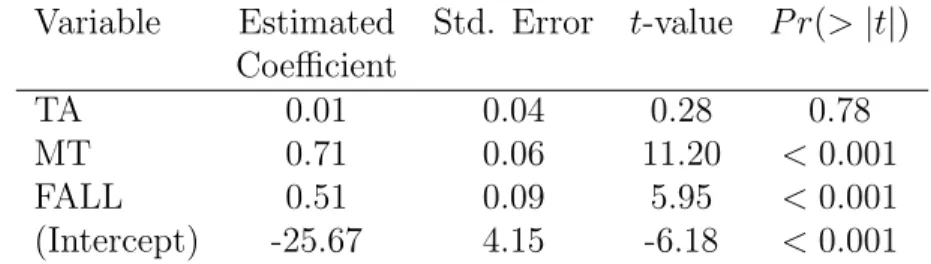
Variable Estimated Std. Error t-value P r(>|t|) Coefficient TA 0.01 0.04 0.28 0.78 MT 0.71 0.06 11.20 <0.001 FALL 0.51 0.09 5.95 <0.001 (Intercept) -25.67 4.15 -6.18 <0.001 R2 = 0.7189
Table 3.3: Results from Model 2 for the W10 semester (Equation (3.2)).
We see that the estimated coefficient for T.A. score is positive, but not significantly different from zero. The fact that these scores are not significant after accounting for the written midterm grade and the grade from the previous course is not surprising. The students have unlimited attempts and access to their class notes while completing the Maple T.A. quizzes, making these grades not an accurate representation of how the student will perform on a closed-book final exam. The midterm tests are very similar to the final exam in both the way they are administered and question style, which is one reason why the midterm grades are the best predictor of final exam grades.
If we run the linear model with just the T.A. and fall semester grades as explana-tory variables, we do find a significant positive relationship between Maple T.A. and
final exam grades (estimated coefficient 0.17, p-value < 0.001). There is significant evidence of a relationship between T.A. grades and final exam grades, after adjusting for the fall semester grades. If midterm grades are also included in the model, the T.A. effect is no longer significant.
3.2.3
Model 3: Analysis of number of attempts per quiz
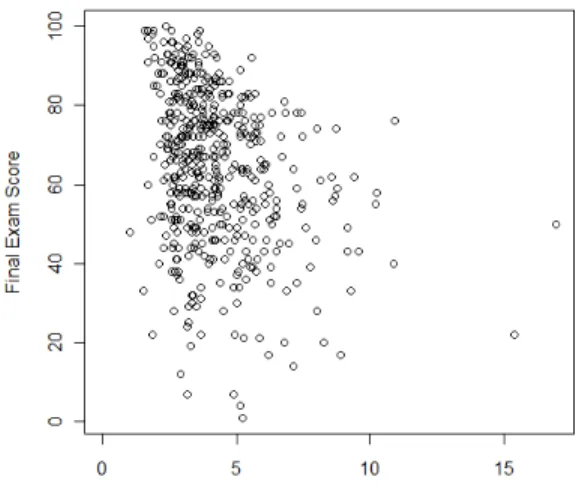
Students were allowed an unlimited number of attempts at each online homework quiz; the class averaged 4.17 attempts on each quiz (see Figure 3.5). Our main research question that this model will address is, “What is the relationship between taking extra attempts to achieve the same grade on the online tests and final exam performance?”. The plot of average attempts versus final exam score (see Figure 3.6) seems to indicate a negative relationship. To address this question, we introduce a linear model,
FEi =β0+β1TAi+β2AvgAttemptsi+εi. (3.3)
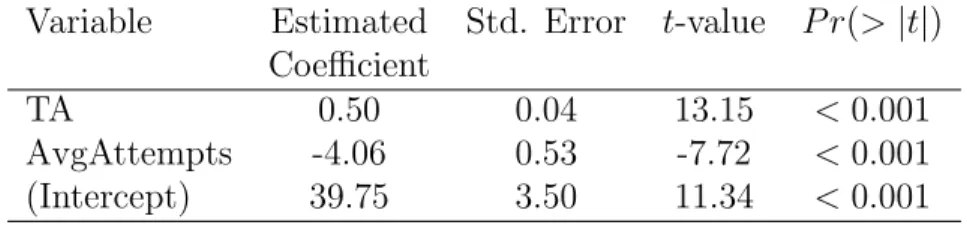
The response variable is the final exam score. Our explanatory variables are TA (each student’s grade on the Maple T.A. quizzes) and the average number of attempts per quiz completed (denoted as AvgAttempts). The point of interest for this model is estimating the relationship between the number of attempts per quiz and final exam grade, after accounting for the student’s score on the online quizzes.
The results provided by this model can be found in Table 3.4. We see the coefficient for our variable TA is positive and significantly different from zero, indicating that a
Figure 3.5: Histogram of average attempts per Maple T.A. quiz.
Variable Estimated Std. Error t-value P r(>|t|) Coefficient TA 0.50 0.04 13.15 <0.001 AvgAttempts -4.06 0.53 -7.72 <0.001 (Intercept) 39.75 3.50 11.34 <0.001 R2 = 0.3548
Table 3.4: Results from Model 3 for the W10 semester (Equation (3.3)).
high grade on the online quizzes is related to a higher grade on the final. We also see our variable of interest, AvgAttempts, has a negative coefficient that is significantly different from zero. This indicates that each extra attempt per quiz students took to achieve the same score on the online quizzes was associated with a 4% decrease in final exam score. The 95% confidence interval for the size of this effect is -5.10% to -3.03%. We offer two possible explanations for the sign and magnitude of this coefficient. The first explanation is that the stronger students in the class will achieve a high grade on the T.A. quizzes in a lower number of attempts, and the second is that students following the “T.A. Protocol” outlined at the beginning of this chapter may both lower their number of attempts required and improve their understanding. Based on the success of students who are known to be following the protocol, it is the belief of the author that following this protocol would result in mastery of the course material. These speculations cannot be tested formally as this would require each student’s work habits to be monitored in order to determine which strategies they are implementing.
3.2.4
Results of the attitudinal survey
Students were asked to complete a survey near the end of the Winter 2010 semester to measure student attitude towards the technology in the classroom. There were 324 respondents out of 483 registered students. A full version of this survey is available in Appendix B of this thesis. The responses to the Maple T.A. quizzes were very positive. Perhaps the most telling statistic from the survey is that 90% of students agreed with the statement “The T.A. quizzes helped me learn” (50% strongly agree, 40% agree, 7% no opinion, 3% disagree, 0% strongly disagree). This shows that the students see the value in the learning tool, which is a big step in getting students to use it properly. As for the rest of the technology used in the classroom, 83% of students believed that “Overall, I benefited from the inclusion of technology in the course” (34% strongly agree, 49% agree, 11% no opinion, 5% disagree, 1% strongly disagree).
The survey also shows the importance of making these quizzes count towards the student’s final grade, since 56% of the students admitted that if the quizzes did not count for grades, they would not make time to write them. This shows that even though the quizzes are designed to be formative, it will be difficult to get students to complete them if they are not treated as a summative assessment.
The survey also highlighted the difficulty of getting students to use new technology on their own. Even though 62% of the respondents agreed that the in-class Maple demonstrations helped them learn, only 18% of the class said that they used the Maple
version of the course notes, modifying them as needed, for their own investigations after class. This is a frustrating aspect of using technology in the classroom; the students know the power of the software and are provided with the opportunity to use it on their own, but are resistant to adopting it for their own independent use.
3.3
Analysis of Winter 2011 Data
In the Fall 2010 (F10) and Winter 2011 (W11) semesters, Math*1200 and Math*1210 were taught by the creator of the Maple content used in the classroom, Professor Jack Weiner. We will again focus our analysis on the winter semester. In the W11 semester, 562 students wrote the final exam; of these students 490 took Math*1200 in the previ-ous fall semester. There were a total of ten online quizzes during the semester. There was one major change in the use of the online quizzes during this school year; students were allowed a maximum of five attempts at each quiz. Students still had unlimited access to the practice versions of the quizzes. The limited number of attempts was to encourage students to treat the quizzes in a serious manner and to follow the “T.A. Protocol” outlined earlier in this chapter.
Our analysis will follow a similar path as with the W10 semester; however, the availability of new data, such as the number of days before the due date students start the quiz, allows us to explore new research questions. We begin by observing correlations between variables of interest in Table 3.5.
Variable Pair Correlation p-value
Final exam with midterms 0.77 <0.001
Final exam with T.A. grade 0.54 <0.001
Final exam with average attempts/T.A. quiz 0.04 0.342 Final exam with number of T.A. quizzes 0.34 <0.001 Final exam with average number of days before 0.43 <0.001
due date quiz is started
Final exam with proportion of quizzes started on due date -0.40 <0.001
Midterms with T.A. grade 0.57 <0.001
Table 3.5: A table of various correlations between pairs of variables for the W11 semester.
and final exam with online quiz grade as we did in the Winter 2010 semester. This indicates that better performance on the midterms or online quizzes is associated with better performance on the final exam. The relationship between midterm grades and final grades is again stronger than that of the relationship between final exam and T.A. grades. We also see a positive relationship between the number of the ten online quizzes the students completed and the final exam grade.
With the limit of five attempts per quiz, we see no relationship between final exam grade and average number of attempts per quiz (correlation 0.04, compared to -0.23 in W10 when attempts were unlimited). We see a positive relationship between final exam grade and the average number of days before the due date a student first attempts an online quiz. This indicates that starting quizzes early is correlated with higher final exam scores. There is a negative relationship between the number of quizzes not attempted prior to the due date and final exam. We will investigate these effects further using linear regression techniques.
3.3.1
Model 1: Analysis of number of quizzes completed
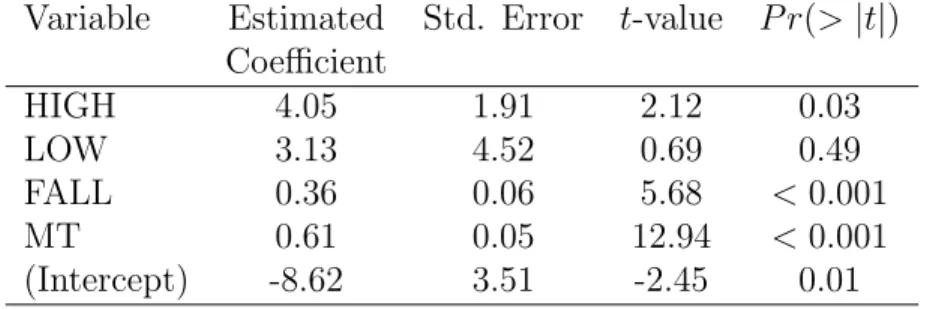
We wish to analyze the effect of the number of quizzes completed using Model 1 in (3.1) as before. Here we define the variable HIGH to have a value of 1 if the student completed nine or more of the ten online quizzes and 0 otherwise and LOW to have a value of 1 if the student completed five or less of the ten online quizzes, 0 otherwise. These values were chosen to group students into three groups, low usage, moderate usage and high usage of the online quizzes. There were 19 students with low usage, 53 with moderate usage and 490 with high usage of the online quizzes. The results provided by this model can be found in Table 3.6.
Variable Estimated Std. Error t-value P r(>|t|) Coefficient HIGH 4.05 1.91 2.12 0.03 LOW 3.13 4.52 0.69 0.49 FALL 0.36 0.06 5.68 <0.001 MT 0.61 0.05 12.94 <0.001 (Intercept) -8.62 3.51 -2.45 0.01 R2 = 0.6476
Table 3.6: Results from Model 1 for the W11 semester (Equation (3.1)).
We find that the effects of the midterm grades and grades from the F10 calculus course are as expected. We have a positive and significant impact of the online quizzes. Students who completed a high number of the quizzes performed on average 4% higher (95% confidence interval 0.30% to 7.81%) on the final exam for given midterm and F10 grades. The coefficient for LOW is positive, but it is not significantly different than zero, giving no evidence of a difference between students who completed a low versus
a moderate number of quizzes after accounting for midterm and F10 performance.
3.3.2
Model 2: Analysis of performance on Maple T.A. quizzes
We repeat the analysis of performance on the T.A. quizzes from W10 on the W11 data using Model 2 in (3.2). The results can be found in Table 3.7.
Variable Estimated Std. Error t-value P r(>|t|) Coefficient TA 0.10 0.04 2.38 0.002 MT 0.58 0.05 12.45 <0.001 FALL 0.32 0.06 5.01 <0.001 (Intercept) -8.49 3.49 -2.43 0.02 R2 = 0.6504
Table 3.7: Results from Model 2 for the W11 semester (Equation (3.2)).
We find a small but significant positive effect of the grade achieved on the Maple T.A. quizzes even after accounting for midterm and previous course grades. We did not see this effect in the W10 semester. The magnitude of the effect may be small, but it does suggest that even after accounting for midterm grades and previous mathematics preparedness, better performance on the online quizzes is associated with better performance on the final exam.
If we run the same model omitting the midterm grade as an explanatory variable, we find that the Maple T.A. grades have a significant and positive relationship with final exam grades (estimated coefficient 0.20, p-value <0.001).
3.3.3
Model 3: Analysis of number of attempts per quiz
In the F10 and W11 semesters, students were limited to five attempts per online homework quiz. In the W11 semester, students averaged 2.16 attempts per quiz, compared to 4.17 in W10 when attempts were unlimited. We analyze the effect of these attempts using Model 3 in (3.3). These results can be found in Table 3.8.
Variable Estimated Std. Error t-value P r(>|t|) Coefficient
TA 0.56 0.04 15.23 <0.001
AvgAttempts -4.01 1.06 -3.77 <0.001 (Intercept) 31.71 3.67 8.64 <0.001
R2 = 0.3057
Table 3.8: Results from Model 3 for the W11 semester (Equation (3.3)).
We observe very similar effects to the W10 semester, despite the restriction on the number of attempts per quiz. Each extra attempt taken per quiz to achieve the same grade on the T.A. quizzes is associated with a decrease in final exam grade of 4%. The 95% confidence interval for the size of this effect is -6.10% to -1.92%. This relationship is similar to that seen in the W10 semester, despite the fact that the number of attempts allowed per quiz was restricted.
3.3.4
Models 4 and 5: Analysis of date of first attempt of
quiz
Typically the online quizzes were available for 14-16 days; despite this, many students left the homework quiz to the last day. For each quiz there was an average of 182 students that made their first attempt on the homework quiz the day it was due. We wish to find what effect starting the quizzes early has and whether there is a negative effect of waiting until the last day. We will investigate this through two models, the first being Model 4 given below:
FEi =κ0+κ1TAi+κ2AvgAttemptsi+κ3AvgDaysi+εi, (3.4)
where TA denotes the student’s grade on the online quizzes and AvgAttempts denotes the average number of attempts per T.A. quiz as before. The variable AvgDays represents the average number of days before the due date the student first attempts the online quiz. The results provided by this model can be found in Table 3.9.
Variable Estimated Std. Error t-value P r(>|t|) Coefficient AvgDays 1.59 0.21 7.56 <0.001 TA 0.47 0.04 10.62 <0.001 AvgAttempts -4.51 1.01 -4.45 <0.001 (Intercept) 34.06 3.58 9.51 <0.001 R2 = 0.3703
Table 3.9: Results from Model 4 for the W11 semester (Equation (3.4)).
We see that starting the online quizzes earlier is associated with higher final exam grades. Given a student’s T.A. grade and average attempts on each quiz, for each
Figure 3.7: Histogram of the average number of days before the due date that students first attempted the online quiz.
day before the due date the student first attempts the quiz on average is associated with a 1.6% increase on the final exam. The 95% confidence interval for the size of this effect is 1.18% to 2.01%.
We also wish to investigate the effects of leaving a quiz to the due date. We do this with Model 5 given below:
FEi =η0+η1TAi+η2AvgAttemptsi +η3pLasti+εi, (3.5)
where the explanatory variables TA and AvgAttempts are as before, pLast represents the proportion of quizzes the student did not attempt until the due date. The results provided by this model are given in Table 3.10.
Variable Estimated Std. Error t-value P r(>|t|) Coefficient pLast -15.42 2.57 -6.02 <0.001 TA 0.44 0.05 9.40 <0.001 AvgAttempts -4.34 1.02 -4.23 <0.001 (Intercept) 47.35 4.69 10.10 <0.001 R2 = 0.3572
Table 3.10: Results from Model 5 for the W11 semester (Equation (3.5)).
We observe that leaving quizzes until the last day has a negative impact on final exam performance. For a fixed T.A. grade and average number of attempts per quiz, each quiz not attempted until the due date is associated with a 1.5% decrease on the final exam (assuming the student completed all ten quizzes). The 95% confidence interval for the size of this effect is -2.05% to -1.04%.
3.3.5
Results of the attitudinal survey
The W11 survey had 368 respondents. The survey was slightly modified from the previous year. We again see a very positive reaction to the Maple T.A. quizzes. 90% of students agreed that the T.A. quizzes helped them learn (57% strongly agree, 33% agree). 46% of respondents claimed that they followed the “T.A. Protocol” outlined in Section 3.1 (completing the sample quiz in the course manual, followed by practice quizzes online, then homework quizzes); 37% stated that they completed practice quizzes online before attempting homework quizzes but did not try the sample quiz in the course manual, while 17% claimed they did only homework versions of the
online quizzes. A total of 223 students estimated their grade in the course to be 80% or higher (at the time of the survey, the students only had the 35% final exam to write, knowing all other grades); of these students, 120 followed the “T.A. Protocol” and only 28 did homework versions of the quizzes exclusively.
3.4
Conclusion and Discussion
All of the above linear models were run again using a logistic transformation, and this did not improve the fit or change the conclusions in any meaningful way. We also ran the models investigating the number of attempts and starting dates of quizzes including the grade from the fall course as a proxy for student mathematical preparedness, which did not change the effects in any significant way. Noting a possible introduction of bias using the average attempts and average starting date only on quizzes the student actually completed, we also ran these models for the W11 semester using only the 414 students who completed all 10 quizzes; this did not change the results in any notable fashion.
We also investigated but did not report on the relationship between the T.A. quizzes and the midterm grades. We ran simple models using each midterm grade as the response variable with the explanatory variables being the student’s grade in the fall course and the student’s grade on the T.A. quizzes taken before that midterm test. These models all showed a significant and positive relationship between the online quiz performance and midterm score (estimated coefficients on T.A. scores
between 0.1 and 0.2,p-value < 0.001).
A final point of discussion is the treatment of missing data. Students who dropped the course during the semester and did not write the final were omitted; to our knowledge, no student dropped the course because of the technology used in the course. Students were allowed to count only two of the three midterms and have a more heavily weighted final. The midterm grade for any student who chose to only write two midterms was taken to be the average grade on those two tests, ignoring the missed test. Two students in W10 and one student in W11 did not complete any online quizzes, these students were omitted from the models including the average attempts per quiz. Finally, only students who took Math*1200 in the fall semester previous to the semester in question were included in any models using the fall grade as an explanatory variable; as mentioned before in both semesters discussed, approximately 88% of the class completed Math*1200 in the previous fall semester.
We have seen evidence of a significant and positive relationship between the use of online Maple T.A. quizzes and student performance. We observed even after account-ing for in course mastery of the material and previous mathematical preparedness that students who complete more of the online quizzes tend to perform better on the final exam. We have also seen a positive impact of taking a fewer number of attempts to achieve the same score on the online quizzes. We found that although performance on T.A. is related to performance on the final exam, it is not as strong of an indicator as midterm grades or grades from the previous course. Finally we found students who
attempted quizzes before the due date performed better on the exam.
We have also seen that student attitude towards the technology is positive, with most students believing that the quizzes help them learn. We see that although the quizzes are intended to be a formative assessment, it is important that there is a small grade attached to each quiz to motivate students to complete them.
The take-home message of this analysis is that students who use the online quizzes the way they are intended (i.e., start quizzes early, reduce the number of attempts required per quiz, complete each weekly quiz) tend to perform better on the final exam.
Chapter 4
Presentation of Material Developed for First-Year
Calculus Topics
This chapter presents interactive class notes and various demonstrations designed for use in a first-year calculus course. For more in-depth information on the topics, see Stewart [24]. The class materials are all developed in Maple and available on the CD provided. A sample class from the interactive notes is available in Appendix C. Printed code for one demonstration is available in Appendix D.
The interactive notes were developed for a first semester calculus course at the University of Guelph. The notes were designed to be used during 34 one-hour classes. The notes comprised the body of the course manual students were required to pur-chase. The notes were 60-80% complete with the remaining to be filled in by students in class. The notes were fully executable, meaning that every problem could be an-swered using the software. This could be used by the instructor as an opportunity to discuss why the answer found on paper may differ from the answer given by the
software, and why both are correct. The instructor may also change the information within a question and display to the class how the answer is affected instantaneously. The notes also included commands that would display plots or animations of the func-tions being used in class. The students were given the option to download these files and use them to explore the examples outside of class time. These notes were first implemented in the Fall 2010 semester, in a class of approximately 600 students. The remainder of this chapter is dedicated to the presentation of computer demonstrations designed for a first-year calculus class.
During the design phase of the demonstrations, two requirements were kept in mind. The first was that the tools should give a geometric representation of each topic to allow students a better understanding of the material and the second was that the programs must be easy to use. If the second goal is not met, students may be intimidated by the program and this would discourage them from exploring the examples on their own. Each topic covered by the demonstration will be introduced, followed by a description of the tool and finally a discussion on how this may be adapted to teach in and out of the classroom. It is important to note that the discussions in this chapter only give some suggestions on the use of these programs and that if instructors choose to utilize these tools, they will likely find other uses that better fit their own teaching style and course to maximize the potential benefit. This chapter will give insight into the uses and benefits of computer-aided instruction (CAI) in a mathematics classroom.
4.1
The Formal Definition of a Limit
4.1.1
Description of the Lesson
The formal mathematical definition of a limit is typically presented after students have experience calculating limits. This topic is notoriously difficult for first-year students to grasp. There are two common issues that lead to trouble understanding this topic. The first is the fact that there are various forms of the definition depending on if the point of interest is finite or whether the limiting value tends to infinity. The second is that the definitions are dense with mathematical notation making it difficult to find a geometric understanding. We now introduce some of these limit definitions.
Definition 4.1 Assume that f(x) is