How Useful is Computer Graphics for Medical Diagnoses?
G. Domik1, S. Arens1, I. Scharlau2, F. Hilkenmeier2 1
Computer Graphics, Visualization, Image Processing 2 Cognitive Psychology University of Paderborn Warburgerstrasse 100 33095 Paderborn, Germany [email protected]
Abstract: Proving the “usefulness” of visual (graphical) representations for medical diagnoses is challenging due to the medical, perceptual and graphical knowledge involved in undergoing such an evaluation. We are approaching the evaluation by first deriving essential low-level tasks from the medical-cognitive high-level tasks of diagnoses. We then employ controlled user studies to test low-level tasks with two different shading styles used in volume rendering of CT data of coronary arteries.
1 The need for “Usefulness” in Medical Diagnoses
In the Panel “From Data to Diagnosis” [SG10] at SIGGRAPH 2010, panellist Cindy Grimm challenged participants and co-speakers by asking to prove the usefulness of their graphics products for medical diagnosis. She is right in her claim that usefulness of graphics algorithms for a specific diagnosis is hardly ever seriously challenged. For medical and other applications, there is a lack of evaluation of usefulness of processes and tools beyond efficiency and usability. Often the reason for using 3d algorithms over a 2d presentation or vice versa seems to stem from the appropriateness as individually seen by doctors and medical staff in charge. But because the visual interpretation of medical images is often crucial to a patient’s life, moving from 2d images as a basis for making decisions on a patient’s life to 3d images (where rendering algorithms manipulate data in several ways) has to be well controlled and understood.
In this paper we summarize state-of-the-art research on the evaluation of images for medical diagnoses and present a formal study to judge the benefit of using a style transfer function over simple Phong shading in a volume rendering algorithm for medical diagnoses.
2 State-of-the Art in Defining “Usefulness” of Computer Graphics in
Medical Diagnoses
“Usefulness” of visual representations in the context of a specific application (e.g. for medical diagnosis) can be looked at from different angles. It has been investigated by Human Computer Interaction (HCI) and visualization experts, by psychologists and, in the focus on medical diagnosis, also by physicians.
HCI experts provide the knowledge of controlled experiments, observations, and questionnaires to determine how useful a tool is for a specific task. Recommended reading is e.g. of workshop papers of the BELIV Workshop at CHI 2008 [BE08], [Pl10], or [FJ10]. In some of these papers we find “usefulness” determined by “usability”, discussing the handling of technology rather than the interpretation of graphics. Others define heuristics to guide the evaluation process, or extend usability studies and controlled experiments to develop repositories of data and tasks or gather case studies to observe the user over a longer period of time and derive solutions from these observations.
The visualization community is influenced by the early definition of expressiveness and
effectiveness by J. Mackinlay [Ma86] in order to judge the quality of visual representations for a specific visualization goal. For Mackinlay, one visual representation is more effective than another, if it leads to a faster and more accurate interpretation of the visualization goal. This relates well to our term “usefulness”, however, finding an effective visualization is often guided by an individual’s aesthetic sense rather than by methodical progress. Rarely has the visualization community proved for a specific visual representation to be truly effective for a specific goal.
In [PW11] a new approach is taken to optimize visualizations for a specific task using a computational model of perception. One of the down-sides to this approach – if this would be seen as one – is that the break-down of cognitive, complex tasks into low-level visual tasks that can be investigated needs psychological knowledge and can not be automated. The approach taken here is very promising, however, not much experience is known yet for its use with practical tasks.
A different approach is taken by the Medical Image Perception Society [http://www.mips.ws/] that seeks “an improved understanding of the perceptual factors that underlie the creation and interpretation of medical images”. In [Kr10] the author describes the diagnostic process involving two basic processes: visually inspecting the image and rendering an interpretation. In her research she furthers the understanding of visual perception by studying the underlying processes, search patterns, or perception errors specifically for 2d medical images. Three-dimensional graphics, e.g. volume rendering of medical data, has not been a focus yet.
Finally, there is research by computer scientists (often in joint efforts with physicians) to evaluate the perception of specific medical tasks, e.g. [SD05], where Santos and Dillenseger derive general frameworks to investigate effectiveness of medical visualizations. Some groups, e.g. the VIS group at the University of Magdeburg, Germany, work on perceptual evaluation of medical volume graphics, but publications are still to be awaited.
Our own past research [e.g. VDS+97] on perception focused on evaluation of 3d graphics for chemical tasks and for city navigation. In one controlled user study we explored the effectiveness of stereo displays for chemical visualizations; in another one we investigated navigation behaviour of children versus adults inside virtual worlds. Our approach was to focus on narrow visual tasks that could be evaluated quantitatively and unambiguously.
In this paper we offer a methodical and a practical approach to evaluate “usefulness” of computer graphics for medical diagnoses. In our methodical approach we measure “effectiveness” as defined by [Ma8] rather than usability, and we break down complex medical tasks into perceptual and medical knowledge-based tasks and further derive simple visual tasks from the perceptual tasks. Our practical approach is then to measure performance of (unambiguous) visual tasks in a controlled user study varying parameters on the original computer graphics products used for medical diagnoses.
3 An Exemplary User Study on the Usefulness (Effectiveness) of
Shading Techniques for Volumetric CT Data Visualization
We evaluated the usefulness (effectiveness) of a specific style transfer function as compared to simple Phong shading on CT data for medical diagnosis. The method we used for evaluation was a controlled experiment with tasks relating to medical diagnosis of coronary (heart) disease. Medical diagnosis of coronary disease is a high-level cognitive task that relies on medical knowledge, available medical data of the patient, and experience of the physician. This high-level task can roughly be divided into perceptual aspects relating for instance to the visibility of crucial features and medical knowledge-based parts such as judgment. Supposedly, the effects of the presentation format on perceptual and knowledge-based processes can be separated and studied independently. In the present study, we aimed at developing visual low-level tasks that are crucial in performing the high-level task [PW11]. Because we derive the visual low-level task as a sub-task to the high-low-level task, any errors or optimizations in performing the low-level visual tasks would change the performance (in a negative or positive way, respectively) on the high-level task, namely the diagnosis. We have chosen low-level tasks such as distinguishing structures or ranking curvature of arteries in CT volume data. We are currently only testing tasks that relate to the perceptual (visual) and not knowledge-based processes in order to gain the further advantage of allowing for controlled experiments with numerous users, not necessarily medical staff.
In order to compare the usefulness of a style transfer function to Phong shading, we implemented the style transfer functions of [BG07] (named “Style shading technique” from here on) and compared their effectiveness for specific visual tasks with the Phong shaded volumes. For this study, we reduced our question on the usefulness of computer graphics for medical diagnoses to one visualization technique (GPU raycasting of medical CT volume data) with two different shading techniques (Phong versus Style) and two different stimulus durations (very short and short) to perform the visual tasks. Therefore our independent variables in the following test were the shading technique
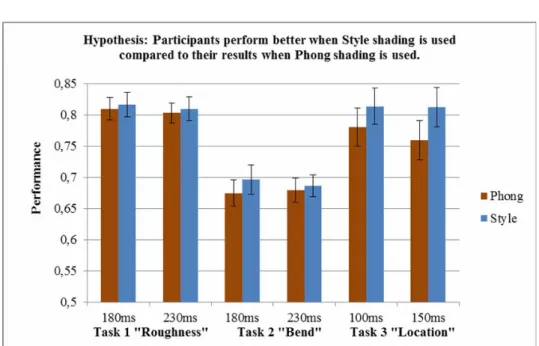
and the stimulus duration, our dependent variable was the accuracy of answers to the designed tasks. We tested the general hypothesis “Users perform better on visual tasks when the Style shading technique is used as compared to simple Phong shading”. In [DSA+11] we reported already on the first part of the same study, however, this report is on a different group of students and includes design changes from the first study. However, data, shading techniques, and task 1 and 2 are comparable to the first study.
3.1 Design of the Controlled Experiment
Thirty-three students of computer science participated in this study to perform visual tasks on volume rendered medical data. The study was to support the choice of shading technique for medical volume rendering of CT data in order to find optimal parameters for detecting plaques in coronary arteries and preparing surgery based on the localization of plaque (high-level task). Detecting plaque in coronary arteries from rendered CT volume data requires detecting coronaries in a noisy image, judging the shape of the arteries for signs of plaque, or recognizing borders and branches of coronaries. To each of these judgments performed by a medical doctor we developed a simpler visual task. This visual task related to the overall performance of the medical tasks in a relevant manner: good or bad performance, respectively, on the visual task would result in good or bad performance, respectively, on the high-level cognitive task. A consequence of this study design was that medical knowledge was not required for our study, allowing us to test computer science students within one course. Such a cohort offers us homogeneity in age (first graduate year), computer graphics knowledge (knowledge of advanced rendering) and medical knowledge (close to none).
Each task is connected to a question that can be answered by either pressing the right or left arrow keys. For task 1 and 2 this indicates the ‘left’ or ‘right’ image, for task 3 this indicates ‘yes’ or ‘no’. Every task was preceded by four training images that were not taken into account for the statistical analysis. Each task was performed 40 times with very short stimulus duration and 40 times with short stimulus duration.
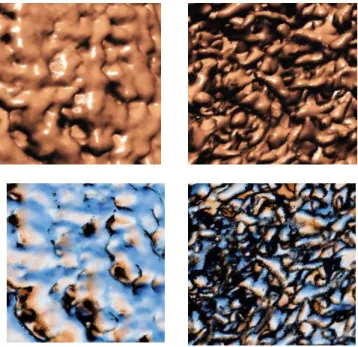
In the first task, participants had to decide which picture in a pair appears rougher in its texture (Figure 1). Pairs either with the shading technique by Phong or Style shading were used. Each user judged 80 pairs, where the appearance of Phong or Style pairs was random. There was no mixture of shading techniques, either a Phong shaded pair or a Style shaded pair was shown. The user had to indicate with a mouse click, if s/he felt that the left or right image was rougher in its texture. Instead of measuring the time required to solve each task for each user, we measured the ability to solve the task under two different stimulus durations: 180ms and 230 ms, respectively.
Figure 1: Visual Task 1 is “Which of the two surfaces (“left” or “right”) is rougher?” Above is a pair of medical visualizations using the shading technique by Phong, below is a pair using a Style shading technique in a volume ray casting algorithm.
In medical terms, the roughness task evaluates the participant’s ability to perceive the structure of surfaces which is required to identify objects and noise in data sets.
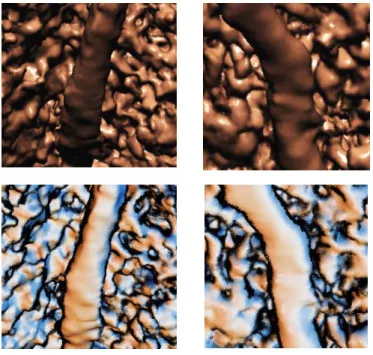
In the second task, participants had to decide which picture in a pair contains the artery that is bent stronger (Figure 2). Again, pairs with Phong or Style shading were used; there was no mix of rendering modes within a pair. The duration allowed to look at images was preset again to 180ms and 230ms, respectively. Each user judged 80 pairs, where the appearance of pairs with Phong or Style shading was random.
The medical relevant task here is that the curvature of an artery is an indirect indicator for plaque inside the artery.
In the third task (Figure 3), participants had to decide if a crosshair is on top of the artery
or not. Because “artery” is a medical term, we helped identify the artery by first showing the centreline and crosshair on a black background and then the image with the artery and the crosshair. This reduced the cognitive load of this task. Each user had to solve 80 such pairs (centreline and visualization) within 100ms (short duration) or 150ms (longer duration).
The medical relevance here is that doctors locate boundaries of arteries to find anomalies (e.g. stenoses).
Figure 2: Visual Task 2 is “Which artery (“left” or “right”) bent stronger?” Above is a pair with Phong shading, below is a pair using Style shading.
Figure 3: Visual Task 3 is “Is the crosshair on top of the artery?” Two images are shown successively: First left image (0.8 seconds) to indicate which artery is meant and to already locate the crosshair. Afterwards, the Style or the Phong shading technique (middle and right, resp.) is shown at the same location on screen.
3.2 Results
33 students were tested by a within-subject design. Performance (percentage of correct answers) was tested statistically against chance level (guessing) via a t-test. Performance of factors shading technique (Style or Phong) and stimulus duration (180ms vs. 230ms for tasks 1 and 2 and 100ms vs. 150 ms for task 3) were compared via two-way repeated measures ANOVA.
In all three tasks (with both simulation durations) we received meaningful and not random answers. Also in all three tasks, Style shading technique showed a better performance than Phong shading. But only for task 3 the performance was significantly better, indicating that participants had less difficulties identifying whether the crosshair is on top of the artery, when the images were rendered with the style shading technique. The main effect of the stimulus duration as well as the interaction between the two factors were non-significant for all tasks. Table 1 and Figure 4 show the participants’ performances in more detail.
Task Short SD, Phong. Mean Per- formance (± 1SE) Long SD, Phong. Mean Per- formance (± 1SE) Short SD, Style. Mean Per- formance (± 1SE) Long SD Style. Mean Per- formance (± 1SE) Signifi- cance. (level 0.05)
Task1 0.810 (0.018) 0.803 (0.016) 0.816 (0.019) 0.809 (0.019) No sign. diff. Task 2 0.675 (0.021) 0.679 (0.019) 0.696 (0.023) 0.686 (0.017) No sign. diff. Task 3 0.780 (0.030) 0.759 (0.031) 0.814 (0.029) 0.812 (0.031) Yes, Style
better than Phong.
Table 1: Quantitative results from statistical analyses: Performance was measured as percentage of correct answers (normalized to [0, 1]). SD=stimulation duration; SE=Standard Error.
An interesting result here is that task1 (“roughness”) had produced a significant result in the controlled experiment with another group of students as reported in [DSA+11], showing a significant 4% of performance gain for Style shading over Phong shading. The difference between these studies was a slight improvement of Phong shaded images in this study, and thus most probably explaining the small difference in results.
Figure 4: Although the style based visualization reveals a better performance in all three tasks with both time durations, only in task 3 we could proof the hypotheses with a significant result. The error indicators show the standard error (±1) of each test.
4 Conclusion
In this paper we first looked at the different approaches that can be used to understand the “usefulness” of computer graphics for medical diagnoses. Even when using appropriate methods to understand the “usefulness” of visualizations (termed “effectiveness” in the visualization community), there is still the problem of breaking high-level cognitive tasks of physicians down to atomic tasks that can be tested unambiguously. We investigated an approach by deriving simple visual tasks from specific high-level medical tasks to diagnose coronary heart disease from CT volume rendered images. We tested students on two different shading techniques: the well known Phong shading and a style transfer function that emphasized edges in the data. While users improved in the tasks from Phong to style based shading (judged by the mean error rate), only one task (Task 3) showed significant improvement.
Acknowledgement
The authors are grateful to Felix Steffen, M.Sc., and Radoslaw Major for their help in design, conducting, and analysis of the controlled user study. We thank Professor Wolfgang Burchert and his team at the Heart- and Diabetes Centre North-Rhine Westphalia for the corporation with us on medical data analysis. And last but not least thanks to the students participating in this study.
References
[BE08] BEyond time and errors: novel evaLuation methods for Information Visualization, A workshop of the ACM CHI 2008 Conference, workshop papers at
http://www.dis.uniroma1.it/beliv08/
[BG07] Bruckner, S.; Groeller, M. E.: Style transfer functions for illustrative volume rendering. Comput. Graph. Forum 26, 3, 2007. pp. 715–724.
[DSA+11] Domik, G.; Steffen, F.; Arens, S.; Scharlau, I: Usefulness of Style Transfer Functions in Medical Diagnosis, SIGGRAPH 2011, Poster Paper, Vancouver, 7-11 Aug. 2011. [FJ10] Forsell, C.; Johansson, J.: An Heuristic Set for Evaluation in Information Visualization. In
AVI 10 (Proceedings of the working conference on Advanced Visual Interfaces 2010), pp. 199-206. ACM, New York, 2004. ISBN: 1-4503-0076-6
[Kr10] Krupinski, E.A. : Current perspectives in medical image perception. Attention, Perception, & Psychophysics, Volume 72, Number 5, pp. 1205-1217.
[Ma86] Mackinlay, J.: Automating the design of graphical presentationis of relatoinal information, ACM Transactions on Graphics, Vol. 5, Issue 2, April 1986, pp.110-114.
[Pl10] Plaisant, C.: The Challenge of Information Visualization Evaluation, In AVI 04
(Proceedings of the working conference on Advanced Visual Iinterfaces 2004), pp. 109-116. ACM, New York, 2004. ISBN: 1-58113-867-9
[PW11] Pineo, D.; Ware, C.: Data Visualization Optimization via. Computational Modeling of Perception, IEEE Transactions on Visualization and Computer Graphics, Mar. 2011. IEEE computer Society Digital Library. IEEE Computer Society.
[SD05] Santos, B.S.; Dillenseger, J.: Quality Evaluation in Medical Visualization: some issues and a taxonomy of methods, in Medical Imaging 2005: Visualization, Image-Guided Procedures, and Display, Proc. of SPIE Vol. 5744
[SG10] SIGGRAPH 2010 Panel “From Data to Diagnosis: The Intersection of Biomedical Applications and Computer Graphics”, 25-29 July, 2010.
[VDS+97] Volbracht, S.; Domik, G.; Shahrbabaki, K.; Fels, G.: How Effective are 3D Display Modes? Proceedings of CHI 1997, pp. 540 - 541, Atlanta, Georgia, USA.
![Table 1: Quantitative results from statistical analyses: Performance was measured as percentage of correct answers (normalized to [0, 1])](https://thumb-us.123doks.com/thumbv2/123dok_us/1027327.2635827/7.892.179.719.505.730/quantitative-results-statistical-analyses-performance-measured-percentage-normalized.webp)