INCREASING RESPONSIBILITY TO CUSTOMERS
THROUGH A DYNAMIC QUALITY ASSURANCE SYSTEM
IN SOFTWARE DEVELOPMENT
Cătălin Afrăsinei-Zevoianu1* and Ramona Lacurezeanu2
1) 2)Babeş-Bolyai University of Cluj-Napoca, Romania
Abstract
The information explosion has led inevitably to the need to design and implement software solutions to the new information environments faced by any person, group, company, and nation. Measuring software product quality has been neglected for a long time but now both producers and researchers recognize the importance of field testing and assessment software. In this context, the aim of the article is to propose, validate and demonstrate the importance of using dynamic indicators of software quality measurement that reflect the implications that quality has in the emergence of gaps in each stage of the process leading to the achievement of application software. Method proposed is part of applied researches field having the purpose of being a specific instrument for the domain studied and it is intended to become the means by which the required effectiveness for the assumed objectives is reached: increasing responsibility to customers through quality improvement. Moreover, by applying measures to improve product quality, any company signs up in the current trend of increasing responsibility to the client which, in its turn, is an important component of CSR.
Keywords: software development life cycle, software quality assurance (SQA), corporate social responsibility (CSR), quality metrics, software quality management
JEL Classification: O320
Introduction
The intensive development of the software domain, with more and more diverse and far-reaching implications for the field of technical applications, science and technology and for all human and social activities, requires software systems to be considered as conceptual intangible products which ensure the survival and the continual development of the companies that design and implement them (Armas, 2006).
The multitude of computer applications aims mainly at three aspects: the growing number of users of the same software, the quality of the results obtained from data processing, data quality in e-business, e-commerce, Web streams or flows (Ivan and others, 2000). Our paper starts from the assertions that "software production and delivery of related information depends largely on how intellectual effort is managed" and "no nation can afford to have a software industry which produces anything but quality software". (Balog and Olaru, 1997).
Conclusion that was drawn based on the researches did in the field of social responsibility have directed us to the idea developed in (Toma, 2008): “codes of corporate governance of the modern companies admit that the success in business, growth on both shareholders’ profits and employees’ welfare, development of communities and interests of the other stakeholders are all of them interrelated elements”.
Without claiming to be exhaustive and incontestable, the paper is trying to define and clarify the concept of software quality assurance as a factor of ensuring responsibility to clients, as a component of social responsibility.
1.Measuring software quality and increasing responsibility to clients
In globalization era, companies have become much complex regarding the structure and geographical region, they have to cope with bigger and bigger volumes of data, with stronger and stronger competition especially in crisis times and all of these make the use of IT, generally, and ERP, SCM, CRM and BI software particularly, a real and strategic competitive advantage. Nowadays, more than ever, the multitude categories of software and its diversity have imposed the necessity of having a standardized system of software quality assurance (Dumitru, 2011; Dumitru and Florescu, 2009).
Over time there have been different scales for grading the software lifecycle. Of all existing ones, we selected the following for the current theme: analysis of customer needs, design and programming of requirements, implementation and testing of the product, ensuring its maintenance (Ostafi, 2009; Cavano and McCall, 1978).
The quality of a software product means the “ability to be used effectively, efficiently and comfortably by a set of users, for a set of goals, in specified conditions”. Regarding the quality of software, some of the researchers promoted the idea that there is no clear and complete theoretical background; there is subjectivity; there is agreement on some important factors, but there is no precise and complete definition of quality factors (Gordon, 2006). "Customers buy software or accept it as long as: - it helps them in solving problems; - it helps them to identify opportunities to improve their activities; - it provides them with a good image on the market and to their most significant clients; - it eases their work and contributes to improving its comfort". (cf. Ivan and others, 1999). In the literature of software-engineering, some researchers estimated that problems arise from incompletely defined requirements, ambiguous modelling (design) and programming errors. Quality is always relative and is based on predetermined requirements. These predetermined requirements are, certainly, very closely related to the person who defines them. People having different backgrounds but involved in the same software development process have different ideas about quality. The vast majority of IT professionals (Cretu and Gramada, 2007) have defined four categories of people involved
in IT, having different opinions about the quality of software: users, managers, designers and programmers. In this paper we are approaching the quality indicators in software development from the perspective of the user, the client who has expertise in using at least one of the five currently acknowledged types of software (operating systems and system software, real-time software - restrictions response time, software systems - databases, scientific software, software-including elevators, telephones, household appliances) for a period of at least five years, and who has experienced various errors. Kevitt (2008) considers that “the cost of software problems or errors is a significant problem to global industry, not only to the producers of the software but also to their customers and end users of the software”.
In the last decades, corporate social responsibility has been considered an intelligent investment which stimulates companies to improve relations with the community (customers, suppliers, authorities) (Gray, 2007). Since 2011 the European Commission has issued new corporate social responsibility policies (2011-2014) according to which “businesses need to build processes to integrate human rights, social, environmental and ethical aspects into business operations and strategy in close collaboration with “stakeholders” (Stroe, 2012). Stakeholders could be vendors, customers, banks, suppliers, managers, employees, the local government, SME organizations and Chambers of Commerce, the local community. Like many other things that appeared in Romania after 1990, CSR, first emerged as philanthropy and only later as economic responsibility, social and environmental (Elkington, 1997). The economic aspects target the subject discussed in the paper, i.e. software quality management.
In this context, the question arises: why do we need indicators of quality assurance in software development? The answer shall cover at least three aspects: we witness today an unparalleled development and use of software, with no precedent in the history of IT & C; the need for quality in the new era of CSR 2.0 has a primary focus; and current programming techniques are not able to create a software application free of flaws (errors, inconsistencies).
2.A dynamic model of measuring quality in software development
Quality improvement implies an increase in quality in every process which belongs to an activity as a whole. Each process could be assessed from the perspective of quality if the corresponding quality factors are identified. In software companies there are several processes, each of them more or less complex and having a certain contribution to the general quality level of the organization.
The basic activity in a software company is the development of software which is subsequently to be sold and installed to clients. Quite often, this activity has a post-sales extension through customer service and the maintenance process which ensures the proper operation of the installed applications.
The process of software development is a complex one, consisting of at least three phases (analysis, design and testing), and the human factor is essential in each of them.
The analysis phase is performed together with representatives of the actual or potential customer. The purpose is to clearly identify the requirements and expectations of the
client regarding the perfection or automation of his/her own activity with the help of the software application. Subsequently, these requirements are transformed into clear functionalities that the applications will have internally so as to reach the desired utility. This phase has an important influence on the performance of the other phases of the process. The quality of this phase will be ascertained later, once the application software has been produced and can be functionally checked first by the testing team, and then by the customer, immediately after its implementation. Therefore, we state that the impact of a misunderstanding or mistake in this phase is critical. Correction of such mistakes involves returns and delays in the whole process because it may be necessary to reanalyze, redesign and retest what has been corrected. The more such inconsistencies are discovered, the longer the completion time of the software is and the higher the associated costs are.
The factors which may influence quality in this phase could be:
Duration of the analysis phase (Danalysis). It is required to be as short as possible but with no errors, omissions or inconsistencies.
Number of inconsistencies caused by misunderstandings of the analyzed aspects (Nerr-analysis). These errors depend on the software complexity and on the analysts’ professionalism and experience (both from the provider’s and the client’s perspective).
Additional time to re-analyze (Δtreanalysis) - as short as possible;
Additional time to fix the analysis errors by reprogramming (Δterr-analysis) - as short as possible;
Additional costs determined by fixing the analysis errors (ΔCerr-analysis) - as low as possible.
Considering these factors, we can create indicators which contribute to the efficiency estimation of quality improvement measures if they are analyzed before and after those measures are applied:
Weight of analysis phase in total duration of software development:
100
t analysis analysis DD
D
P
[a-1]A high weight of analysis duration in the total duration of software development is not always a negative aspect. Analysis time depends on how complex the requirements and functionalities of the software are. Planning of analysis duration is done by the management of the project and it is performed under the supervision of a designated project manager.
Weight of analysis errors in the total number of errors discovered during the whole process of software development. It is worth mentioning that the errors (inconsistencies) might be divided into two categories: analysis errors and programming or design errors.
100
total err analysis err analysis err NN
N
P
[a-2]Danalysis – duration of analysis phase; Dt – total duration of software development
Nerr-analysis – number of analyses errors; Nerr-total – number of total errors
Weight of time for reanalyzing errors of high severity:
100
t reanalysis reanalysis dD
t
P
[a-3]If we also consider the additional time spent on fixing the analysis errors through redesign (Δterr_analysis), then:
100
'
t analysis err reanalysis reanalysis dD
t
t
P
[a-4]Additionally, it is important to observe the growth of the total duration due to analysis errors:
100
'
(%)
t analysis err reanalysis a tD
t
t
D
[a-5]Weight of additional costs generated by analysis errors in the total costs of software development:
100
T analysis err CC
C
P
[a-6]Development costs consist of 3 cost categories, related to the phases of the whole process: analysis costs, design (programming) costs and testing costs.
Additional costs of fixing errors occur because of the prolongation of the process phases. Similarly, we can calculate how much the additional cost of analysis represents in the total costs initially planned(C’T):
100
'
(%)
_
T analysis err a TC
C
C
[a-7]If the variation of additional costs of analysis is positively high or has an increasing trend, then this situation indicates possible quality problems with analysis performance.
During the design (programming) phase, the „production” of the software application takes place. Based on the analysis document (which comes from the analysis phase), a document of database design is firstly written and programming (design) activity occurs afterwards.
Programming or design is performed by software designers (programmers). The design languages and environments used depend to a great extent on the specific characteristics of the software which is to be developed as well as on other aspects.
Δtreanalysis – additional time for reanalysis;
D’t – planned duration for software development, excluding extra time
CT – total cost of software development (including additional costs); ΔCerr-analysis – additional cost generated by analysis errors
The design logic, which has to be as coherent and simple as possible and comprehensive too, influences greatly the quality of the design, which is dependent on the quality of the human resource.
There are quality factors which are specific of the design phase. Their expression through quantifiable indicators is not an easy task and very frequently it is incomplete. However, we suggest a set of indicators which reflects, partially, the quality of the activities performed in the design phase:
Duration of design phase (Ddesign). It is desirable to have this duration as short as possible but with as few as possible gaps, omissions and errors.
Number of design errors generated by an incomplete design document, misunderstandings based on it or even errors caused by programmers’ mistakes, generically called programming or design errors (Nerr-design).
Additional time spent on total or partial re-design (Δtredesign). However, redesign is not always needed, except for the cases when the errors discovered require it;
Additional time spent on fixing design errors (Δterr-design); Additional total costs determined by design errors (ΔCerr-design).
By analogy with the indicators proposed in the analysis phase, we continue here with a new set of indicators which could report quality problems, especially when they are dynamically analyzed:
Weight of design duration in the total duration of software development:
100
t design design DD
D
P
[p-1]However, a big weight of the design duration in the total duration of software development is not always a negative aspect. Nevertheless, the time for design could be decreased as a consequence of quality improvement and by enhancing responsibility for one’s own work and to the clients that the company has, which means:
-Fewer design errors determine shorter redesign time;
-Better trained and motivated personnel generate promptness and accuracy of work;
-Better organisation of the design team: balance of tasks allocation, high performance project management etc.;
-Use of up-to-date hardware and software supporting prerequisites.
Weight of design errors in total number of errors. In addition to the analysis errors, errors in design appear as a result of mistakes in the designing phase.
100
total err design err design err NN
N
P
[p-2]Weight of reopened errors in the total design errors. This indicator refers to the situations when errors initially identified have not been fixed after the first attempt and they have been reopened by a testing representative for further remedy. Of course, the error-tracking system should be capable to record such cases. Reopening actions indicate a low quality and efficiency of the design team in solving identified problems.
Ddesign – design duration; Dt – total duration of software development
Nerr-design – number of design errors; Nerr-total – total number of errors
100
design err reopened err reopened err NN
N
P
[p-3]Weight of time for software redesign, in consequence of analysis errors propagated to the design phase or due to errors of initial software design. Severe errors determine such major changes. These situations have to be avoided because they may have extremely unpleasant consequences, especially when they are discovered too late in the development process or even worse, during the use of the software by the client.
100
t redesign redesign dD
t
P
[p-4]By analogy with the analysis phase, if we add the additional time spent on fixing the initial design errors (Δterr-design), we have:
100
'
t design err redesign redesign dD
t
t
P
[p-5]Moreover, we can calculate the increase in the total duration of software development due to design errors:
100
'
(%)
t design err redesign d tD
t
t
D
[p-6]If we consider the additional times from the analysis phase, then:
100
'
(%)
,
t design err analysis err redesign reanalysis d a tD
t
t
t
t
D
The result shows the growth of the total duration of software development determined by the errors (inconsistencies) from the analysis and design phases.
Weight of additional costs caused by design errors in the total cost of software development:
100
T design err CC
C
P
[p-7]Additionally, it is important to calculate the increase in the total costs of software development due to design errors:
100
'
(%)
T design err d TC
C
C
[p-8]Nerr-reopened – number of design errors reopened at least once
Δtredesign – time spent on redesign
D’t – planned duration of software development (no extra times)
CT – total costs of software development (including additional costs); ΔCerr-design – additional design costs
If we consider both the analysis and the design phases, it follows that:
100
'
(%)
,
T design err analysis err d a TC
C
C
C
[p-9]This last indicator points out the surplus of expenses generated by the errors (inconsistencies) which occur in the analysis and the design phases of the whole software development process.
The testing phase marks the moment when the design phase of the software application is completed and the application is verified in terms of conformity with the initial specifications. It has the role of measuring the quality level of what has been done. During this phase errors or inconsistencies from the first two phases of the process are discovered (analysis and design errors). Such errors may have different causes: incomplete analysis specifications, misunderstandings about functional specifications, wrong interpretations of the database document, poor design due to lack of experience, attention etc.
It is important that the errors be categorized according to the gravity of the implications they have. Based on the observations we have made on software companies, it is a practice to classify the errors into the following types: blocking error (impossibility to use the software application), critical error (functional anomalies which partially obstruct the normal operation of the software), basic error withdifferent priorities (the anomaly can be avoided by following another sequence of operations which generates a correct result), and enhancement (has a positive impact on the ease of use, ergonomics of the software, various optimizations).
Remedial action with regard to the identified problems is taken considering the gravity (severity) of the error. Enhancements come to meet the potential needs of the clients. They generate the expected leap on the satisfaction level and a greater responsibility to the clients.
The testing phase reduces the number of errors which, otherwise, would inconvenience the client. The effectiveness of this phase can be actually measured considering the number of errors discovered after the software has been installed at the client. It is also conditioned by other aspects such as: management of the test team, the way in which tasks are assigned, experience, knowledge and skills of those who do the testing, level of awareness of the importance of their job, the testing manner etc.
By making efforts to identify the quality factors of this phase, we have come to the conclusion that some of them just apparently belong to this phase, and they actually depend on the evolution and quality of the previous phases. Therefore:
The number of errors discovered is not always a reliable measure when testing performance; it is only partially relevant as some errors are the result of other causes: inconsistencies of both the analysis and the design phases, the complexity of the software which could generate a bigger or smaller number of errors.
The time for testing (Dtest), is again a factor with multiple causes. Virtually, an increase in the testing time should lead to the identification of a bigger number of errors and to higher quality of the software at the same time. The time spent on testing cannot be
a performance and quality factor in itself in this phase but its dynamic evolution could indicate a better or worse condition of this factor:
100
t test test DD
D
P
[t-1]The cost of testing(Ctest) is again a factor which cannot be satisfactorily explained from a qualitative point of view. For instance, a high level of the testing cost could be the result of poor quality originating in the previous phases.
The factors mentioned above cannot be absolute factors of quality for the testing phase, but in special circumstances they might become important, or be ignored or regarded as the consequence of poor quality of other phases.
There is one factor which always remains valid and is truly a measure of quality of the testing phase: the number of errors discovered by clients during software utilization (Nerr_undiscovered), i.e. undiscovered on time by the testing team. The efficiency indicator in this case shows the weight of undiscovered errors in the total number of errors:
100
total err ed undiscover err ed undiscover err NN
N
P
[t-2]Another way to characterize the quality of the testing work team and its responsibility regarding the results achieved would be to track the frequency of the situations when false errors are invalidated (Nerr_invalid). In such cases the reported error is invalidated. Quantification is possible as follows:
100
total err invalid err invalid err NN
N
P
[t-3]A relatively high weight or an increasing evolution means a low quality level of the testing phase.
Analysis can be deepened if we consider the errors classified by severity, as previously described.
Therefore, the errors can be structured by types and weights are calculated for each type separately:
100
_
total err blocking err blocking err NN
N
P
[t-4]This calculation formula is an example of the “blocking error” type (Nerr_blocking), and the weight is calculated in total errors recorded. The formula can be replicated for the other error types. If the weight of the first two error types is significant or increasing in time, the causes need to be found and eliminated. Theoretically at least, a decrease in the weight of errors with high level of gravity could be the consequence of quality improvement in the process of software development.
Dtest – duration of testing; Dt – total duration of software development
Nerr-total – total number of errors discovered (before and after software installation)
The productivity of the testing phase can be measured through the number of errors discovered per time unit:
test total err test
D
N
W
[t-5]Results in a dynamic approach for this indicator could be delusive. Thus, a small value for this indicator does not mean that the testing work has been of low quality and performance, but could perfectly indicate a good quality of work in the design phase and consequently the testing phase cannot provide many errors, no matter how much effort is put into it. Additionally, a decreasing evolution of this indicator does not indicate an underperformance of testing and this is because the software displays more and more the quality requirements under the circumstances of harder and harder effort of discovering inconsistencies.
The indicators proposed above serve to the analysis of the implications that the errors have when they appear in any phase of the process of a software development. Actually, indicators measure the effects of poor quality and demonstrate the responsibility for the final product and to the clients. By applying measures of quality improvement (methods and techniques), the effect is visible when these indicators are recalculated and the results compared with their previous values.
3.Simulated use of the model and interpretation of results
Starting from the set of indicators proposed for each of the phases that make up the process of software development, the model could be practically implemented if an adequate framework is created. Such a model is based on two sets of data: input data and output data (output indicators). Because we are referring to the IT domain, the framework can be easily created. The model can be a software instrument for quality monitoring, an instrument which operates at the same time with the main software development process. It would be able to record input data in an automated or semi-automated regime.
The project manager is the one who uses the instrument as a dashboard to take decisions of correction and quality improvement.
Instrument utilization could be extended even to post-implementation phases, when the software application is running at the client/clients. This approach is evidence of a higher responsibility of the provider to his/her clients. Access to a part of the statistical data of the model can be made available to the client too thus demonstrating transparency and care for the client.
In the following, an exemplification of how the model might be used is illustrated. Numerical data, from a real example of a medium-sized software development project, is going to be used for a better understanding of how the model works.
Input indicators:Members of the team allocated for the software development (table no. 1):
Table no. 1: Team allocated for software development
Position No Euro/month Daily salary cost
Programmer 4 1000 189,75
Tester 3 500 71,16
Project manager 1 1700 80,65
Analyst 2 500 47,44
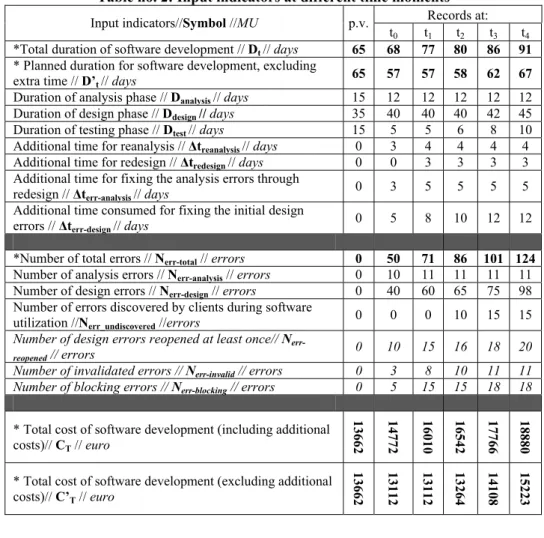
In the next table no. 2 other data is presented, necessary for output indicators calculation. Each line of the table consists of planned values (p.v.) and a series of 5 consecutive records at 5 different time moments (from t0 to t4). The table is organized into 3 groups of indicators: time indicators, errors indicators and cost indicators. The indicators marked with ”*” are calculated as a sum of others from the same group (according to the formulas proposed in the theoretical model).
Table no. 2: Input indicators at different time moments
Records at: Input indicators//Symbol //MU p.v.
t0 t1 t2 t3 t4
*Total duration of software development // Dt // days 65 68 77 80 86 91
*Planned duration for software development, excluding
extra time // D’t // days 65 57 57 58 62 67
Duration of analysis phase // Danalysis // days 15 12 12 12 12 12
Duration of design phase // Ddesign // days 35 40 40 40 42 45
Duration of testing phase // Dtest // days 15 5 5 6 8 10
Additional time for reanalysis // Δtreanalysis // days 0 3 4 4 4 4
Additional time for redesign // Δtredesign // days 0 0 3 3 3 3
Additional time for fixing the analysis errors through
redesign // Δterr-analysis // days 0 3 5 5 5 5
Additional time consumed for fixing the initial design
errors // Δterr-design // days 0 5 8 10 12 12
*Number of total errors // Nerr-total// errors 0 50 71 86 101 124
Number of analysis errors // Nerr-analysis // errors 0 10 11 11 11 11
Number of design errors // Nerr-design // errors 0 40 60 65 75 98
Number of errors discovered by clients during software
utilization //Nerr_undiscovered //errors 0 0 0 10 15 15
Number of design errors reopened at least once// N
err-reopened // errors 0 10 15 16 18 20
Number of invalidated errors // Nerr-invalid // errors 0 3 8 10 11 11 Number of blocking errors // Nerr-blocking // errors 0 5 15 15 18 18 *Total cost of software development (including additional
costs)// CT // euro
13662 14772 16010 16542 17766 18880
* Total cost of software development (excluding additional costs)// C’T // euro
Records at: Input indicators//Symbol //MU p.v.
t0 t1 t2 t3 t4
Cost of analysis phase // Canalysis // euro
1921 1537 1537 1537 1537 1537
Costs of design phase // Cdesign // euro
9464 10816 10816 10816 11357 12168
Cost of testing phase // Ctest // euro
2277 759 759 911 1214 1518
Additional cost generated by analysis errors // ΔCerr_analysis
// euro 0
712 1139 1139 1139 1139
Additional cost generated by design errors // ΔCerr_design //
euro 0
949 1760 2139 2519 2519
A dynamic tracking of quality indicators involves a continuous recording of input data. The software instrument for quality monitoring could record data automatically. The project manager will generate reports of the output indicators, which can be either summary or detailed reports, and which provide him/her with necessary information. It is desirable that this activity be part of the daily routine of any team manager.
Output indicators
The next tables present the results of output indicators as exposed in the theoretical description of the model, and their interpretation. Based on these results, it is possible to create charts which show the time evolution of the indicators. Additionally, the model may be programmed to warn the user every time some of the indicators have bad dynamic evolutions. Similarly, positive evolutions might be marked out so as to observe the positive effects of the corrective measure formerly taken.
In the next table we highlighted some useful aspects of quality monitoring in regard to the process of software development: calculated indicators (planned and measured values), evolution charts, and special situations bookmarks (favourable – underlined and unfavourable – bolded)
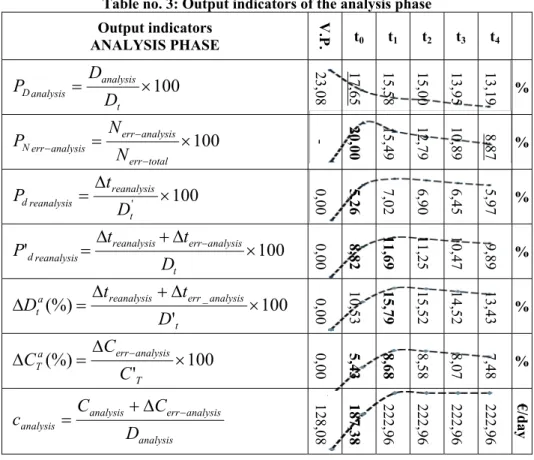
Regarding the analysis phase, table 3 illustrates a few aspects which may influence the normal operation of the whole process, quality assured:
Compared to the planned value, the weight of analysis duration has a decreasing evolution (row 1, table 3). At first sight, this is a positive fact but, unfortunately, this “hurry” to finish quickly the analysis phase has negative effects which will be highlighted later;
A considerably important part of the analysis errors are to be noted; however, in the end the situation will improve due to the fact that the other types of errors are numerically increasing (row 2, table 3);
The increase in the total duration of the software development process due to the errors of this phase is fairly accelerated in the first half of the period and it remains important till the end (approx. 14%). The phenomenon is accentuated in the first part of
the production period because the analysis phase initiates the whole development process (rows 4, 5, table 3);
There is additional time generated by the need to reanalyze some of the functionalities (row 3, table 3). This aspect has negative implications for the whole process. The case has to be carefully approached because the time consumed for reanalyzing generates additional time in the design phase in order to implement the modifications required. Referring to our case, an increase in the total duration by more than 5% (row 3) due to reanalysing generates a propagated effect which means more than 13% of the final increase, i.e. a multiplication effect estimated at more than double (row 5);
The total costs of software development are also influenced by the errors of the analysis phase, and they determine an increase in the total costs of approximately 8% (row 6). It Is to be noted that the problems from the analysis phase negatively affect the duration of the development process to a greater extent than the costs of the process;
Finally, there is a significant increase in analysis costs (€/day), from 128 to 223, which indicates that quality problems in this phase make it more expensive than expected. It is therefore a serious alarm signal for the project management and it requires quick remedial measures.
Table no. 3: Output indicators of the analysis phase Output indicators ANALYSIS PHASE V.P . t0 t1 t2 t3 t4
100
t analysis analysis DD
D
P
23,0 8 17 ,6 5 15 ,5 8 15 ,0 0 13 ,9 5 13 ,1 9 %100
total err analysis err analysis err NN
N
P
- 20,0 0 15 ,4 9 12 ,7 9 10 ,8 9 8, 87 %100
'
t reanalysis reanalysis dD
t
P
0,00 5,26 7,02 6,90 6,45 5,97 %100
'
t analysis err reanalysis reanalysis dD
t
t
P
0,00 8,82 11 ,6 9 11 ,2 5 10 ,4 7 9, 89 %100
'
(%)
_
t analysis err reanalysis a tD
t
t
D
0,00 10 ,5 3 15 ,7 9 15 ,5 2 14 ,5 2 13 ,4 3 %100
'
(%)
T analysis err a TC
C
C
0,00 5,43 8,68 8,58 8,07 7,48 % analysis analysis err analysis analysisD
C
C
c
128, 08 18 7, 38 22 2, 96 22 2, 96 22 2, 96 22 2, 96 €/ da yGenerally speaking, improvement measures in the analysis phase are related to the human resource, in the first place, and organizational measures in the second. Without going into detail, the results of the analysis phase (table 3) can be easily particularized per each member of the analysis team. Durations, inconsistencies (errors) by type and generated costs, meaning the 3 groups of input data (table 2), refer to one or more employees in particular. Starting from this point, there is the possibility to identify with precision the “source” of inconsistency. All of this is true for the other phases of the process of software development.
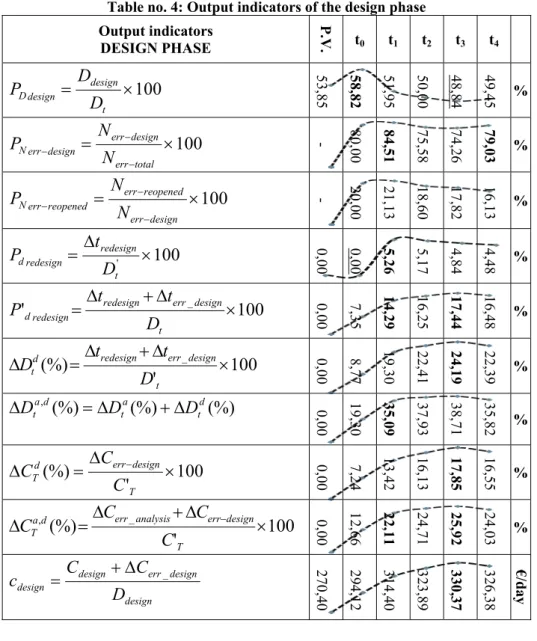
Regarding the design phase, results interpretation is similar to that of the analysis phase, considering the indicators given in table 4.
Table no. 4: Output indicators of the design phase Output indicators DESIGN PHASE P.V. t0 t1 t2 t3 t4
100
t design design DD
D
P
53 ,8 5 58 ,8 2 51 ,9 5 50 ,0 0 48 ,8 4 49 ,4 5 %100
total err design err design err NN
N
P
- 80,0 0 84 ,5 1 75 ,5 8 74 ,2 6 79 ,0 3 %100
design err reopened err reopened err NN
N
P
- 20,0 0 21 ,1 3 18 ,6 0 17 ,8 2 16 ,1 3 %100
'
t redesign redesign dD
t
P
0,00 0,00 5,26 5,17 4,84 4,48 %100
'
_
t design err redesign redesign dD
t
t
P
0,00 7,35 14 ,2 9 16 ,2 5 17 ,4 4 16 ,4 8 %100
'
(%)
_
t design err redesign d tD
t
t
D
0,00 8,77 19 ,3 0 22 ,4 1 24 ,1 9 22 ,3 9 %(%)
(%)
(%)
, d t a t d a tD
D
D
0, 00 19 ,3 0 35 ,0 9 37 ,9 3 38 ,7 1 35 ,8 2 %100
'
(%)
T design err d TC
C
C
0,00 7,24 13 ,4 2 16 ,1 3 17 ,8 5 16 ,5 5 %100
'
(%)
_ ,
T design err analysis err d a TC
C
C
C
0,00 12 ,6 6 22 ,1 1 24 ,7 1 25 ,9 2 24 ,0 3 % design design err design designD
C
C
c
_ 270, 40 29 4, 12 31 4, 40 32 3, 89 33 0, 37 32 6, 38 €/ da ySome of the observations are:
The weight of design duration is floating around the planned value (row 1), which is a favourable situation;
The increase in average daily costs compared with the planned ones does not cause trouble (row 10);
The errors of the design phase have generated an important increase in the total duration, amounting to approx. 22% and 17% increase in costs. The growth of costs is less than that of time extension (reversed if compared with the analysis phase). Moreover, by comparison, these effects are less critical than those of the analysis phase, although the design phase is predominant in the entire process;
Overall, the increase in the total duration of software development generated by both analysis and design phases is approximately 36% whereas the increase in the production costs is about 24% (rows 7 and 9);
As in the analysis phase, redesign, which is a correction activity related to the design phase, involves structural changes of high amplitude in the software application. It is an activity to be avoided due to the negative effects it can generate. Considering our example, redesign increased the total duration by 5%, which is not so bad.
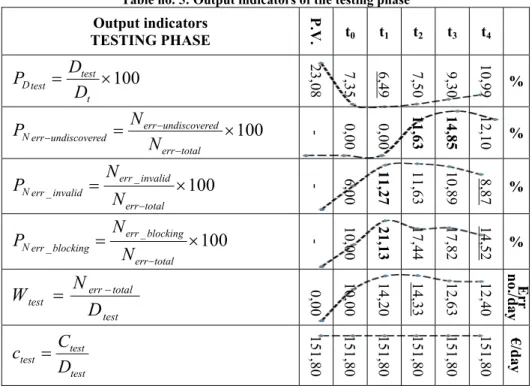
The testing phase is characterized by the output indicators given in table 5.
Table no. 5: Output indicators of the testing phase Output indicators TESTING PHASE P.V. t0 t1 t2 t3 t4
100
t test test DD
D
P
23,0 8 7, 35 6,49 7,50 9,30 10 ,9 9 %100
total err ed undiscover err ed undiscover err NN
N
P
- 0,00 0,00 11,6 3 14 ,8 5 12 ,1 0 %100
_ _
total err invalid err invalid err NN
N
P
- 6,00 11 ,2 7 11 ,6 3 10 ,8 9 8, 87 %100
_ _
total err blocking err blocking err NN
N
P
- 10,0 0 21 ,1 3 17 ,4 4 17 ,8 2 14 ,5 2 % test total err testD
N
W
0,00 10,0 0 14 ,2 0 14 ,3 3 12 ,6 3 12 ,4 0 Err no./d ay test test testD
C
c
15 1, 80 15 1, 80 15 1, 80 15 1, 80 15 1, 80 15 1, 80 €/ da y Remarks:As against the planned value, the weight of the testing duration in the total duration of software development is much smaller (row 1). At first sight, the result is great, the
weight being half of estimations. Correlation with the rest of indicators discloses a worrying situation, as shown in the following;
The weight of undiscovered errors before the moment of delivery and installation at the client (row 2) has a high value, which indicates that a shorter testing duration has negative effects on the second indicator. Too many errors have been missed and appeared after sale;
In support of the previous reasoning, the third indicator underlines the same case: the weight of invalidated errors is rather significant. Again, a level of superficiality can be identified and measures to improve quality have to be taken;
The weight of blocking errors (row 4) has high values along the time series, but it is not the fault of the testing phase. It is the effect of the design phase. More important now is to see how many of these errors have “escaped” to the client. This means further specifying the indicator from the 2nd row of the table by gravity levels of the errors counted, including blocking errors;
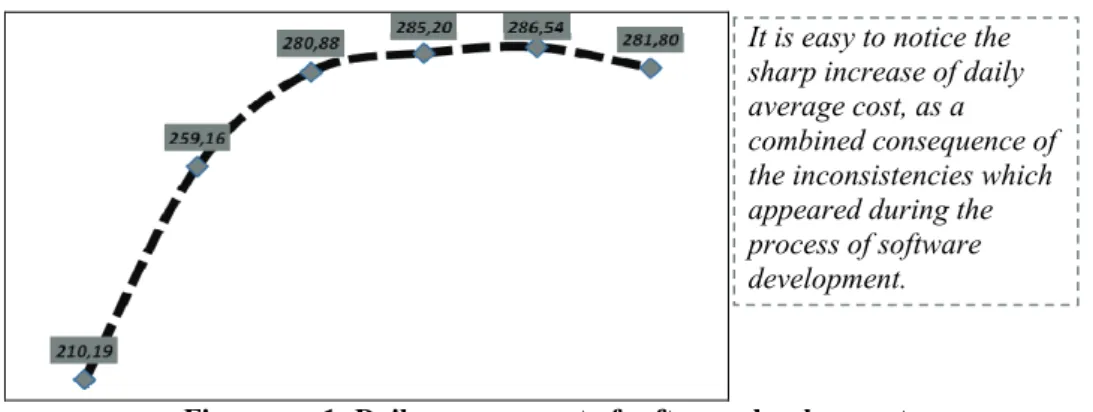
Considering the productivity of testing, it has limited relevance from a qualitative perspective (as mentioned). Nevertheless, its time evolution deserves our attention even if this depends a lot on the quality of work in the previous phases: analysis and design. The correct interpretation of the situations described above through the output indicators depends a lot on the capacity of the manager to analyze and take decisions. In addition to the consequences on the client and on the relationship with him/her (delays, inconsistencies discovered too late, code rewriting etc.), another direct effect is visible on the unitary daily average cost of software development (figure no. 1).
Figure no. 1: Daily average cost of software development Conclusions
Responsibility to clients and quality assurance are concepts that become intertwined any time a company actually pursues such goals in a professional way. The development of models which continuously monitor the quality of processes is a necessity in order to shift from a declarative to a factual level in terms of responsibility to self and to the clients, and this is possible using instruments like the one described in this paper. It proves the fact that instruments which facilitates systematic tracking of a valuable set of indicators can be developed in order to X-ray in depth the quality of critical processes which influence the quality of the final product and the public perception of the firm’s responsibility to clients.
It is easy to notice the sharp increase of daily average cost, as a combined consequence of the inconsistencies which appeared during the process of software development.
Of course, the model is perfectible and it can and has to be adapted to the business profile of the applicant company. It is a model strictly applicable to companies of software development whose process follows the stages described in this study. O the other hand, it could be a good guide for empirical multi-criteria and dynamic approaches toward increasing of responsibility and quality improvement in other activity domains than the one described here.
References
Armaş, I., 2006. Proiectarea competitivă a produselor software. [pdf] Available at: <http://www.agir.ro/buletine/888.pdf> [Accessed 3 July 2013].
Balog, Al. and Olaru, M., 1997. Managementul calită ii i protec ia consumatorilor, vol. 3, lito ASE, Bucharest.
Bajnaid, N., Benlamri, R. and Cogan, B., 2012. An SQA e-Learning System for Agile Software Development. Networked Digital Technologies, Communications in Computer and Information Science, 294, pp. 69-83. [online] Available at: <http://link.springer.com/chapter/10.1007page-2> [Accessed 15 August 2013].
Cavano, J.P. and McCall, J.A, 1978. A framework for the measurement of software quality. [pdf] Available at: <http://www-public.it-sudparis.eu/~gibson/.../Cavano McCall78.pdf> [Accessed 9 August 2013].
Creţu, E. and Gramada, A.D., 2007. Posibilită i de evaluare a calită ii produselor software. [pdf] Available at: <http://megabyte.utm.ro/en/.../2007/...PosibilitatiDe EvaluareACalitatiiProduselorSoftware.pdf> [Accessed 2 August 2013].
Denicoff, M. and Grafton, R., 1981. Software Metrics: Paradigms and Processes.
Computer Science and Statistics: Proceedings of the 13th Symposium on the Interface, pp. 205-207. [online] Available at: <http://link.springer.com/chapter/10.100713-9464-8_30> [Accessed 5 September 2013].
Dumitru, V.F., 2011. The Impact of Information Technologies on the Organization and Functioning of the Company. Amfiteatru Economic, XIII(Special no. 5), pp. 754-770. Dumitru, V. and Florescu, V., 2009. Enterprise Resource Planning Deployment Guide.
Amfiteatru Economic, XI(25), pp. 213-222.
Elkington, J., 1997. Enter the triple bottom line. [pdf] Available at: <http://kmhassociates.ca/resources/1/TripleBottomLineahistory2001.pdf> [Accessed 10 August 2013].
Gorton I., 2006. Essential Software Architecture. Secaucus, NJ: Springer-Verlag New York Inc.
Gray, R., 2007. Taking a long view on what we now know about social and environmental accountability and reporting. Social and Environmental Accounting
1(2), pp. 169-198. [online] Available at: <www.iiste.org/Journals/index.php/ ISEA/.../820> [Accessed 17 July 2013].
Hamlet, D., 1997. An essay on software testing for quality assurance – Editor’s introduction. Annals of Software Engineering, 4(1), pp. 1-9. [online] Available at: <http://link.springer.com/article/10.10232FA3A1018906> [Accessed 25 August 2013].
Ionescu, M.A., 2008. La responsabilité sociale corporative – indicateur de l`innovation entrepreneuriale dans l`employer branding. Education, Research and Innovation: Policies and Strategies, Proceedings of the International Conference on Education, Research and Innovation: Policies and Strategies, Bucharest, pp. 401-408. Available at: <Comunicare.ro> [Accessed 1 September 2013].
Ivan, I. and Teodorescu, L., 1999. Managementul calitatii software. Revista Informatica Economică, nr. 12, pp. 37-42.
Ivan, I., Pocatilu, P. and Capisizu, S., 2000. Certificarea în Informatica Aplicată. Revista Informatica Economică, 2(14), pp. 90-96.
Kevitt, M., 2008. Best Software Test & Quality Assurance Practices in the project Life-cycle. School Computer Applications, Dublin City University.
Ostafi, F., 2009. Ingineria sistemelor de programare. [pdf] Available at: <http://www.ac.tuiasi.ro/..../softwareengineering.pdf> [Accessed 23 July 2013].
Reiner, R., Dumke, R.R. and Grigoleit, H., 1997. Efficiency of CAME tools in software quality assurance. Software Quality Journal, 6(2), pp. 157-169. [online] Available at: <http://link.springer.com/article/10.102318page-1> [Accessed 28 July 2013].
Singh, Y., Kaur, A. and Suri, B., 2008. An Empirical Study of Product Metrics in Software Testing. Innovative Techniques in Instruction Technology, learning,
E-assessment, and Education, pp. 64-72. [online] Available at:
<http://link.springer.com/chapter/10.1007/978-1-4020-8739-4_12> [Accessed 25 July 2013].
Stroe, M., 2012. Noua strategie europeană pentru CSR între 2011-2014. [online] Available at: <http://www.actionamresponsabil.ro/noua-strategie-europeana-pentru-csr-intre-2011-2014/18885> [Accessed la 29 August 2013].
Teodorescu, L. and Ivan, I., 2001. Managementul calită ii software, Bucharest: Editura Inforec. Available at: <http://www.calitate-software.ase.ro/> [Accessed la 3 August 2013].
Toma, S.G., 2008. Social Responsibility and Corporate Citizenship in the 21st Century.
Amfiteatru Economic, X(23), pp. 80-85.
Visser, W., 2008. CSR 2.0: The New Era of Corporate Sustainability and Responsibility.
CSR International Inspiration Series, No. 1. [online] Available at:
<http://www.waynevisser.com/articles/csr-2-0-the-new-era> [Accessed 26 August 2013].
Zultner, R.E., 1993. TQM for Technical Teams. Communications of the ACM, 30(10), pp. 79-90.