Washington University in St. Louis
Washington University Open Scholarship
Arts & Sciences Electronic Theses and Dissertations Arts & Sciences
Spring 5-15-2018
Understanding Stroke in the Connected Human
Brain
Joshua Sarfaty Siegel
Washington University in St. Louis
Follow this and additional works at:https://openscholarship.wustl.edu/art_sci_etds
Part of theNeuroscience and Neurobiology Commons
This Dissertation is brought to you for free and open access by the Arts & Sciences at Washington University Open Scholarship. It has been accepted for inclusion in Arts & Sciences Electronic Theses and Dissertations by an authorized administrator of Washington University Open Scholarship. For more information, please [email protected].
Recommended Citation
Siegel, Joshua Sarfaty, "Understanding Stroke in the Connected Human Brain" (2018).Arts & Sciences Electronic Theses and Dissertations. 1580.
WASHINGTON UNIVERSITY IN ST. LOUIS Division of Biology and Biomedical Sciences
Neurosciences
Dissertation Examination Committee: David Van Essen, Chair Maurizio Corbetta, Advisor
Nico Dosenbach Jin-moo Lee Abraham Snyder Michel Thiebaut de Schotten
Understanding Stroke in the Connected Human Brain by
Joshua Sarfaty Siegel
A dissertation presented to The Graduate School of Washington University in
partial fulfillment of the requirements for the degree
of Doctor of Philosophy
May 2018 St. Louis, Missouri
ii
Table of Contents
List of Figures ... vi
List of Tables ... viii
List of Abbreviations ... ix
Acknowledgments ... x
Abstract ... xv
1 Introduction ... 1
1.1 The localization of human behavior ... 1
1.1.1 One area one function ... 1
1.1.2 Mental Operations and the Modular Organization of the Brain ... 7
1.1.3 Hierarchical network models of brain function ... 10
1.2 Approach ... 12
2 The effects of hemodynamic lag on functional connectivity and behavior after stroke. ... 15
2.1 Abstract ... 16
2.2 Introduction ... 17
2.3 Methods ... 19
2.3.1 Patient Enrollment ... 19
2.3.2 Stroke Source Population ... 20
2.3.3 Healthy Control Enrollment ... 20
2.3.4 R-fMRI acquisition and analysis ... 21
2.3.5 R-fMRI Data Preprocessing ... 22
2.3.6 Lesion Segmentation ... 22
2.3.7 Pulsed ASL and Carotid Doppler ... 23
2.3.8 Behavioral Testing ... 23
2.3.9 ROIs ... 24
2.3.10 Lag measure ... 25
2.3.11 Lag Laterality ... 27
2.3.12 Resting state BOLD power analysis ... 28
2.3.13 Correcting functional connectivity measures for hemodynamic lag ... 28
2.4 Results ... 29
2.4.1 Lag analysis reveals sizeable delays in the hemodynamic response ... 31
iii
2.4.3 Lag predicts performance deficits ... 35
2.4.4 Areas of lag show reduced blood flow ... 36
2.4.5 Lag and resting state functional connectivity ... 37
2.4.6 Altered BOLD signal power ... 37
2.4.7 Lag disrupts functional connectivity but can be partially corrected ... 38
2.4.8 Stroke FC-behavior relationships persist with lag correction ... 40
2.5 Discussion ... 41
2.5.1 Physiological Implications ... 43
2.5.2 Prognostic Implications ... 45
2.5.3 Lag disrupts measurement of functional connectivity ... 45
2.5.4 Limitations ... 47
2.5.5 Conclusion ... 48
2.6 Acknowledgment ... 48
2.7 Supplementary Figures & Tables ... 49
3 Resting fMRI in Stroke – approaches and considerations ... 51
3.1 Abstract ... 52
3.2 Intro ... 53
3.3 Registration of the cortical surface and subcortex ... 54
3.4 Blood flow and hemodynamics ... 60
3.5 Hemodynamic lags ... 61
3.6 Neurovascular Coupling ... 64
3.7 General Recommendations ... 67
3.8 Asserting validity of FC based on prior findings ... 69
4 Disruptions of network connectivity predict impairment in multiple behavioral domains after stroke ... 71 4.1 Abstract ... 72 4.2 Introduction ... 73 4.3 Methods ... 75 4.3.1 Subject Enrollment ... 75 4.3.2 Neuropsychological Assessment ... 77
4.3.3 MRI and Lesion Analysis ... 78
4.3.4 R-fMRI Acquisition ... 79
4.3.5 fMRI Data Preprocessing ... 80
4.3.6 Functional Connectivity Processing ... 80
4.3.7 Surface Processing ... 81
4.3.8 Parcellation (Regions of Interest) and Community Assignments ... 82
4.3.9 Univariate Network FC Analysis ... 83
iv
4.3.11 Multi-task Learning ... 86
4.4 Results ... 88
4.4.1 Abnormal FC patterns in stroke ... 88
4.4.2 Prediction of behavioral deficits based on lesion and FC ... 91
4.4.3 Topography of behaviorally predictive FC ... 94
4.4.4 Prediction of common behavioral impairment ... 97
4.5 Discussion ... 98
4.5.1 Inter-hemispheric Connectivity and Stroke ... 99
4.5.2 Structure vs. Function - relative contribution to different behavioral deficits ... 101
4.5.3 Caveats/Limitations ... 104
4.5.4 Conclusions ... 106
4.6 Acknowledgement ... 106
4.7 Supplemental Figures and Tables ... 107
5 The circuitry of abulia: insights from functional connectivity MRI ... 116
5.1 Abstract ... 117
5.2 Introduction ... 118
5.3 Case History ... 119
5.4 Methods ... 123
5.4.1 Subjects and MRI Acquisition and Preprocessing ... 123
5.4.2 Aberrant Functional Connectivity ... 123
5.5 Results ... 126
5.5.1 Neuropsychological Evaluation identified Abulia and Anterograde Amnesia ... 126
5.5.2 Aberrant Functional Connectivity (AFC) ... 126
5.5.3 Seed-based correlation mapping ... 128
5.5.4 Network-based analysis ... 129
5.5.5 Rescan and within-scan Validation ... 130
5.5.6 Positron Emission Tomography ... 131
5.6 Discussion ... 131
5.6.1 Case summary – Links to behavior ... 132
5.6.2 Cingulo-opercular Network (CON) ... 133
5.6.3 Default Mode Network ... 134
5.6.4 Limitations and Conclusions ... 134
5.7 Acknowledgements ... 136
5.8 Supplementary Figures and Tables ... 136
6 Re-emergence of brain network modularity predicts stroke recovery ... 139
6.1 Abstract ... 140
6.2 Introduction ... 141
v 6.3.1 Subject Enrollment ... 143 6.3.2 Neuropsychological evaluation ... 144 6.3.3 Imaging ... 145 6.3.4 Lesion Masking ... 146
6.3.5 fMRI data preprocessing ... 146
6.3.6 Functional Connectivity Processing ... 147
6.3.7 Surface Processing ... 148
6.3.8 Gordon & Laumann Parcellation ... 149
6.3.9 Parcel Homogeneity ... 149
6.3.10 Modularity ... 150
6.3.11 Community Detection, Assignment, and Visualization ... 153
6.4 Results ... 153
6.4.1 Functional brain areas defined in healthy young adults remain present across stroke and recovery ... 153
6.4.2 Modularity is reduced sub-acutely but returns in parallel with behavior ... 157
6.4.3 Visualizing recovery of the brain graph in an aphasic case ... 161
6.5 Discussion ... 165
6.6 Acknowledgment ... 169
6.7 Funding ... 169
7 Further Discussion: Integrated hierarchical brain systems and human behavior ... 171
7.1 Abstract ... 172
7.2 Interdependent Behavior Deficits ... 173
7.3 Interdependent Functional Brain Systems ... 177
7.3.1 Lesions have widespread effects ... 178
7.3.2 The relationships between FC and deficit ... 179
1.2 Limitations & Considerations ... 183
7.4 Conclusion ... 184
vi
List of Figures
FIGURE 1-1.PROGRESSION VIEWS OF BRAIN-BEHAVIOR RELATIONSHIPS ... 11
FIGURE 1-2.LONGITUDINAL STROKE STUDY RECRUITMENT, BEHAVIORAL AND IMAGING BATTERIES. ... 14
FIGURE 2-1USING TEMPORAL CROSS-CORRELATION TO MEASURE LAG IN RESTING STATE FMRI. ... 26
FIGURE 2-2DELAY IN THE RESTING HEMODYNAMIC RESPONSE (LAG) IS OBSERVED AFTER STROKE. ... 33
FIGURE 2-3AREAS OF LAG SHOW REDUCED BLOOD FLOW. ... 36
FIGURE 2-4BOLD POWER SPECTRA. ... 38
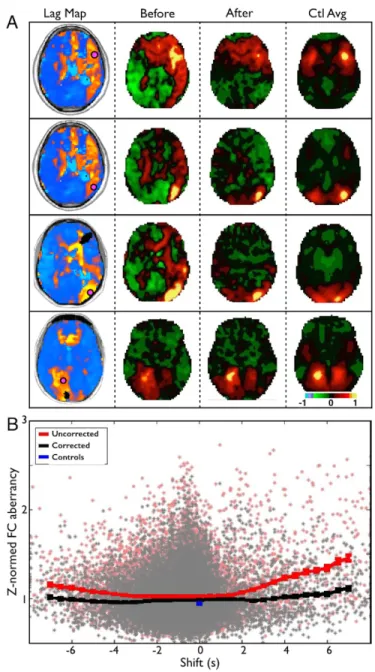
FIGURE 2-5.LAG DISRUPTS FUNCTIONAL CONNECTIVITY BUT CAN BE PARTIALLY CORRECTED. ... 39
FIGURE 2-6.STROKE FC–BEHAVIOR RELATIONSHIPS PERSIST AFTER LAG CORRECTION. ... 41
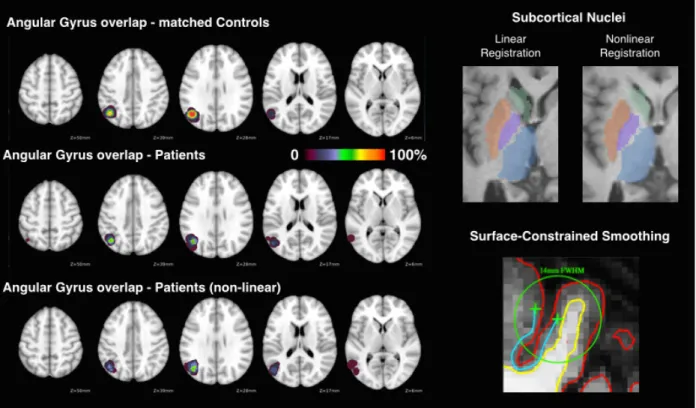
FIGURE 3-1NONLINEAR REGISTRATION AND SURFACE-BASED TOOLS IMPROVE STROKE PATIENT ALIGNMENT. ... 55
FIGURE 3-2.FREE SURFER SEGMENTATION ERROR CAUSED BY A LARGE LESION, AND SUBSEQUENT RESOLUTION AFTER LESION-MASKING AND MANUAL EDITING. ... 58
FIGURE 3-3.IDENTIFYING AND CORRECTING GRAY MATTER SEGMENTATION ERRORS. ... 59
FIGURE 3-4.HEMODYNAMIC LAGS SYSTEMATICALLY ALTER FUNCTIONAL CONNECTIVITY ... 63
FIGURE 3-5.QUALITY ASSESSMENT IMAGES FOR A SAMPLE SUBJECT ... 69
FIGURE 4-1.STROKE PREFERENTIALLY AFFECTS HOMOTOPIC CONNECTIONS. ... 89
FIGURE 4-2.PREDICTION OF BEHAVIORAL DEFICITS ON THE BASIS OF STRUCTURAL AND FUNCTIONAL IMAGING. ... 91
FIGURE 4-3.LESION-DEFICIT AND FC-DEFICIT MODEL ACCURACIES VARY BY DOMAIN. ... 92
FIGURE 4-4.MOST PREDICTIVE CONNECTIONS AND NODES FOR EACH FC-DEFICIT MODEL.LEFT: ... 94
FIGURE 4-5.NETWORK VIEW OF FC-DEFICIT DOMAIN MODELS. ... 96
FIGURE 4-6.MULTI-TASK LEARNING SHARED WEIGHTS. ... 98
FIGURE 5-1.AFCMETHODOLOGY SCHEMATIC. ... 125
FIGURE 5-2.FLAIR, ABERRANT FUNCTIONAL CONNECTIVITY (AFC) MAP, AND CORRELATION MAPS DEMONSTRATE LESION-DYSFUNCTION RELATIONSHIP AND FUNCTIONAL CONNECTIVITY CHANGES. ... 127
vii
FIGURE 5-4.REPRODUCIBILITY OF AFC MAPS AT 3 YEAR FOLLOW UP. ... 130
FIGURE 6-1.FUNCTIONAL BRAIN AREAS AND NETWORKS REMAIN PRESENT ACROSS STAGES OF STROKE AND RECOVERY. ... 155
FIGURE 6-2.RECOVERY OF MODULARITY CORRELATES WITH BEHAVIORAL RECOVERY BY ONE YEAR. ... 159
FIGURE 6-3.MODULARITY IS RELATED TO INTERHEMISPHERIC INTEGRATION AND IPSILESIONAL SEGREGATION. ... 160
FIGURE 6-4.CASE STUDY OF APHASIC PATIENT P108. ... 162
FIGURE 6-5P30:SEVERE LEFT HEMI-NEGLECT WITH POOR RECOVERY, LOW MODULARITY THROUGHOUT. ... 164
FIGURE 6-6.P161:SEVERE LEFT HEMIPARESIS WITH GOOD RECOVERY, MINIMAL CHANGE IN MODULARITY BY 1 YEAR. ... 165
FIGURE 6-7.GROUP FCSIMILARITY TO CONTROLS. ... 167
FIGURE 7-1.BEHAVIORAL CLUSTERS AT 2 WEEKS,3 MONTHS,1 YEAR, AND MODERATION. ... 175
FIGURE 7-2.STRUCTURAL AND FUNCTIONAL CORRELATES OF SPATIAL BIAS IN NEGLECT PATIENTS. ... 180
**References to figures made in chapter text will only give the figure number within that chapter. For example, if the notation ‘Fig. 2’ appears within the text of chapter 5, it refers to Figure 5-2.
viii
List of Tables
TABLE 2-1.CLINICAL AND BEHAVIORAL CORRELATES OF LAG. ... 30
ix
List of Abbreviations
R-fMRI – resting state functional magnetic resonance imaging
BOLD – blood oxygenation level dependent
FC – Functional connectivity
DVARS –frame-to-frame fMRI signal intensity change (mean of whole-brain differentiated BOLD time series)
MTL – multi-task learning;
BVMT – brief visuospatial memory test;
HVLT – hopkins verbal learning test;
RSNs – Resting State Networks:
VIS = Visual network; PO = parieto-occipital; SMD = dorsal somato-motor; SMV = ventral somato-motor; AUD = auditory; CON = cingulo-opercular; VAN = ventral attention; SAL = Salience; CP = Cingulo-parietal; DAN = dorsal attention network; FPN = frontoparietal network; DMN = default mode network; NON = no assigned network.
x
Acknowledgments
I think about how lucky I am to be where I am, and be doing what I am doing, just about every single day. For that, and for everything written in this dissertation, the credit goes to the people that I have had the fortune to learn from, work with, and play with. I am humbled in my gratitude for their support. Here are those who have helped me the most through my career, in roughly chronological order.
Carla Lankford – a warm and kind soul, my first scientific mentor from my first scientific research position at the NIH, and still my friend today.
Carl Craver - When I got to Washington University in St. Louis as a freshman, undecided about what path to pursue, I took an introductory cognitive sciences class. By the end of every class, after an hour and a half of animated and provocative lecturing and debate, Dr. Craver would often leave the class drenched in sweat. His sweat was disturbing, but energy and inspiration was contagious. Over the next four years he was an inspiring teacher, my major advisor, thesis advisor, and a tremendous mentor in every sense. I very distinctly remember asking him if he would recommend me to go work in Steve Petersen’s lab. “I’ll do it, but don’t fuck this up.” - Having taught me during my freshman year, he had good reason for concern. But he
recommended me… and I did my best not to. And so it goes.
Steve Petersen - for giving me the opportunity to work in his lab as an undergraduate and take a hands-on role in a neuroimaging experiment. From the beginning, Steve expected me to take the reins with almost every aspect of experimentation and to work though them thoughtfully and
xi
carefully. But perhaps most importantly, joining Steve’s lab changed my perception of what it means to be a scientist – because of the environment that he creates. He remains an excellent mentor, teacher, and scientific role model to me.
Brad Schlaggar – for taking time out of his busy schedule for me many times over the past 7 years. Brad is exceptional as a man who treats everyone fairly, treats every problem thoughtfully and never lets anything cloud his judgement and values.
Hristina Lessov-schlaggar - for just being a caring, inspirational, and fun person to be around.
Maurizio Corbetta – my thesis advisor. He has taught me that value of bringing clinical
knowledge and experience to the intellectual and scientific pursuit of understanding the human brain. He has also taught me that art of taking small facts – one experiment or one paper – and fitting them in to large models that help us understanding how the brain works and help us to see what is the next experiment that needs to be done.
Avi Snyder – the incomparable. He is at once a bulldog and a puppy. And by this I don’t mean that he walks on all fours, but that he fights for truth and clarity in science above all else, and he has been a great friend to me and to so many other graduate students that have passed through the neuroimaging labs. There would literally be no neuroimaging labs without Dr. Snyder. Despite this, he remains humble, down-to-earth, and patient with any student hungry to learn.
Gordon Shulman – who has kept the Corbetta lab grounded. He is a careful and thoughtful scientist, and my PhD work would not have been possible without his advice, mentorship, and collaboration.
xii
Nick Metcalf – who has been so incredibly helpful as the ahh… senior data managing bioinformati.… the problem solver. I can’t praise Nick enough for what he has given to the Corbetta lab, and to me. And just as importantly, Nick is just a great guy to work with and to hang out with.
Alex Carter – for being a clinical role model and a ‘good guy’ role model, and pushing me to always think about how our research relates to clinical care.
The members of my thesis committee - Jin-moo Lee, David Van Essen, Nico Dosenbach, Michel Thiebaut de Schotten – picking a thesis committee was honestly one of the most fun parts of this whole process for me. It was like putting together my scientific dream team. I got the all stars of stroke and of brain networks, the up and coming rookie, and even some guy in London (now Paris) – I just read his book on brain connections, thought it brilliant, and then called him up the next week and said “Hey, want to be on my thesis committee?” Beyond committee meetings, I have now had the opportunity to collaborate with every one of them, and it has been a pleasure.
Next, let me thank all of the students that I have had the pleasure to work with and play with in my years in the NIL.I will give a special thanks to Lenny Ramsey, who was really a great person to work with and just an impressive personality in so many ways. But I also thank the students before me – Steve Nelson, Alecia Vogel, Tim Laumann, Alex Cohen, Matt Brier, Mario Ortega – and the students of my cohort - Anish Mitra, Ben Seitzman, Haoxin Sun, and Dohyun Kim. I couldn’t ask for a better group of people to work with.
Finally, there are many friends and family members who have support me thoughout the time I spent working on my dissertation. Here are a few that deserve special thanks.
xiii
My parents deserve the largest credit for allowing me to reach this point in my career. I definitely won the lottery on this one. No other way to put it. I learned a love of science and numbers from my dad. From my mom, I learned the value and the reward of finding something that you are passionate about and then pouring your heart in to it. But more importantly than any lesson, they have provided for me and supported me tirelessly and limitlessly.
Lastly, a special thanks to my beautiful wife, Jeannette Wong-Siegel. For patiently accepting my occasional long nights in the lab or at the computer. For providing me with the emotional and culinary support that I needed. For always pushing me to live up to my own expectations of myself. For making life a thrill and a joy. For often knowing what was best for me, even when I didn’t … like getting a dog (boy, was I wrong about that one). This work is not my
accomplishment, but our accomplishment.
Thank you.
xiv
xv
Abstract
Structural and functional disconnection following stroke by
Joshua Siegel
Doctor of Philosophy in Biology and Biomedical Sciences Neurosciences
Washington University in St. Louis, 2016 Professor Maurizio Corbetta, Principal Investigator
Professor David Van Essen, Chair
Although structural damage from stroke is focal, remote dysfunction can occur in regions of the brain distant from the area of damage. Lesions in both gray and white matter can disrupt the flow of information in areas connected to or by the area of infarct. This is because the brain is not an assortment of specialized parts but an assembly of distributed networks that interact to support cognitive function. Functional connectivity analyses using resting functional magnetic resonance imaging (fMRI) have shown us that the cortex is organized into distributed brain networks. The primary goal of this work is to characterize the effects of stroke on distributed brain systems and to use this information to better understand neural correlates of deficit and recovery following stroke. We measured resting functional connectivity, lesion topography, and behavior in multiple domains (attention, visual memory, verbal memory, language, motor, and visual) in a cohort of 132 stroke patients. Patients were followed longitudinally with full behavioral and imaging batteries acquired at 2 weeks, 3 months, and 1 year post-stroke. Thirty age- and demographic-matched controls were scanned twice at an interval of three months.
In chapter 1, we explore a central question motivating this work: how is behavior represented in the brain? We review progressing prospective – from basic functional localization to newer theories connecting inter-related brain networks to cognitive operations. In so doing, we attempt
xvi
to build a foundation that motivates the hypotheses and experimental approaches explored in this work.
Chapters 2 and 3 serve primarily to validate approaches and considerations for using resting fMRI to measure functional connectivity in stroke patients. In chapter 2, we investigate hemodynamic lags after stroke. ‘Hemodynamic lag’ is a local delay in the blood oxygen level dependent (BOLD) response to neural activity, measured using cross-correlation of local fMRI signal with some reference brain signal. This work tests assumptions of the BOLD response to neural activity after stroke, but also provides novel and clinically relevant insight into
perilesional disruption to hemodynamics. Significant lags are observed in 30% of stroke patients sub-acutely and 10% of patients at one-year. Hemodynamic lag corresponds to gross aberrancy in functional connectivity measures, performance deficits and local and global perfusion deficits. Yet, relationships between functional connectivity and behavior reviewed in chapter 1 persist after hemodynamic delays is corrected for. Chapter 3 provides a more extended discussion of approaches and considerations for using resting fMRI to measure functional connectivity in stroke patients. Like chapter 1, the goal is to motivate experimental approaches taken in later chapters. But here, more technical challenges relating to brain co-registration, neurovascular coupling, and clinical population selection are considered.
In chapter 4, we uncover the relationships between local damage, network wide functional disconnection, and neurological deficit. We find that visual memory and verbal memory are better predicted by connectivity, whereas visual and motor deficits are better predicted by lesion topography. Attention and language deficits are well predicted by both. We identify a general pattern of physiological network dysfunction consisting of decrease of inter-hemispheric
xvii
integration and decrease in intra-hemispheric segregation, which strongly related to behavioral impairment in multiple domains.
In chapter 5, we explore a case study of abulia – severe apathy. This work ties together principles of local damage, network disruption, and network-related deficit and demonstrates how they can be useful in understanding and developing targeted treatments (such as transcranial magnetic stimulation) for individual stroke patients.
In chapter 6, we explore longitudinal changes in functional connectivity that parallel recovery. We find that the topology and boundaries of cortical regions remains unchanged across recovery, empirically validating our parcel-wise connectivity approach. In contrast, we find that the
modularity of brain systems i.e. the degree of integration within and segregation between networks, is significantly reduced after a stroke, but partially recovered over time. Importantly, the return of modular network structure parallels recovery of language and attention, but not motor function. This work establishes the importance of normalization of large-scale modular brain systems in stroke recovery.
In chapter 7, we discuss some fundamental revisions of past lesion-deficit frameworks necessitated by recent findings. Firstly, anatomical priors of structural and functional connections are needed to explain why certain lesions across distant locations should share behavioral consequences. Secondly, functional priors of connectomics are needed to explain how local injury can produce widespread disruption to brain connectivity and behavior that have been observed.
1
1
Introduction
A central question in neuroscience for nearly two centuries has been ‘how behavior is represented in the brain?’ Since the times of Wernicke and Broca in the late 19th century, the
principle of localization of function – according to which different parts of the brain are specialized for different functions – has been center stage in our thinking about how the brain enables behavior. By the late 1980’s, principles of cognitive neuroscience were emerging, bolstered by the advent of functional neuroimaging. Instead of the posited correspondance between one brain region and one function, the paradigm for studying brain function shifted to the idea that brain regions housed ‘mental operations’, and that behavior was mediated by ensembles of mental operations organized in ‘networks’ of brain regions. Research in the last 20 years has pushed us even further from a strict localizationist view. It has been shown that even single operations recruit distributed neural systems, and that even small lesions can cause functional alterations among distant regions of cortex with no structural connections to the lesion. The next paragraphs reviews in more detail these different theories about brain-behavior relationships, specifically in relation to lesion studies, with the goal of setting up a set of issues that I will address experimentally in my thesis.
1.1
The localization of human behavior
1.1.1
One area one function
Much of our understanding of brain function comes from over 140 years of studies that describe specific deficits following lesions to specific parts of the brain (Broca, 1861; Wernicke, 1874).
2
Maps of different behaviors (executive function, vision, movement, language, etc) onto different brain regions, as extrapolated from lesion-behavior studies, represent the most common
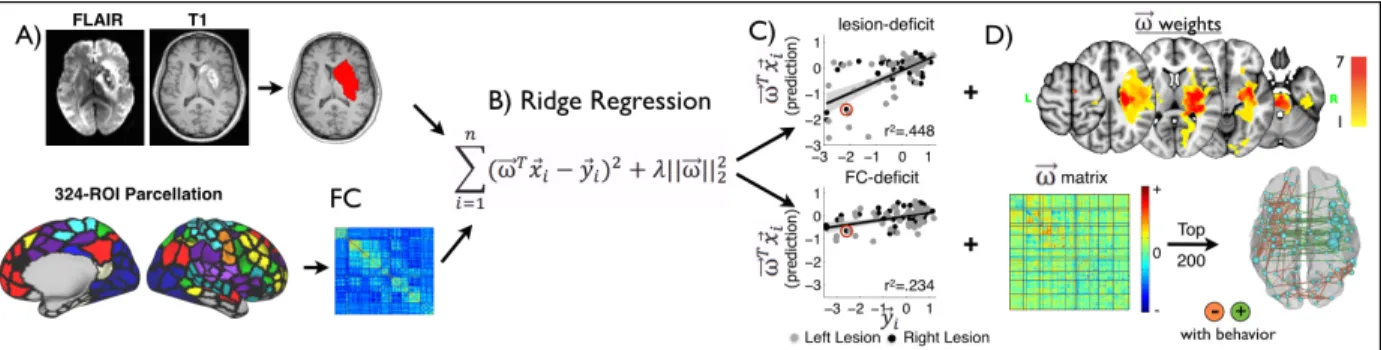
framework for understanding the behavioral effect of focal or diffuse injuries to the brain (Fig. 1A).
From an historical perspective it is interesting to realize that the principle of localization of function, as any other theory in science, won the battle of cultural evolution through the natural selection offered by conference communications, papers, and political/sociological influence. When Broca first presented his theory and evidence in Paris in 1861, the reception was skeptical to say the least1. But by the early decades of the 1900’s his views were dominant. This framed the
work of the 20th century, with many researchers identifying abnormal behaviors that could be
engendered by lesions in different locations, and few reporting observations that questioned the localizationist dogma.
But the conclusions drawn from studies were often circular consequences of the approaches and assumptions of the study. For example, most localization findings were based either on case series with a shared deficit of interest (e.g. a deficit of speech production or speech
1 Pierre Flourens claims that, by ablation of various brain regions, he has disproven localization of function. In this
very same year of 1861, a young surgeon named Paul Broca receives word of a patient named Leborgne in the Bicetre hospital with a processive loss of speech, but not a loss of language comprehensions. He is nicknames Tan due to his inability to say any words other than Tab. Misseure Leborgne dies a few years later and Broca performs an autopsy. He determines that, as predicted, Leborgne did in fact have a lesion in the frontal lobe in the left cerebral hemisphere. From a comparative progression of Leborgne's loss of speech and motor movement, the area of the brain important for speech production was determined to lie within the third convolution of the left frontal lobe, next to the lateral sulcus. This case finally gives him the edge over Pierre Flourens. In the following two years, Broca is able to find autopsy evidence for 8 more cases in support of the localization of articulated language to the left frontal lobe. Broca’s findings were formally published in 1865 (Finger, 2004).
3
understanding), or else a comparison between a group of patients with and a group without a deficit of interest. Such approaches were designed to localize a ‘function’ by finding patients with a unique behavioral profile after a lesion to a specific location in the brain. The
interpretation was that the deficient function was housed in the damaged part of the brain, thus leading to the creation of maps of normal functions in the brain based on their disruption after damage. The most successful examples of this approach were the demonstration that language was localized to specific regions of temporal and frontal cortex (Broca, 1861; Wernicke, 1874), and that memory encoding could be devastated by focal damage of the hippocampus (Scoville and Milner, 1957).
The advent of CT and MRI scans in the 1960’s and 1970’s allowed imaging of lesions in vivo. Along with the development of improved statistical techniques (Bates et al., 2003), this led to even finer mapping of deficits onto specific parts of the brain. These methods called ‘voxel-based lesion-symptom mapping’ are ‘voxel-based on the same assumptions as the classical clinical studies. However, they take advantage of the increased spatial resolution of CT/MRI scans comparing often large groups of patients with or without a specific deficit down to the level of a small part of the brain, i.e. a voxel (a volume tipically 1-2 mm3). Voxel-based lesion-symptom mapping has been applied not only to basic sensory, motor, and cognitive functions or
operations, but also to very complex cognitive constructs like theory of mind (Blanke et al., 2004; Saxe and Powell, 2006), body schema (Buxbaum et al., 2000; Buxbaum and Coslett, 2001), risk taking (Clark et al., 2008), the gist of language comprehension, and recognition of emotions in facial expression (Adolphs et al., 1994).
4
These approaches still included many of the same biases as the traditional anatomo-clinical method of single case studies, notably that disruption of behavior after a specific lesion implied a key contribution of that region of the brain to normal function. Additionaly, standard voxel-wise lesion-deficit methods use univariate statistics that assume statistical independence of
neighboring voxels in their contribution to behavior. Especially with regard to stroke, this assumption is invalid. Damage frequently co-occurs in neighboring voxels or even more distant voxels within a common vascular distribution will frequently. This systematically distort precision and displace results of lesion-deficit maps (Mah et al., 2014; Phan et al., 2010). These biases can be attenuated by using multivariate approaches. A more significant problem is that statistical association methods like logistic regression begin with a deficit measured on some scale (independent variable), and then predict if a voxel is damaged or not (dependent variable). This precludes asking how much variance in a given behavior is explained by lesion location. A strict localizationist theory would predict that most of the variability of behavioral performance across of a group of patients would be explained by lesion location. This claim is not only
important, but empirically falsifiable using machine learning models that predict deficit based on lesion. If the amount of variance accounted for in such a model is relatively small, then other explanations for the severity of behavioral disruption must be considered.
Another problem for lesion-symptom mapping studies is the interpretative bias toward cortex. Researchers have focused on the cortical damage, and have largely ignored the white matter. This bias is not surprising in the historical context of neuroanatomy. Initially, physiological studies electrical stimulation of cortex had a large influence on early neuroanatomical thinking (Gustav Fritsch and Edvard Hitzig, 1870, dog’s motor cortex; Penfield, 1949 human cortex).
5
Moreover, the availability of a systematic way to identify cortical areas (Brodmann, 1909), and the corresponding lack of an atlas of the white matter, made it convenient to correlate behavioral deficits with damage of specific cortical areas. When CT scans became available for mapping lesions, lack of stereotactical methods of lesion analysis favored the projection of lesions onto a Brodmann’s atlas. Despite availability of stereotactical lesion normalization, more recent voxel-based lesion-symptom mapping studies often remain biased toward cortex by focusing
interpretation on troves of cognitive neuroimaging data showing cortical activation for different tasks.
But this ‘cortico-centric’ view of brain-behavior relationships was not so pronounced early on in the history of neuroanatomy. In 1874 Karl Wernicke described the ‘conduction aphasia’,
resulting from damage to the arcuate fasciculus connecting temporal auditory centers to the frontal speech area (Wernicke, 1874). This became the prototype for the disconnection
syndrome. Wernicke later hypothesized that connections from and to locations of the brain are as critical, and in some cases, even more critical than cortical localization to understanding deficit (Wernicke, 1885). Similarly, alexia and other syndromes were hypothesized to arise from disconnection (e.g. Dejerine, 1891). In the 1960’s Norman Geshwind elaborated on these early views to propose disconnection as a major mechanism accounting for neurological deficits. However, the emphasis on the role of the white matter was largely lost in the decades that followed.
More recently, there has been a resurgence of the potential importance of white matter damage on behavior. For instance, the two brains that Broca initially described to support the importance of the left inferior frontal cortex for speech production later on were found to have extensive
6
damage of the frontal-temporo-parietal white matter, as well as damage of neighboring insular cortex and subcortical nuclei (Dronkers et al., 2007). Similar arguments apply for other famous cases that have been used as examples of localization of function (see Thiebaut de Schotten et al., 2015 for a re-consideration of important cases in the language of white matter damage). And both lesion and awake intraoperative stimulation approaches have enabled extensive description of the functional role of numerous large white matter bundles (Duffau, 2015).
More generally, even taking a cortico-centric view of lesion-behavior relationships, it became apparent in the 1970’s that the traditional ‘one area one function’ approach was fallible. Studies of aphasia by the Boston VA group showed that the localization of lesion to specific ‘language’ regions did not produce the expected deficits. For instance damage to Broca’s area did not produce a chronic linguistic problem (Mohr et al., 1978). Lesions anywhere in the large perisylvian cortex could produce linguistic deficits, and not even the distinction between anterior/speech output and posterior/speech understanding could be confirmed all the time (Mazzocchi and Vignolo, 1979; Vignolo et al., 1986).
Efforts to localize hemispatial neglect – a syndrome present in on third of acute stroke patients in which a deficit in awareness of one side of space (contralateral to the lesion) is observed – provided a further example of limitations to the localizationist model. Neglect was initially classified as a ‘parietal sign’ (Brain, 1941; Critchley, 1953; McFie et al., 1950; Paterson and Zangwill, 1944). Ensuing investigations pointed out that spatial neglect can also arise from damage to frontal cortex (Heilman and Valenstein 1972; Damasio et al. 1980), temporal cortex (Beume et al., 2016; Karnath et al., 2001) thalamus (Cambier et al., 1980; Watson et al., 1981; Watson and Heilman, 1979), and to the basal ganglia (Damasio et al., 1980; Hier et al., 1977;
7
Kumral et al., 1999; Leibovitch et al., 1998; Sapir et al., 2007). And studies by De Renzi and collaborators showed that the laterality of spatial functions to the right hemisphere was relative and not absolute (De Renzi, 1982).
1.1.2
Mental Operations and the Modular Organization of the Brain
By the late 1980’s, emerging principles of cognitive neuroscience, originating from the fusion of cognitive science and neuroscience, led to the idea that behavior results from a series of mental operations carried out by an ensemble of distributed brain regions (Fig. 1B). This was thanks in large part to the advent of functional neuroimaging in 1980-1990’s (Belliveau et al., 1991; Fox and Raichle, 1986; Posner et al., 1988). Functional brain images showed that even simple tasks engaged numerous widely distributed brain areas, and that behavior requires the orchestration of multiple cortical and sub-cortical regions organized in networks (Mesulam, 1990; Posner et al., 1988). For example in a landmark study Petersen and colleagues used PET activation
methodology with O15-water to show that simple language tasks engaged not only left but also right hemisphere regions, and that even cerebellar regions were involved in the cognitive aspect of word selection (Petersen et al., 1988).
In the cognitive neuroscience way of thinking, a brain region is conceptualized as a processor that performs a specific operation on an input, and generates a specific output to another region. A complex behavior is putatively represented by the sequential and precise temporal recruitment of different processing operations, hence brain regions. Brain regions specialized for different functions are organized in dedicated networks (attention, memory, language) (Mesulam, 1990;
8
Posner et al., 1988). Fairly abstract cognitive functions could now be understood as a combination of simpler operations.
This led researchers to try to identify the key sites of dysfunction of specific complex cognitive systems by combining psychometric tasks able to isolate specific cognitive components with accurate structural imaging of lesions using MRI. A parallel agenda in healthy subjects involved
mapping specific operations onto brain areas using functional neuroimaging in combination with carefully designed psychological paradigms in which a single element of the task was manipulated either dichotomously or parametrically.
Early notable attempts involved, for instance, the localization of three putative components of the orienting attention system: disengage, move, engage to posterior parietal cortex, superior colliculus/frontal eye field, and pulvinar of the thalamus (Posner and Cohen, 1984). Another attempt was the separation of the three sub-sytems of attention: an orienting network involving posterior parietal cortex; an arousal network involving right inferior frontal cortex and inferior parietal cortex; and, a response selection involving anterior cingulate and dorsolateral prefrontal cortex (Posner and Petersen, 1990). Yet efforts to find corresponding anatomical and behavioral dissociations in stroke patients have not yielded robust dissociations (Rengachary et al., 2011; Verdon et al., 2009) [reviewed in Corbetta and Shulman, 2011]. On the contrary, most patients with hemispatial neglect suffer from a combination of deficits of visuospatial attention, motor exploration, arousal, and sustained attention.
There are several reasons why a simple mapping of one brain region to one mental operation (one-to-one) does not represent a satisfactory model of brain-behavior relationships. A first fundamental problem is that patterns of activation that include multiple distant brain areas appear
9
to correspond to even a single cognitive operation like a shift of attention, or the detection of a mismatch in response (many-to-one) (Dosenbach et al., 2006). A second possible problem is that certain regions are driven by many cognitive tasks, and thus damage to a region can cause deficits in multiple domains (one-to-many).
A third problem is that a lesion in the brain causes distributed functional abnormalities to structurally normal regions of the brain. Appreciation for this phenomenon gained considerable momentum in the late 1990- early 2000s. fMRI studies showed that functional abnormalities correlate with acute deficits, and tend to normalize in parallel with recovery of function (Buckner et al., 1996; Corbetta et al., 2005; Saur et al., 2006; Ward et al., 2003). These imaging
observations provide the provocative suggestion that a lesion can broadly alter neural function across many brain regions, and that this widespread functional alteration may be the best correlate of abnormal behavior in the presence of a brain lesion.
This idea is also not novel as it corresponds to the principle of ‘diaschisis’, first enunciated by Konstantin Von Monakoff in 1914 (von Monakow, 1914). Diaschisis is the principle that
neurophysiological changes can occur distant from a focal brain lesion. De-afferentations, or loss of input to a cortical area, can produce immediate changes in metabolism, blood flow, resting neural activity, and evoked neural activity. Consider a straightforward anatomical illustration of this principle; destruction of ascending dopaminergic nigrostraital pathways results in a
reduction of glucose metabolism in the basal ganglia (Schwartz, 1978). For more extensive reviews of focal diaschisis, we direct the reader to (Feeney and Baron, 1986) and (Carrera and Tononi, 2014). More complex relationships have been proposed between subcortical damage and cortical blood flow and glucose metabolism (Hillis et al., 2002). However, the relationship of
10
hypoperfusion or hypometabolism to behavior remains uncertain. More generally, analogously to lesion information, it is entirely unclear how much of behavioral variability functional alterations of any type explain. This major gap is largely due to lack of any large-scale studies of stroke patients in which behavior, structure, and function have been systematically examined.
1.1.3
Hierarchical network models of brain function
Finally, we have begun to move towards a framework in which the brain is not an assortment of specialized parts but an assembly of distributed networks that flexibly interact to support
cognitive function. Brain activation and the flow of information in response to a stimulus is highly dependent on a functional backbone of brain synchrony occurring in the absence of stimulus. Concepts such as brain synchronization have taken center stage in our thinking, and we have come to appreciate that in order to understand human behavior, we must understand
functional brain systems that remain active, interdependent and balanced even in the absence of behavior.
It is fair to say that a new theory of brain function and behavior has not yet emerged, but a growing body of evidence points to the importance of ongoing activity and network organization for behavior. This new framework has gained traction largely as a result of studies analyzing the temporally correlated spontaneous activity in the blood-oxygenation level dependent (BOLD) signal, which has emerged as a powerful tool for mapping the brain’s functional organization. Resting functional magnetic resonance imaging (R-fMRI) measures BOLD fluctuations and has been used to define distributed and modular brain systems (Doucet et al., 2011; Carl D Hacker et al., 2013; Power et al., 2011; Yeo et al., 2011) that correspond to the functional domains in the
11
brain (Bertolero et al., 2015; Smith et al., 2009). Using this approach, several important advances have been made toward understanding the functional architecture of the human brain. Individual differences in brain connectivity at rest correlate with differences in behavior (Baldassarre et al., 2012; Smith et al., 2015; Vaidya and Gordon, 2013). Moreover, learning and therapeutic
intervention produce measurable changes in FC in relevant cortical circuits (Albert et al., 2009; Lewis et al., 2009; Tambini et al., 2010).
Learning not only modulates activation within a brain area, but also alters the strength of functional connections between brain areas. And conversely, a stroke not only damages brain tissue and de-afferents anatomically connected regions, but also alters communication in the functional network in which the lesion is embedded, and can even disrupt the dynamic balance between other networks in the brain (Fig. 1,C/D). Thus, the resulting behavioral deficit reflects not only the local effects of the lesion, but also disruptions of other networks that communicate with the one that is predominantly affected.
Figure 1-1. Progression views of brain-behavior relationships
At left, the localizationist model is depicted. Specific behaviors such as speech, arithmetic, and motor function are carried out by specific foci. Next, an association or network model is depicted. Networks of areas are responsible for broader domains of behavior such as ‘attention’. Next, an integrated system is depicted. While a brain area may carry out a specific ‘cognitive operation’, that operation may be simultaneously important to motor, attention, and language functions. Finally, the effect of a lesion to the integrated system is depicted. The loss of a single node disruptes the functional of multiple connected nodes and produces deficit in multiple behavioral domains.
12
Given the presence of multiple networks, an important issue is the relative specificity of the behavioral dysfunction in relation to the alteration of network function. Before my work began our laboratory had provided evidence in small case series’ that alterations of communication (FC) in specific networks (e.g. dorsal attention) was associated with network specific impairment (e.g. spatial attention deficits) (He et al., 2007; Carter et al., 2010). However, the specificity of such relationships across brain networks and across multiple behavioral domains was unknown. Moreover, it was unknown if these network abnormalities remain encapsulated in the network of interest or ‘spread’ and with what rules to other networks? More importantly, it was entirely unknown how relevant were these abnormalities for behavior, i.e. how much behavioral variance did they account for by structural damage versus network disruption? Finally, the relationship of network disruption to recovery was entirely unknown.
The primary goals of the research described in this thesis is to generate a holistic understanding of the relationship between local damage, global connectivity changes, and the behavioral deficits [and recovery] that follows. I aim to use this information to update the principles described above – namely, neural correlates of deficit and recovery following stroke and models of how networks in the human brain interact to support cognitive functions.
1.2
Approach
Our goals is to elucidate the relationship between stroke and deficit without a priori assumption of functional localization or isolation of deficit. This means designing experiments to answer questions such as: Do behavioral deficits tend to occur in isolation, in clusters with other deficits,
13
or along a single axis of domain-general deficit? To what extent is a behavioral deficit predicted by the location of the lesion – and does this differ between behaviors? Are deficits (and
recovery) better predicted in the individual by the location of their lesion or by disruptions to their brain connectivity? Do common network principles emerge in FC-deficit models across behavioral measures? To answer these questions, we recruited a heterogeneous sample of stroke patients and examined a wide range of neuropsychological measures (Fig. 2). This is in contrast to prior lesion-deficit and FC-deficit mapping studies that have typically recruited groups with presence or absence of a common deficit or lesion. In addition, we implement multivariate approaches (such as a multi-task learning model described in chapter 4) to remove hidden biases, quantitatively assess not just localization, but localizability, and disentangle domain-specific versus domain-general deficit-related changes in brain connectivity.
This project involves a large cohort (n=132 completing timepoint 1) of patients tested longitudinally at 3 time points that span one year, and includes 1) a behavioral battery that provides a broad and deep assessment of neurological function 2) structural scans to measure anatomy and 3) resting-state fMRI and ASL scans to measure physiology. Importantly, control subjects were matched to patients both in age, demographics, and stroke predisposition (to our best approximation). In the below work, we first determine the degree to which post-stroke hemodynamics are altered and the impact this has on measuring FC using R-fMRI. We then use lesion location and functional connectivity to test predictions about the three-way relationship between disconnection, networks disruption and clinical deficit. Finally, we attempt to
14
15
2
The effects of hemodynamic lag on functional
connectivity and behavior after stroke.
This chapter has been published as a journal article. The citation is:
Siegel, J.S., Snyder, A.Z., Ramsey, L., Shulman, G.L., and Corbetta, M. (2015). The effects of hemodynamic lag on functional connectivity and behavior after stroke. Journal of Cerebral
16
2.1
Abstract
Stroke disrupts the brain’s vascular supply, not only within but also outside of areas of
infarction. We investigated temporal delays (lag) in resting state functional magnetic resonance imaging signals in 130 stroke patients who were scanned 2 weeks, 3 months and 12 months post stroke onset. 30 controls were scanned twice at an interval of 3 months. Hemodynamic lag was determined using cross-correlation with the global gray matter signal. Behavioral performance in multiple domains was assessed in all patients. Regional cerebral blood flow and carotid patency were assessed in subsets of the cohort using arterial spin labeling and carotid Doppler
ultrasonography. Significant hemodynamic lag was observed in 30% of stroke patients sub-acutely. Approximately 10% of patients showed lag at 1-year post-stroke. Hemodynamic lag corresponded to gross aberrancy in functional connectivity measures, performance deficits in multiple domains and local and global perfusion deficit. Correcting for lag partially normalized abnormalities in measured functional connectivity. Yet post-stroke FC-behavior relationships in the motor and attention systems persisted even after hemodynamic delays were corrected. Resting state fMRI can reliably identify areas of hemodynamic delay following stroke. Our data reveal that hemodynamic delay is common sub-acutely, alters functional connectivity, and may be of clinical importance.
17
2.2
Introduction
The front matter includes all material that appears before the beginning of the body of the text. Number all front matter pages (except the title page and the optional copyright page) with lowercase roman numerals, starting with ii, centered just above the bottom margin. Each of the following sections should begin on a new page. Stroke causes a disruption to the brain’s vascular supply that leads to infarction and structural damage of gray/white matter, but also remote physiological and metabolic effects in structurally normal regions of the brain. It is becoming increasingly apparent that an understanding of behavioral deficits post-stroke and their recovery will require a complete description not only of lesion topography, but also of the complement of metabolic, structural and functional connectivity abnormalities, which in turn may relate to abnormal neuronal dynamics at the level of whole brain networks (Corbetta, 2012; Grefkes and Fink, 2014). Functional MRI is the primary tool to examine network level abnormalities caused by focal or diffuse brain diseases based on the premise of a normal coupling between neuronal activity and related blood flow/volume changes (hemodynamic response, HDR).
However, when studying disease states, a normal hemodynamic response cannot be assumed (D’Esposito et al., 2003). For instance, prior work has established that the hemodynamic response can be altered following stroke (Pineiro et al., 2002; Salinet et al., 2013). In patients with cerebrovascular disease, peak BOLD response delays of up to 20 seconds have been
reported in the affected hemisphere (Carusone et al., 2002; Bonakdarpour et al., 2007; Amemiya et al., 2012). Such responses are said to exhibit hemodynamic lags.
18
In resting state MRI (R-fMRI), functional connectivity between regions of the brain is estimated by the temporal correlation of the spontaneous BOLD signal. Two recent studies observed BOLD signal delays in R-fMRI in small cohorts (Amemiya et al., 2013; Lv et al., 2013). These studies raise concerns about how hemodynamic lags might be affecting measurement of
functional connectivity after stroke.
In this study we address fundamental questions concerning cerebrovascular physiology in stroke, specifically concerning the importance of hemodynamic lags in relation to changes of functional connectivity (FC), regional cerebral blood flow (rCBF) or diaschisis, as well as behavior and recovery. We report on a longitudinal study of hemodynamic lag in a cohort of 130 first time ischemic and hemorrhagic stroke patients. We consider the longitudinal trends, physiological correlates, and clinical implications of hemodynamic lag. We demonstrate a relationship between lag, and decrements of blood flow, and severity of clinical deficits after stroke. We also
demonstrate that lag profoundly affects measures of FC and we investigate the effects of hemodynamic lag on previously reported FC-behavior relationships. Finally, we test a method for correcting for hemodynamic lag in measures of functional connectivity.
19
2.3
Methods
2.3.1
Patient Enrollment
All aspects of this study were approved by the Washington University School of Medicine (WUSM) Internal Review Board. Written informed consent was obtained from all participants in accordance with the Helsinki Declaration and procedures established by the Washington
University in Saint Louis Institutional Review Board and all participants were compensated for their time. First time stroke patients were recruited by a research coordinator through the in-patient service at Barnes-Jewish Hospital (BJH) and the Rehabilitation Institute of St. Louis (TRISL). Inclusion criteria for stroke patients were: 1) Age 18 or greater, 2) first symptomatic stroke, ischemic or intraparenchymal hemorrhagic etiology, 3) clinical evidence of motor,
language, attention, visual, or memory deficits based on neurological examination, and 4) time of enrollment < 2 weeks post-stroke onset. Exclusion criteria were: 1) the inability to maintain wakefulness during testing, 2) the presence of other neurological, psychiatric or medical
conditions that preclude active participation in research and/or may alter the interpretation of the behavioral/imaging studies (e.g., dementia, schizophrenia), or limit life expectancy to less than 1 year (e.g., cancer or congestive heart failure class IV), 3) evidence of clinically significant periventricular white matter disease (equal or above grade 5 of Longstreth and
colleagues(Longstreth et al., 1996)), and 4) contraindications for MRI including claustrophobia or scanner incompatible implants. In total, 6260 charts were screened; 130 patients met all inclusion criteria and completed the entire sub-acute protocol (mean age 52.8 with range 22-77,
20
119 right handed, 61 female, 64 right hemisphere). Of those, 101 had ischemic strokes, 21
hemorrhagic, 5 ischemic with later hemorrhagic conversion, and 3 carotid or vertebral dissection. Other features of the patient cohort and lesion distribution were described previously(Corbetta et al., 2015).
2.3.2
Stroke Source Population
We conducted a control analysis to determine whether our stroke sample was representative of the general stroke population. The demographic and medical characteristics of the patients in our sample were compared to those of a large control group (n = 1,209) that was selected from the Cognitive Rehabilitation Research Group database(Wolf et al., 2009) of all patients seen at Barnes Jewish Hospital between 2008 and 2013 (n = 6,260) using the same inclusion/exclusion criteria. All included stroke and control subjects provided informed consent according to procedures approved by the Institutional Review Board at Washington University.
2.3.3
Healthy Control Enrollment
Thirty healthy, demographically matched control subjects were recruited and underwent the same behavioral and imaging exams. Inclusion criteria for control subjects were: healthy adult matched to stroke study population by age, gender, handedness, and level of education.
Exclusion criteria were: 1) a positive history of neurological, psychiatric, or medical abnormalities preventing participation in research activities, 2) a history of atherosclerotic (coronary, cerebral, peripheral) artery disease, 3) an abnormal neurological examination with
21
signs of CNS dysfunction. The average age at the time of enrollment was 55.7 years (SD=11.5) with a range from 21 to 83 years.
2.3.4
R-fMRI acquisition and analysis
Patients were studied 2 weeks (mean=13.4 days, SD=4.8 days), 3 months (mean=112.5 days, SD=18.4 days), and 1 year (mean=393.5 days, SD=55.1 days) post-stroke onset. Controls were studied twice at an interval of 3-months. All imaging was performed using a Siemens 3T Tim-Trio scanner at the Washington University School of Medicine (WUSM) and the standard 12-channel head coil. The MRI protocol included structural, functional, pulsed arterial spin labeling (PASL) and diffusion tensor scans. Structural scans included: (1) a sagittal T1-weighted MP-RAGE (TR=1950 msec, TE=2.26 msec, flip angle=90°, voxel size=1.0´1.0´1.0 mm); (2) a transverse T2-weighted turbo spin-echo (TR=2500 msec, TE=435 msec,
voxel-size=1.0´1.0´1.0mm); and (3) sagittal FLAIR (fluid attenuated inversion recovery) (TR=7500 msec, TE=326 msec, voxel-size=1.5´1.5´1.5mm). PASL acquisition parameters were: TR=2600 msec, TE=13 msec, flip angle=90°, bandwidth 2.232 kHz/Px, and FoV 220mm. 120 volumes were acquired (322 seconds total), each containing 15 slices with slice thickness 6 mm and 23.7mm gap. Resting state functional scans were acquired with a gradient echo EPI sequence (TR=2000 msec, TE=27 msec, 32 contiguous 4 mm slices, 4´4mm in-plane resolution) during which participants were instructed to fixate on a small cross in a low luminance environment. Central fixation and wakefulness were monitored with an eye tracker and recorded. Six to eight R-fMRI runs, each including 128 volumes (30 min total), were acquired.
22
Participants with less than five minutes of retained R-fMRI data after strict motion scrubbing were excluded from further analysis. The fraction of participants providing useful fMRI data was 107/130 patients at 2 weeks, 86/94 patients at 3 months, 74/82 patients at 1 year, 24/30 controls at scan 1, and 24/29 controls at scan 2 (Table S1).
2.3.5
R-fMRI Data Preprocessing
R-fMRI data underwent preprocessing as previously described by Baldassarre and
colleagues(Baldassarre et al., 2014a). Briefly, this included: 1) compensation for asynchronous slice acquisition using sinc interpolation; 2) elimination of odd/even slice intensity differences resulting from interleaved acquisition; 3) whole brain intensity normalization to achieve a mode value of 1000; 4) spatial realignment within and across R-fMRI runs; and 5) resampling to 3mm cubic voxels in atlas space including realignment and atlas transformation in one resampling step. Cross-modal (e.g., T2-weighted to T1-weighted) image registration was accomplished by aligning image gradients(Rowland et al., 2005). Cross-model image registration in patients was checked by comparing the optimized voxel similarity measure to the 97.5 percentile obtained in the control group. In some cases, structural images were substituted across sessions to improve the quality of registration.
2.3.6
Lesion Segmentation
Lesions were manually segmented using Analyze (www.mayo.edu) by inspection of the
structural images (T1-weighted, T2- weighted, FLAIR), simultaneously displayed in atlas space. All segmentations were reviewed by two neurologists (Maurizio Corbetta and Alexandre Carter)
23
with special attention to distinguishing lesion from CSF and hemorrhage from surrounding vasogenic edema. The lesions ranged from 0.02cm3 to 82.97cm3 with a mean of 10.15cm3
(SD=13.94cm3).
2.3.7
Pulsed ASL and Carotid Doppler
Pulsed arterial spin labeling (PASL) measures of regional cerebral blood flow (rCBF) were acquired in a subset of patients (27 sub-acute patients and 20 controls). Two proximal inversion with control for off-resonance effects (PICORE Q2) PASL-MRI perfusion scans were collected. PASL data were processed as described previously(Arbeláez et al., 2013). Normalized perfusion (percent of control average) was determined for a set of 169 regions of interest (ROIs) described below. Bilateral carotid Doppler was also acquired at initial post-stroke hospital admission for 66 of the included patients. Carotid Doppler velocity values were converted to categories of 1) ≤50% occlusion, 2) 51-79% occlusion, or 3) ≥80% occlusion, based on guidelines from the Society of Radiologists in Ultrasound Consensus Conference(Grant et al., 2003). PASL and carotid Doppler were compared with R-fMRI measures of local (region of interest) and global (affected hemispheric) lag to determine how perfusion measures associate with lag.
2.3.8
Behavioral Testing
All subjects and controls underwent a behavioral battery that included assessment of motor, language, attention, memory, and visual function following each scanning session. Overall clinical deficit was also assessed in each patient using the NIH stroke scale (NIHSS)(Brott et al., 1989). Imaging and behavioral testing session usually were performed on the same day.
24
Dimensionality reduction was performed on the behavioral performance data as described previously(Corbetta et al., 2015). Principal components analysis was performed on all tests within a behavioral domain to produce a single score that predicted the majority of variance across tasks. The ‘Motor’ score describes contralesional deficits that correlated across shoulder flexion, wrist extension/flexion, ankle flexion, hand dynamometer, nine hole peg, action research arm test, timed walk, functional independence measure, and the lower extremity motricity index. The ‘Attention (visual field)’ score describes contra-lesional visual field effects in Posner, Mesulam, and BIT center of cancellation tasks. A separate ‘Attention (sustained)’ score loaded on non-spatial measures of overall performance, reaction time, and accuracy on the same tests. The ‘Spatial Memory’ score loaded on the Brief Visuospatial Memory Test and spatial span. The ‘Verbal Memory’ score loaded on the Hopkins Verbal Learning Test. The ‘Language’ score loaded on both comprehension (complex ideational material, commands, reading
comprehension) and production (Boston naming, oral reading).
2.3.9
ROIs
A set of 169 regions of interest (ROIs), which was defined based on Hacker and colleagues(Carl D Hacker et al., 2013), were used in post hoc analyses. Briefly, the ROIs were selected based on a meta-analysis of task fMRI studies and refined to optimally represent 7 resting state networks. ROI-based analysis was used for 1) lag laterality measurement, 2) resting BOLD power analysis, and 3) FC analyses. ROIs partially or entirely overlapping with the infarct were excluded from all analyses (excepting the within-lesion BOLD power analysis).
25
Gray matter, white matter, and CSF ROIs were defined in individual subjects using automated segmentation by FreeSurfer(Fischl, 2012) and excluding any voxels that overlapped with the manual segmented lesion masks.
2.3.10
Lag measure
The R-fMRI data were first temporal bandpass filtered, retaining frequencies between 0.009-0.09Hz. Next, frame censoring identified volumes with a DVARS measure > 0.6% or a
framewise displacement > 0.5mm to be excluded from the R-fMRI computations(Power et al., 2012). A shift mask was then generated by removing every frame within 4TR of masked frames. A minimum of 150 usable frames was required for subject inclusion in the present results. Thus, 23/130 sub-acute patients and 6/30 controls were excluded. In the retained data, on average, 570 out of 870 frames remained in sub-acute patients, and 495 of 851 frames remained in controls (Table S1). Next, a reference signal was generated from the average timecourse in each subject’s [non-lesion] gray matter ROI.
26
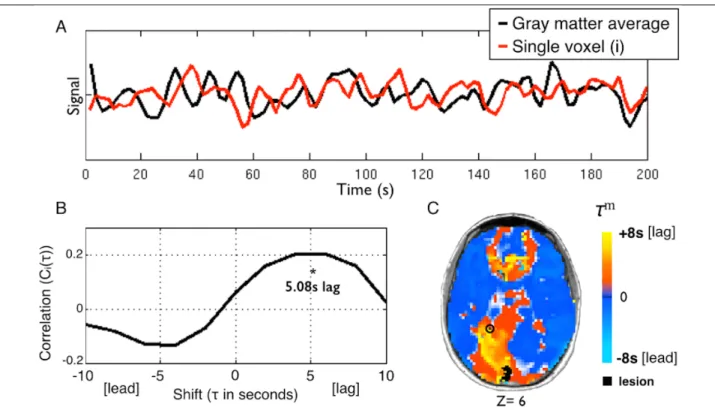
Figure 2-1 Using temporal cross-correlation to measure lag in resting state fMRI.
A) The global reference signal (black line, top panel) is measured by averaging all non-lesioned gray matter voxels. Each voxel timecourse (red line, top panel) is then compared to the reference signal. The exemplar voxel is circled in C. B) The voxel timecourse is shifted forward and backward 8s (±4 TR) and shift correlation is computed (Eq. 1). 5.08s is the optimal shift determined by parabolic interpolation. C) Voxelwise hemodynamic lag image.
Orange/yellow indicates a lag behind the reference signal, cyan indicates a lead. Lesioned areas are shown in black. A small caudal infarct in left posterior cerebral artery (PCA) territory shows associated lag in the entire left PCA distribution. A full lag map for this individual is shown in row 5 of Figure 2.
Lagged cross-correlation analysis with reference to the global gray matter reference signal was performed for each voxel over the range ±4 TRs (±8 seconds) (Figure 1):
𝐶"(𝜏) = (1 𝑛)) *(+)⋅-.(+/))
01.02
+ , (1)
where g is the gray matter signal, 𝑠"is the signal in voxel 𝑖, and
𝜎
-. and𝜎
*are the standarddeviations of the two signals. The summation runs over frames indexed by 𝑡, and 𝑛) is the number of frames included after a shift of 𝜏 (-8s to +8s). To determine the shift that maximizes
27
the cross-correlation function at a temporal resolution finer than 1TR, the lag (𝜏) corresponding to the maximum of 𝐶" 𝜏 was identified. 𝐶" 𝜏 at this lag, as well as one step forward and backward, were fit with a parabolic function and the peak value, 𝐶" 𝜏9 , and corresponding temporal shift (τm) were computed(Mitra et al., 2014). Positive and negative values of τm
correspond, respectively, to a lag or lead relative to the mean gray matter signal. The lag
measure, 𝜏9, was computed for every voxel within the brain. Voxels within the lesion as well as voxels not positively correlated with the global signal on the interval, −8 < 𝜏 < +8 (in units of seconds), were excluded from region of interest and FC analyses. For visualization, lag maps were smoothed with a 3mm full width at half maximum kernel.
2.3.11
Lag Laterality
Inspection of lag maps demonstrated that lags > 2 sec almost always were confined to the lesioned hemisphere. Thus, it was possible to compute lag laterality scores as a measure of average lag difference in the affected versus unaffected hemisphere. Lag laterality was computed for each patient by finding the average lag for each of the 169 ROIs (excluding those intersecting the lesion) and then computing the difference between all right hemisphere ROIs (78/169) and all left hemisphere ROIs (78/169). The reliability of measured lag maps as well as laterality scores theoretically depends on the quantity of available data(Lv et al., 2013). These relationships were estimated using data subsamples of duration 40s to 800s.
28
The lag laterality score was used to compare lag severity to clinical variables. Because lag laterality values were not normally distributed, lag laterality was compared with categorical variables using a Mann-Whitney U test, and to continuous variables using Spearman’s rank test.
2.3.12
Resting state BOLD power analysis
The BOLD signal power across the low frequency range typically used for resting state FC (0.009-0.09Hz) was computed on all ROI timecourses in all sub-acute subjects. ROIs were then subdivided into three categories: 1) ROIs partially or wholly within a lesion, 2) ROIs that show greater than 2 seconds of lag, 3) all other ROIs. The average power spectrum was then computed for each category.
2.3.13
Correcting functional connectivity measures for hemodynamic lag
Hemodynamic lags theoretically distort FC measures in a manner that is potentially correctible. To address this question, corrected FC measures were computed by shifting regional timeseries according to the previously determined hemodynamic lags. In greater detail, for any pair of signals, one of the timeseries was shifted by the lag difference and this difference was rounded to the nearest TR to avoid timeseries interpolation. FC was then computed using the standard formula (Fisher z-transformed Pearson correlation ≡ 𝑧(𝑟)). The correction procedure was used to create corrected FC maps for selected ROIs. In addition, indices of interhemispheric FC in the motor system were computed with and without correcting for hemodynamic lag. This index was computed as the average z(r) over multiple motor ROI pairs (10 in the left hemisphere, 12 in the right hemisphere), excluding any ROI compromised by lesion.