Modeling Driving Behavior at
Roundabouts: Impact of Roundabout
Layout and Surrounding Traffic on Driving
Behavior
M. Zhao∗D. K¨athner∗ D. S¨offker∗∗ M. Jipp∗ K. Lemmer∗
∗Institute of Transportation Systems, German Aerospace Center (DLR), Braunschweig, Germany (e-mail: {min.zhao, david.kaethner,
meike.jipp, karsten.lemmer}@dlr.de).
∗∗Chair of Dynamics and Control, University of Duisburg-Essen, Duisburg, Germany (e-mail: [email protected])
Abstract: Driving behavior prediction at roundabouts is an important challenge to improve driving safety by supporting drivers with intelligent assistance systems. To predict the driving behavior efficiently steering wheel status was proven to have robust predictability based on a Support Vector Machine algorithm. Previous research has not considered potential effects of roundabout layout and surrounding traffic on driving behavior, but that consideration can certainly improve the prediction results. Therefore, this study investigated how roundabout layout and surrounding traffic impact driving behavior of an ego car. A simulator study was conducted to collect driving behavior data with different roundabout layout settings and different surrounding cyclist position settings. The local minima/maxima of the steering angle was found to have a logarithmic relationship with the roundabout geometric feature. The impact of the surrounding traffic on the ego driver behavior was also found: When there were surrounding cyclists, the recognition rate of ego driver behavior patterns reached 100% later than when there was no surrounding traffic. In conclusion, driving behavior at roundabouts is effected by both roundabout layout and surrounding traffic, and the relationship can be expressed in a quantitative way.
Keywords:Driving pattern recognition; Regression; Support Vector Machine; Advanced Driving Assistance Systems.
1. INTRODUCTION
Roundabouts are safer than traditional signal-controlled or stop sign intersections for car drivers, but there are still many crashes happening with cyclists at roundabouts, see Hels and Orozova-Bekkevold (2007). Herslund and Jørgensen (2003) have pointed out that crashes between vehicles and bicycles happen partly because of the event “looked but failed to see” of car drivers. According to Werneke and Vollrath (2013), the implementation of warn-ing systems in cars is helpful for decreaswarn-ing the probability of such crashes. To give a suitable alarm to car drivers, warning systems need to reliably predict the future behav-ior of drivers at roundabouts as early as possible. Thus, in this study, the behavior of car drivers in different scenarios at roundabouts was analyzed to improve the result of driving behavior prediction at roundabouts.
1.1 Motivation
Roundabouts are considered important road infrastructure because converting an intersection into a roundabout has caused fewer injury accidents for both, motor car drivers and pedestrians, see Elvik et al. (2009), Retting et al. (2001), and Hyd´en and V´arhelyi (2000). However, the
effect on cyclists’ safety is negative. According to the study of Daniels et al. (2010) in Belgium, roundabouts increased cyclist injury accidents by 27% and fatal accidents by 41–46%. The most dangerous situations are the ones in which (a) a car enters a roundabout when a cyclist is circulating and (b) in which they both circulate in parallel and the car driver exits the roundabout, see Sakshaug et al. (2010). These accidents can be decreased when in-car warning systems issue warnings to their drivers in case they overlook a potential risk. Warning systems work efficiently if they can predict their drivers oncoming behav-ior precisely and then implement an appropriate warning strategy, see He et al. (2012). To develop a driving behavior prediction model that works for all roundabouts with dif-ferent layout design and difdif-ferent traffic situations, it needs to be known how roundabout layouts and surrounding traffic effect the driving behavior at roundabouts.
1.2 State of the Art
Many studies have focused on driving behavior predic-tion in the scenarios on motor way and (urban) inter-sections. Pentland and Liu (1999), Kuge et al. (2000), and Mizushima et al. (2006) assumed that future human behavior was a sequence of internal mental states that
could not be observed but predicted by abstracting the observable present behavior, so Hidden Markov Models (HMM) were used for predicting driver behavior. In the study of Tango and Botta (2009), three machine learning techniques were compared for predicting driver behavior on motor way: Neural Network (NN) and Support Vector Machine (SVM) had comparable performances on car-following/lane-changing classification with 99% recogni-tion rate; HMM achieved 97% recognirecogni-tion rate for three patterns: car following, lane changing, and lane keeping on free lane. Lef`evre et al. (2011) proposed a Bayesian network which combined the driving behavior and the information about geometric and topological characteris-tics of road intersections to infer driver future behavior. Liebner et al. (2013) proposed a Bayesian network model to predict driving behavior in the presence of preceding vehicles. In these studies, driving behavior prediction was proposed in use of machine learning algorithms.
Other studies were in the focus of driving behavior at roundabouts. St-Aubin et al. (2013) and Mudgal et al. (2014) modeled speed profiles at roundabouts and con-cluded that speed profiles differed significantly across drivers and roundabouts. Zhao et al. (2017) focused on three specific roundabouts and predicted whether a driver would leave the roundabout with an SVM algorithm. The prediction rate was higher than 90% at a distance of approximately 10 m before the exit of the roundabouts. The results showed that 1) the data of steering wheel angle and steering wheel angle velocity were effective features to recognize two different driver behavior patterns at round-abouts (the pattern of staying at roundround-abouts and the pattern of leaving roundabouts), and 2) steering wheel had different stati depending on different roundabout layouts. Therefore, three different prediction models were devel-oped for three types of scenarios which were categorized based on the geometric characteristics of the roundabouts. This study can be criticized because the models work only on these specific roundabouts. In addition, surrounding traffic was not considered. Thus, a model predicting driv-ing behavior at generic roundabouts and with surrounddriv-ing traffic is still missing.
1.3 Research Questions
This study addressed two questions to realize the driving behavior prediction at generic roundabouts with different layouts and different traffic situations:
(1) How does roundabout layout, i.e., geometric design impact the driving behavior?
(2) How does surrounding traffic impact the results of driving behavior pattern recognition with steering wheel status?
2. METHOD
A simulator study was conducted to acquire driving behav-ior data of thirteen participants with a driving simulator. The simulator uses a projection system with a field of view forward and to the sides (270◦×40◦) and a complete ve-hicle. A within-subject design was applied in two different parts of the study: the first part focused on the research question (1) and the second part focused on the research question (2).
2.1 Impact of Roundabout Layout on Driving Behavior Simulator study This study assumed that the main fac-tors that impacted driving behavior were 1) the diameter of a roundabout and 2) the angle between the entry of the roundabout and the exit that the driver takes to leave the roundabout. Here, the angle was defined as exit-angle. Therefore, roundabout diameter and entry-exit-angle were used as two independent variables in the scenario design: the variable diameter had two levels with 40 m and 26 m, and the variable entry-exit-angle had seven levels with 90◦, 120◦, 150◦, 180◦, 210◦, 240◦ and 270◦.
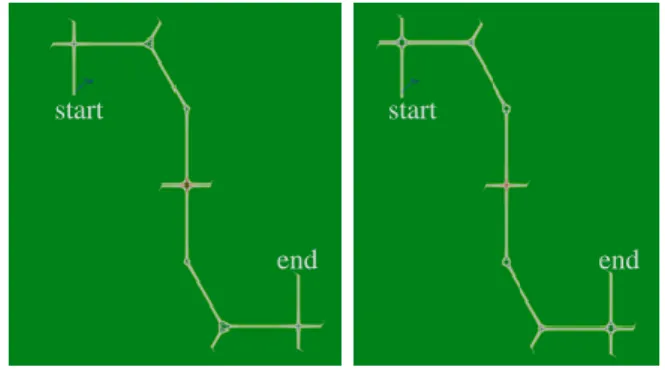
These values were selected because 1) in real world it is rare that the angle between two arms is less than 90◦ be-cause it would make turning very difficult, 2) according to the road design standard in Germany, see Hofmann (2014), the single-lane modern roundabouts are implemented with diameter 26 m – 40 m in most cases. Roundabouts with diameters less than 26 m are defined as mini-roundabouts, which are not in the focus of this study. Then the resulting 14 roundabouts (seven levels of entry-exit-angle and two levels of diameter) were connected in two tracks in random order (see Fig. 1), so that all the roundabouts with 7×2 factor combinations were tested. In the study, the partici-pants were asked to drive through each track three times, and their driving behavior data (steering angle, steering angle velocity, acceleration, velocity, and position) were acquired.
start
end
start
end
Fig. 1. Tracks for simulator study
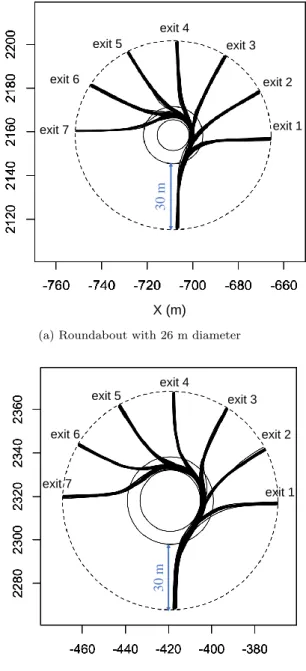
Data pre-processing After data acquisition, the driving data at the roundabouts were selected for driving behavior analysis. The data were selected within a zone that was a circle with the diameter 30 m larger than the roundabout diameter, and the data outside of this boundary were removed. Then the car position data of all the drives were moved and rotated so that all drives had the same entry of the same roundabout, see Fig. 2. Seven exits corresponded seven values of entry-exit-angle and were numbered as exit 1 to exit 7. Thus, the data were ready for driving behavior analysis.
Correlation between steering wheel angle and roundabout layout Steering wheel status was an effective factor to predict driving behavior at roundabouts, and the steering wheel had different stati depending on different round-about layouts, see Zhao et al. (2017). To improve the predictability of the steering wheel status, this study in-vestigated the quantitative relationship between steering
30 m Y (m) X (m) exit 1 exit 2 exit 3 exit 4 exit 5 exit 6 exit 7
(a) Roundabout with 26 m diameter
30 m exit 1 exit 2 exit 3 exit 4 exit 5 exit 6 exit 7 Y (m) X (m)
(b) Roundabout with 40 m diameter
Fig. 2. Data selection with dashed circle
angle and roundabout layout. In this section, local min-ima/maxima of steering angle (θmax) was proposed to
characterize the steering wheel status, and roundabout geometric feature (Fgeo) was proposed to characterize the
roundabout layouts. The mathematical correlation of these two variables was calculated to explain how the round-about layouts impact steering wheel angle in a quantitative way.
Fig. 3 (a) depicts the values of the steering wheel angle when the participants drove through the different seven exits of the roundabouts with 26 m diameter. The x-axis is the distance from the point on the drive to start point. The start point is the first point of the drive and 30 m away from the roundabout which was acquired with the boundary circle in Fig. 2. Values less than zero mean that the position of the steering wheel was at right, and vice versa. For the drives through exit 1, the steering wheel
had three movement processes: it was turned to the right to enter the roundabouts, and then kept at a right position to leave the roundabouts, and, at last turned to the middle to drive straight. Therefore, there is a minimum value of the steering angle in the middle of the drive, see the grey line in Fig. 3 (a). For the drives through the other six exits, the steering wheel had four movement processes: it was turned to the right to enter the roundabouts, and then turned to the left to follow the roundabouts, and then turned to the right to leave the roundabouts, and at last turned to the middle to drive straight. Therefore, there is a peak in the middle of each drive, see the local maximum of other six colored lines. Fig. 3 (b) depicts the situation for the drives through the seven different exits of the roundabouts with 40 m diameter. Its difference from the situation for the roundabouts with 26 m diameter is that the steering wheel for the drives through all seven exits had four movement processes. The reason is that at the roundabouts with diameter as large as 40 m, the drivers needed to turn the steering wheel to the left to follow the roundabouts even when taking the closest exits (exit 1). So, there are peaks in the middle of all the drives, see the local maximum of the seven colored lines. These minimum and maximum values of steering wheel angle were defined as local minima/maxima steering angle (θmax).
Distance to start point (m)
St ee rin g w he el an gle (r ad ) through exit 7 through exit 6 through exit 5 through exit 4 through exit 3 through exit 2 through exit 1
(a) At roundabouts with 26 m diameter
Distance to start point (m)
St eer ing wh eel angle (r ad) through exit 7 through exit 6 through exit 5 through exit 4 through exit 3 through exit 2 through exit 1
(b) At roundabouts with 40 m diameter
Fig. 3. Steering wheel angle for driving through each exit of roundabouts
Another variable that characterized the roundabout lay-outs and had strong correlation withθmax was defined as
roundabout geometric feature:
Fgeo=ϕ2·r, (1)
where Fgeo is roundabout geometric feature, ϕ is
entry-exit-angle, andris roundabout radius.
The logarithmic correlation between θmax and Fgeo was
calculated with a regression analysis to investigate their quantitative relationship. As shown in equation (2) and (3), and Fig. 4, The relationship was divided into two stages:
whenFgeo≤F0,
θmax=a·log(Fgeo) +b, (2)
and whenFgeo> F0,
θmax=θ0, (3)
whereFgeois roundabout geometrical feature, andθmaxis
local minima/maxima of steering angle.
𝐹𝑔𝑒𝑜= 𝐹0 𝜃𝑚𝑎𝑥= 𝜃0
2
Fig. 4. Relationship between local minima/maxima steer-ing angle and roundabout geometic feature
2.2 Impact of Surrounding Traffic on Driving Behavior
Simulator study In this part, the question how the
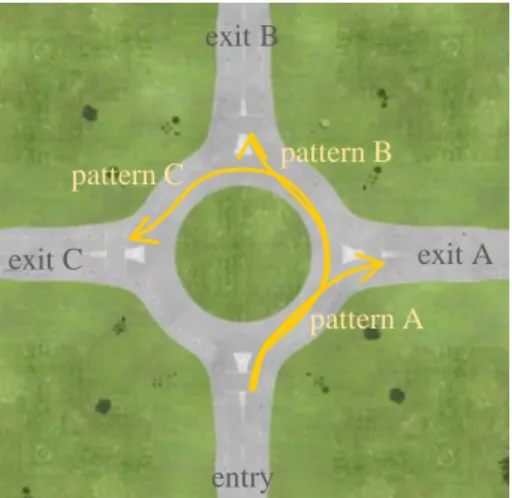
surrounding cyclists impact the results of the driving behavior pattern recognition was addressed. A four-arm roundabout with 40 m diameter was used to design the scenarios, in which, there were three possible driving patterns, see Fig. 5: Pattern A was that the driver took exit A to leave roundabout, and pattern B and pattern C were that the driver took exit B and exit C respectively to leave roundabout. To predict the driving behavior of which exit the driver would take, recognition of two pairs of driving patterns had to be executed: 1) recognition of pattern A and pattern B, and then 2) recognition of pattern B and pattern C. Zhao et al. (2017) proved that the steering wheel status had the ability to recognize these patterns effectively when there was no surrounding traffic. Here, to investigate the impact of surrounding traffic on the
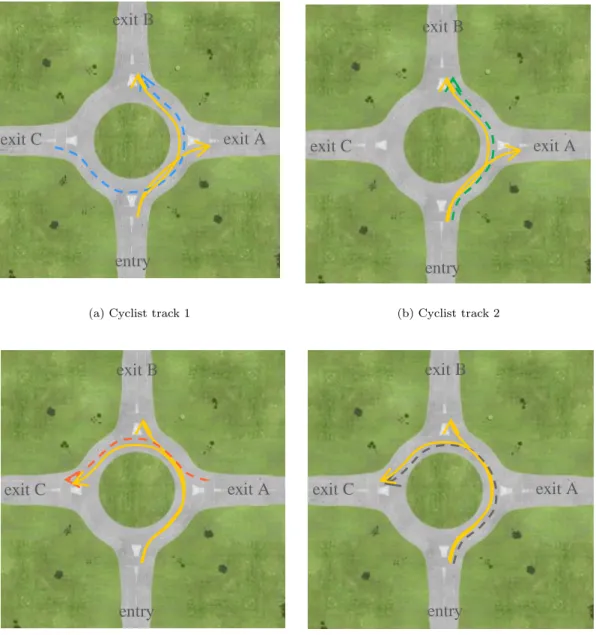
recognition results, the cyclists were placed in following scenarios: in the scenario illustrated in Fig. 6 (a), when the ego driver entered the roundabout and intended to take exit A or exit B to leave the roundabout (see the yellow solid lines), cyclists entered the roundabout from left through exit C and left the roundabout through exit B (see the blue dashed line). With this setting, driving pattern A and pattern B with cyclist disturbance were observed and the recognition of these two patterns were executed. Similarly, in the scenarios illustrated in Fig. 6 (b) (c) (d), the cyclists with other three types of circulating tracks (see the dashed lines) were placed to cause effects on the different driving patterns (see the solid lines) and the recognition of patterns were also executed. Then, the resulting eight roundabouts (four types of cyclist circulating tracks and two pairs of pattern recognition) were connected in two tracks in random order. The participants were asked to drive through each track three times, and their driving behavior data (steering angle, steering angle velocity, acceleration, velocity, and position) were acquired.
pattern A pattern B pattern C exit A exit B exit C entry
Fig. 5. Three typical driving patterns at roundabouts
Data pre-processing The driving data at the
round-abouts were also selected within a circle with the diameter 30 m larger than the roundabout diameter. Then the car position data of all the drives were moved and rotated so that all drives had the same entry of the same roundabout. Thus, the data were ready for driving behavior pattern recognition.
Driving behavior pattern recognition in the scenarios with surrounding traffic The recognition of the following driv-ing patterns was executed with the data from simulator study to investigate the impact of surrounding traffic.
(1) recognition of pattern A and pattern B without traffic,
(2) recognition of pattern A and pattern B with the cyclists in the scenario illustrated in Fig. 6 (a), (3) recognition of pattern A and pattern B with the
cyclists in the scenario illustrated in Fig. 6 (b), (4) recognition of pattern B and pattern C without
traffic,
(5) recognition of pattern B and pattern C with the cyclists in the scenario illustrated in Fig. 6 (c),
exit A
exit B
exit C
entry
(a) Cyclist track 1
exit A
exit B
exit C
entry
(b) Cyclist track 2exit A
exit B
exit C
entry
(c) Cyclist track 3exit A
exit B
exit C
entry
(d) Cyclist track 4Fig. 6. Scenarios with different cyclist tracks
(6) recognition of pattern B and pattern C with the cyclists in the scenario illustrated in Fig. 6 (d). The steering wheel angle and the steering angle speed were used as features to make the pattern recognition with SVM algorithm as a classifier. Herewith, the recognition results of the patterns without traffic were compared with the results for the scenarios with cyclists to check how sur-rounding traffic impact driving behavior at roundabouts.
3. RESULT
3.1 Results of Correlation Between Steering Wheel Angle and Roundabout Layout
The quantitative relationship between roundabout geo-metric feature (Fgeo) and local maximum steering angle
(θmax) was:
whenFgeo≤174.6rad2·m,
θmax= 3.60·log(Fgeo)−15.02, (4)
and whenFgeo>174.6rad2·m,
θmax= 3.59, (5)
whereFgeois roundabout geometrical feature, andθmaxis
local minima/maxima of steering angle.
It can be found that, when the roundabout geometric feature Fgeo is smaller than 174.6 rad2 ·m, local
min-ima/maxima of steering angle θmax is logarithmically
re-lated to Fgeo. The coefficient of determination R2 is as
high as 0.9254. When Fgeo is larger than 174.6rad2·m, θmaxkeeps constant.
3.2 Results of Driving Behavior Pattern Recognition in the Scenarios with Surrounding Traffic
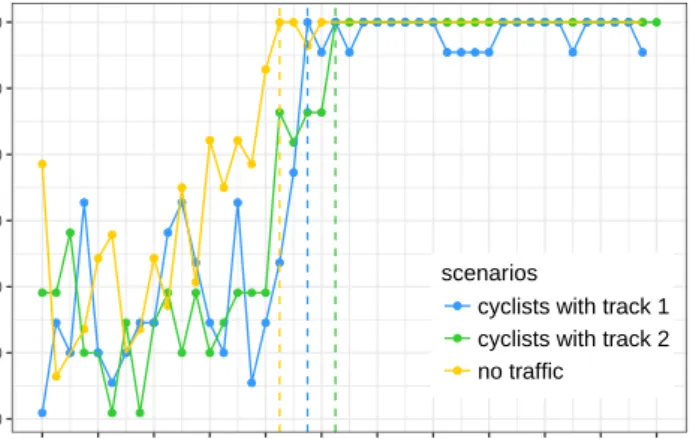
Fig. 7 and Fig.8 depict the results of driving behavior pattern recognition in the different scenarios. The x-axis is the distance from the point where the recognition was executed to start point. The y-axis is the recognition rate that was calculated as the ratio between the number of instances correctly recognized and the number of instances presented in the test dataset. The details of the results are as follows:
In Fig. 7, the yellow dotted line shows the recognition results for the pattern A/B in the scenario without traffic. The recognition rate reaches an accuracy of 100% at the position with a distance of 34 m to the start point. The blue dotted line and the green dotted line depict the recognition results for the scenarios with cyclists left of the ego car and cyclists from back of the ego car that are illustrated in Fig. 6 (a) and (b) respectively. In the scenario with the cyclists left of the ego car, the recognition rate reaches 100% at the position with a distance of 38 m to the start point; in the scenario with the cyclists approaching the ego car from the back, the recognition rate reaches 100% at the position with a distance of 42 m to the start point. For patterns A/B in both of two scenarios with cyclists, the recognition rates reach 100% later than in the scenario without traffic.
In Fig. 8, the yellow dotted line shows the recognition results for the pattern B/C in the scenario without traffic. The recognition rate reaches an accuracy of 100% at the position with a distance of 60 m to the start point. The red dotted line and the dark grey dotted line are the recognition results for the scenarios illustrated in Fig. 6 (c) and (d). In the scenario with the cyclists right of the ego car, the recognition rate reaches 100% at the position with a distance of 68 m to the start point; in the scenario with the cyclists approaching the ego car from the back, the recognition rate reaches 100% at the position with a distance of 66 m to the start point. For patterns B/C in both of two scenarios with cyclists, the recognition rates reach 100% also later than in the scenario without traffic.
40 50 60 70 80 90 100 0 8 16 24 32 40 48 56 64 72 80 88
Distance to start point (m)
Recognition r
ate (%)
scenarios
cyclists with track 1 cyclists with track 2 no traffic
Fig. 7. Results of pattern A/B recognition for scenarios with/without cyclists 30 40 50 60 70 80 90 100 0 8 16 24 32 40 48 56 64 72 80 88 96 104
Distance to start point (m)
Recognition r
ate (%)
scenarios
cyclists with track 3 cyclists with track 4 no traffic
Fig. 8. Results of pattern B/C recognition for scenarios with/without cyclists
4. CONCLUSION
The results showed that, during driving at roundabouts, the steering wheel angle had different stati with differ-ent roundabout layouts. When roundabout geometic fea-ture Fgeo was smaller than a specific value, local
min-ima/maxima of steering angle θmax was logarithmically
related to Fgeo with a very high coefficient of
determi-nation. When Fgeo was larger than the value, θmax kept
constant. The reason of this phenomenon is still missing in this study, which should be the focus of future work. The future work should also focus on categorizing the roundabout layouts with the relationship between θmax
and Fgeo to improve the performance of the driving
be-havior prediction.
The results also showed that, when there were surrounding cyclists that might have the risk of crashing with an ego car, the driving pattern recognition rate reached 100% later than in the scenario without traffic, no matter which direction the cyclists came from. It can be assumed that the results depend on the used classifier and the input features, and the selection of classifier and features is missing in this study. Therefore, future work should also focus on the other features and algorithms to improve the pattern recognition rate in the scenario with surrounding traffic.
In conclusion, the impact of roundabout layout and sur-rounding traffic on driving behavior at roundabouts can be expressed in a quantitative way. The reason of this impact and its use in behavior prediction can be focus of future work.
REFERENCES
Daniels, S., Brijs, T., Nuyts, E., and Wets, G. (2010). Ex-plaining variation in safety performance of roundabouts.
Accident Analysis & Prevention, 42(2), 393–402. Elvik, R., Høye, A., Vaa, T., and Sørensen, M. (2009).
The handbook of road safety measures. Emerald Group Publishing Limited.
He, L., Zong, C.f., and Wang, C. (2012). Driving inten-tion recogniinten-tion and behaviour predicinten-tion based on a double-layer hidden markov model. Journal of Zhejiang University SCIENCE C, 13(3), 208–217.
Hels, T. and Orozova-Bekkevold, I. (2007). The effect of roundabout design features on cyclist accident rate.
Accident Analysis & Prevention, 39(2), 300–307. Herslund, M.B. and Jørgensen, N.O. (2003).
Looked-but-failed-to-see-errors in traffic. Accident Analysis & Prevention, 35(6), 885–891.
Hofmann, U. (2014). Manual for road construction (Ger-man: Planungshandbuch Straßen- und Wegebau). Forum Verlag Herkert GmbH.
Hyd´en, C. and V´arhelyi, A. (2000). The effects on safety, time consumption and environment of large scale use of roundabouts in an urban area: a case study. Accident Analysis & Prevention, 32(1), 11–23.
Kuge, N., Yamamura, T., Shimoyama, O., and Liu, A. (2000). A driver behavior recognition method based on a driver model framework. Technical report, SAE Technical Paper.
Lef`evre, S., Laugier, C., Iba˜nez-Guzm´an, J., and Bessiere, P. (2011). Modelling dynamic scenes at unsignalised road intersections. Ph.D. thesis, INRIA.
Liebner, M., Klanner, F., Baumann, M., Ruhhammer, C., and Stiller, C. (2013). Velocity-based driver intent infer-ence at urban intersections in the presinfer-ence of preceding vehicles.IEEE Intelligent Transportation Systems Mag-azine, 5(2), 10–21.
Mizushima, T., Raksincharoensak, P., and Nagai, M. (2006). Direct yaw-moment control adapted to driver behavior recognition. In SICE-ICASE, 2006. Interna-tional Joint Conference, 534–539. IEEE.
Mudgal, A., Hallmark, S., Carriquiry, A., and Gkritza, K. (2014). Driving behavior at a roundabout: A hierarchi-cal bayesian regression analysis.Transportation research part D: transport and environment, 26, 20–26.
Pentland, A. and Liu, A. (1999). Modeling and prediction of human behavior.Neural computation, 11(1), 229–242. Retting, R.A., Persaud, B.N., Garder, P.E., and Lord, D. (2001). Crash and injury reduction following installation of roundabouts in the united states. American journal of public health, 91(4), 628.
Sakshaug, L., Laureshyn, A., Svensson, ˚A., and Hyd´en, C. (2010). Cyclists in roundabouts—different design solutions.Accident Analysis & Prevention, 42(4), 1338– 1351.
St-Aubin, P., Saunier, N., Miranda-Moreno, L., and Ismail, K. (2013). Use of computer vision data for detailed driver behavior analysis and trajectory interpretation at roundabouts. Transportation Research Record: Journal of the Transportation Research Board, (2389), 65–77. Tango, F. and Botta, M. (2009). Ml techniques for the
classification of car-following maneuver. In Congress of the Italian Association for Artificial Intelligence, 395– 404. Springer.
Werneke, J. and Vollrath, M. (2013). How to present collision warnings at intersections?—a comparison of different approaches. Accident analysis & prevention, 52, 91–99.
Zhao, M., K¨athner, D., Jipp, M., S¨offker, D., and Lemmer, K. (2017). Modeling driver behavior at roundabouts: Results from a field study. InIEEE Intelligent Vehicles Symposium 2017 (submitted). IEEE.