Worcester Polytechnic Institute
Digital WPI
Major Qualifying Projects (All Years) Major Qualifying Projects
March 2016
Managing Lateness to Improve Process Flow in
Primary Care
Amy Margaret Stevens Worcester Polytechnic Institute
Follow this and additional works at:https://digitalcommons.wpi.edu/mqp-all
This Unrestricted is brought to you for free and open access by the Major Qualifying Projects at Digital WPI. It has been accepted for inclusion in Major Qualifying Projects (All Years) by an authorized administrator of Digital WPI. For more information, please [email protected]. Repository Citation
Stevens, A. M. (2016).Managing Lateness to Improve Process Flow in Primary Care. Retrieved fromhttps://digitalcommons.wpi.edu/ mqp-all/1639
Managing Lateness to Improve Process Flow in
Primary Care
A Major Qualifying Project Report submitted to the Faculty of
Worcester Polytechnic Institute
In partial fulfillment of the requirements for the Degree of Bachelor of Science
March 23, 2016
Submitted By
Amy Stevens
Advisor
i
Abstract
Primary care clinics are facing increased patient volume, which can contribute to delays and dissatisfied patients. This project examined root causes of delays and potential countermeasures in a large primary care clinic that is part of an integrated health system. The team gathered data and created simulation models to explore opportunities for improvement. Based on the
simulation analysis, reducing variation in appointment durations and earlier patient arrivals had significant positive effects on the timeliness of appointment starts and the total visit time.
ii
Acknowledgements
I would like to express my sincere and overwhelming gratitude to the project liaisons at the sponsoring clinic. Their enthusiasm, knowledge, and guidance made working on this project an exceptional experience. Additionally, I would like to acknowledge every member of the clinic staff who gave us information or allowed us to observe them in the clinic. The information we gathered from them was of the utmost importance as we began the project.
I would like to thank my project advisor, Professor Sharon Johnson, for her high expectations, which motivated me to work hard and produce my best possible work. Last, but most certainly not least, I would like to express my immeasurable gratitude for Sarah Abell, who was a vital part of the project team for the first portion of the project. As part of an independent study, Sarah worked with me to develop a qualitative and quantitative understanding of the clinic’s current state, including a significant contribution to data collection and analysis. She is a co-author on the background, methodology, and results from data analysis sections.
iii
Executive Summary
A primary care physician is a patient’s first step in preventing, diagnosing, or treating any health issue, and primary care practices provide services including, but not limited to,
vaccinations, prescriptions, and referrals to higher-level specialists (Schulte, 2013). Most Americans visit their primary care physician annually, but many patients have more frequent visits for acute health issues or to monitor chronic conditions. This, coupled with increases in both population and ease of access to healthcare in recent years, means that primary care practices nationwide are facing higher-than-ever patient volumes. However, the number of physicians choosing primary care as a career is not increasing at the same magnitude, possibly because primary care physicians make, on average, less than doctors in other specialties (Bodenheimer et al., 2007). A high proportion of patients to doctors makes it imperative that primary care practices operate as efficiently as possible.
Because primary care practices are currently reimbursed on a per-encounter basis, they have a major incentive to reduce costs and schedule as many appointments as possible in order to generate revenue (Bodenheimer & Pham, 2010). However, scheduling more appointments means more opportunities for delays, and “no healthcare organizations or practicing clinicians are immune from the simultaneous pressures to improve quality and lower costs” (Toussaint). In many primary care clinics, issues exist that impact patient flow, and therefore, patient
satisfaction. In many cases, the most important determinants of patient satisfaction in a clinic are how long the patient waited to be seen and the overall smoothness of the process (Clinic
Physician, personal communication). Delays can stem from a variety of root causes on both the patient side and the physician side. Studies have indicated that patients who arrive late for appointments tend to wait longer to see their physician and spend less time with them overall (Onisuru et al, 2008), which may lead to lower patient satisfaction ratings for the clinic.
This project aimed to assist a primary care clinic that is part of an integrated health system to understand the effects of lateness and delays on the system and to identify the most promising ways to decrease delays in the clinic. The project team first gained a qualitative understanding of the clinic’s operations through informal discussions and observations. Quantitative data was obtained from data collected automatically in IT systems as well as through manual data collection from both the patient and the physician perspective. This information was used to develop a simulation model using Arena that represented the clinic’s
iv starting state. Alternate models were created and tested against the base model in order to
evaluate the effectiveness of different approaches for the clinic to achieve its goal of reducing delays to improve patient experience. The following areas were explored:
- Patient arrival patterns
- The staff schedules of the Patient Care Associates (PCAs) - The duration of appointments relative to the scheduled duration - Asking late patients to reschedule their appointments for another day.
To validate the base case model and to compare the results from the alternate simulations to the base case model, two metrics were used. First, the model measures the difference between an appointment’s simulated start time and when it was scheduled to start. It also records the total time patients spend in the system, beginning when they complete the registration process and ending after they have seen their primary care provider. The metrics from the model were compared with the same metrics taken directly from the clinic in order to ensure that the model was a representative approximation of the clinic’s activities.
All simulation models represent reality imperfectly, due to assumptions made to simplify modeling and data limitations. Once generated, simulation results must be evaluated in the context of the real system. The current project was performed with a narrow set of parameters that might not mirror a particular practice and real world circumstances.The simulation model indicated that patient arrival patterns can have a significant effect on the way the clinic operates on a given day. Increasing the number of PCAs in the clinic did not appear to have a statistically significant effect on the metrics, but this is likely due to the limitations of the simulation model. Reducing variation in appointment durations (so more appointments have measured durations closer to the durations they were scheduled for) as well as asking patients who arrive after a set lateness threshold to reschedule their appointments also proved to be very effective in improving the two metrics.
Based on the information from the data collection and the simulation study, the clinic should focus their efforts on reducing the gap between scheduled appointment duration and measured duration. The clinic should also investigate ways to adjust patient arrival patterns. Reducing the number of extremely late patients had a positive effect on the metrics within the simulation model. One possibility is to explore the introduction of a lateness threshold rule. More research may be needed to formulate a policy that satisfies the clinic staff or to determine
v possible long-term effects, but the preliminary results from the model indicate that such a policy has the potential to have a positive effect on the clinic’s functioning. Finally, due to model assumptions that overestimate the availability of PCAs, adding PCA staff is likely to improve clinic performance more than the model indicates and should be investigated further.
vi
Table of Contents
Abstract ... i
Acknowledgements ... ii
Executive Summary ... iii
1.0 Introduction ... 1
2.0 Literature Review: Primary Care and Lean ... 3
2.1 Trends in Primary Care ... 3
2.2 Quality of Patient Care ... 4
2.3 Lateness ... 5
2.4 Lean Process Improvement ... 7
2.5 Lean Case Studies ... 7
2.5.1 Example Case 1 ... 7
2.5.2 Example Case 2 ... 8
2.5.3 Summary of Key Results from Example Cases ... 9
3.0 The Primary Care Clinic ... 11
3.1 Process Flow in the Primary Care Clinic ... 11
3.2 Process Improvement at the Integrated Health System ... 13
4.0 Methodology ... 14
4.1 Objective 1: Collect Qualitative and Quantitative Data about Clinic Operations ... 14
4.1.1 Interviews and Observations ... 14
4.1.2 Timestamp Data ... 15
4.1.3 Manual Data Collection ... 15
4.2 Objective 2: Develop a Simulation Model to Represent the Clinic ... 19
4.3 Objective 3: Explore Opportunities for Improvement ... 20
5.0 Results and Findings from Data Collection ... 21
5.1 The Majority of Patients Arrive Before their Appointment Time ... 21
5.2 More than Two-thirds of Appointments Start Late ... 23
5.2.1 Lateness throughout the Process ... 23
5.2.2 Consistency between Data Collected by Patients and Physicians ... 26
5.2.3 Reasons for Lateness ... 28
5.3 Appointments Contain a Large Amount of Non-value-added Time ... 29
5.4 There is often a Gap between the Scheduled and Actual Appointment Durations ... 32
5.5 Cancellations and No-shows Can Help the Clinic Absorb Lateness ... 34
6.0 Results and Findings from Simulation Model ... 37
6.1 The Base Case Model ... 37
6.1.1 Introduction and Model Basics ... 37
6.1.2 Excel File for Arrivals ... 37
6.1.3 Model Structure ... 39
6.1.4 Model Assumptions ... 45
6.1.5 Base Case Verification and Validation ... 46
6.2 Alternative Models Tested ... 48
6.2.1 Reducing Variation in Patient Arrivals ... 48
6.2.2 Adjustments to PCA staffing levels ... 50
6.2.3 Reducing Variation and Increasing Appropriateness of Appointment Lengths ... 51
vii
6.3 Summary of Simulation Findings ... 53
7.0 Conclusions and Recommendations ... 58
References ... 62
Appendix A ... 63
viii
Table of Figures
Figure 1: Swim lane diagram of flow through clinic ... 13
Figure 2: Completeness of patient data sheets ... 18
Figure 3: Percentage of late arrivals ... 21
Figure 4: Detailed pie chart of patient arrival times ... 22
Figure 5: Patient arrival times from scheduling system data ... 23
Figure 6: Histogram of registration time minus appointment time ... 24
Figure 7: Histogram of vital signs time minus appointment time ... 25
Figure 8: Histogram of appointment start time minus appointment time ... 26
Figure 9: Timeliness of appointment starts ... 27
Figure 10: Evaluation of appointment starts ... 28
Figure 11: Reasons for patient lateness ... 29
Figure 12: Box plot of proportion of value-added time ... 30
Figure 13: Box plot of proportion of time spent with provider ... 31
Figure 14: Box plot of proportion of time in exam room spent waiting ... 31
Figure 15: Histogram of appointments scheduled for 20 minutes ... 32
Figure 16: Histogram of appointments scheduled for 30 minutes ... 33
Figure 17: Histogram of appointments scheduled for 40 minutes ... 33
Figure 18: Control chart of cancellations and no shows per day ... 34
Figure 19: Cumulative percentages of cancellation times ... 35
Figure 20: Pareto chart of cancellation reasons ... 36
Figure 21: Screenshot of Excel data file ... 37
Figure 22: Calculating lateness for the model ... 38
Figure 23: The beginning of the model ... 39
Figure 24: Details about the delay module ... 39
Figure 25: The patient enters the rest of the model ... 40
Figure 26: The vital signs process ... 40
Figure 27: Screenshot of Arena's Input Analyzer ... 41
Figure 28: Part of the model's patient sorting mechanism ... 41
Figure 29: The appointment process ... 42
Figure 30: Confidence intervals for November 23rd ... 47
Figure 31: Confidence intervals for November 19th ... 48
Figure 32: Changes to average lateness of appointment starts on November 19th ... 54
Figure 33: Changes to patients' total time in system on November 19th ... 55
Figure 34: Changes to average lateness of appointment starts on November 23rd ... 56
ix
Table of Tables
Table 1: Early vs. late patients (Onisuru et al, 2008) ... 6
Table 2: Summary of results from example cases (Bard et al, 2014; Graig & Perosino, 2011) ... 10
Table 3: Alternate distributions for patient lateness ... 49
Table 4: Effects of patient arrivals ... 49
Table 5: Effects of PCA staffing levels ... 50
Table 6: Effects of variation in appointment lengths ... 52
1
1.0 Introduction
A primary care physician is a patient’s first step in preventing, diagnosing, or treating any health issue, and primary care practices provide services including, but not limited to,
vaccinations, prescriptions, and referrals to higher-level specialists (Schulte, 2013). Most Americans visit their primary care physician annually, but many patients have more frequent visits for acute health issues or to monitor chronic conditions. This high level of demand,
coupled with increases in both population and ease of access to healthcare in recent years, means that primary care practices nationwide are facing higher-than-ever patient volumes. However, the number of physicians choosing primary care as a career path is not increasing at the same
magnitude, likely because primary care physicians tend to make, on average, less money than doctors in some other specialties (Bodenheimer et al., 2007). A high proportion of patients to doctors makes it imperative that primary care practices operate as efficiently as possible.
Such is the backdrop where Lean, a technique of process improvement originally developed by Toyota for automobile manufacturing, comes into play. In addition to making mistakes that result in negative health repercussions for patients, many practices struggle with bringing timely and high-quality care to their patients, which not only increases frustrations and risks for patients, but can also create an unsatisfactory work environment for providers. Lean is “a quality improvement philosophy and set of principles that, when well executed, transforms how an organization works and creates an insatiable quest for improvement” (Toussaint). Using techniques such as process mapping, simulation and root cause analysis can help to define key issues in a process’s current state that can ultimately be improved in order to save time and money and decrease the occurrence of preventable mistakes in healthcare.
Lean techniques have been used successfully in primary care. Many primary care visits are for the treatment of common, non-chronic illnesses or conditions, or for referral to a higher-level specialist (Schulte, 2013). Every person could benefit from access to primary care to diagnose and treat conditions as early as possible. However, there is a pronounced shortage of primary care physicians in the nation, which contributes in part to several problems with primary care, most notably long wait times and unsatisfied patients (Bodenheimer & Pham, 2010).
Adding to the problem is a combination of tightly scheduled appointments, late patients, late doctors, and several patients arriving simultaneously, all of which can result in shortened appointments and negative effects on the quality of care patients receive from a clinic (Onisuru
2 et al, 2008; Bard et al., 2014; Graig & Perosino, 2011). If any part of the clinic is behind
schedule, the whole clinic can be affected for the remainder of the day.
The goal of this project was to analyze lateness and delays at a large primary care clinic that is part of an integrated health system– its causes, its frequency, and its effects – and to perform a simulation study to determine actions that might be effective for addressing delay.
The health system offers medical services in several capacities including emergency medicine, inpatient and outpatient care, hospice, homecare and rehabilitation. As stated above, the project focuses only on the large primary care clinic. The current project was performed with a narrow set of parameters that might not mirror a particular practice and real world circumstances.
In order to achieve this goal, the project group first performed manual data collection over the course of one week in the clinic. Using the data that was collected during that period as well as some automatically recorded date from the clinic’s systems, a simulation model was created to represent the clinic and the current state of its appointment process. A series of alternative models was then created, each simulating a possible change the clinic could make to how it operates and how it handles late patients.
The report is organized as follows. The common problems found in primary care clinics nationwide are described in Chapter 2. Chapter 3 describes the clinic that was the focus of the project in more detail. A summary of the goals and objectives of the project, as well as the methods used to fulfill them, can be found in Chapter 4. Chapters 5 and 6 discuss the findings from the data analysis and the simulation study, respectively. Conclusions and recommendations are detailed in Chapter 7.
3
2.0 Literature Review: Primary Care and Lean
Primary care is a patient’s first step in preventing, diagnosing, or treating any health issue, and provides services like vaccinations, prescriptions, and referrals to higher-level specialists (Schulte, 2013). In the United States, millions of people see their primary care physicians annually or biennially, and many visit their doctors more often. With such a high patient volume and a limited number of physicians, it is important that primary care clinics operate efficiently.
2.1 Trends in Primary Care
There have been countless advancements in medical technology in the last two centuries. In 1842, Dr. Crawford Long used ether as anesthesia for the first time; the ability to diminish patients’ pain allowed surgery to be more widely practiced and allowed earlier intervention for injuries and illness (Schulte, 2013). Since then, humans have developed incredibly advanced and intricate systems for medical treatment. Diseases that were a death sentence a century ago, like diabetes, have become extremely manageable with technologies such as blood sugar test strips and personal insulin pumps. Additionally, some surgeries can be performed non-invasively and patients can often go home within a few hours of surgery (Milestones in Medical Technology, 2012). These advancements in medical treatment have made medicine a more accessible option for those living with ailments. As a result of President Barack Obama’s efforts to offer healthcare to all Americans as well as population increases in the last several years, the number of patients seeking care has increased substantially (Schulte, 2013).
While the number of patients making use of primary care clinics is growing, the number of primary care physicians is not increasing at the same rate (Bodenheimer & Pham, 2010). Many medical students and residents are dissuaded from pursuing a career in primary care, considering the relatively low pay of primary care physicians compared to specialists (Bodenheimer et al., 2007). Because primary care physicians are paid on a “fee-for-service basis” (Bodenheimer & Pham, 2010) and these fees are low from both Medicare and private insurance companies, primary care clinics need to serve more patients in order to earn more money (Bodenheimer et al., 2007). Since there has been a vast increase in the number of diagnostic and imaging procedures done over the years, specialists can be paid at higher rates than primary care physicians (Bodenheimer et al., 2007). Thus, primary care physicians must face increasingly busy schedules, further exacerbated by inefficiencies within their practices and
4 the importance of balancing the teaching of residents with research and patient care
(Bodenheimer & Pham, 2010). Additionally, physicians and their practices are not financially compensated for referrals and other administrative tasks completed before patient arrival or after patient departure (Bodenheimer & Pham, 2010).
2.2 Quality of Patient Care
Despite recent medical successes, medicine is still plagued with problems similar to those that humanity has struggled with for centuries. Although we understand how infections spread, it is often still the case that patients develop an ailment completely unrelated to the medical
problem they started with (Schulte, 2013). Whether this stems from a preventable mistake such as being given an incorrect dosage of medication or from simply developing an infection, health care still has a long way to go. Mistakes can be made quickly if procedures are not properly followed – medication may be given in the wrong quantities or to the wrong patient altogether, surgeries may be completed on the wrong limb or organ, or instruments may be left inside a patient after their surgical incisions are closed (25 Most Shocking Medical Mistakes). Beyond costing hospitals thousands of dollars or more when insurance companies refuse to cover the cost of fixing preventable errors, these mistakes can cause harm or even death to patients. Other preventable conditions include pressure ulcers from spending extended periods of time in bed and infections picked up from being exposed to pathogens in the hospital; these are often attributed to unnecessarily long lengths of stay.
Though the desire to improve patient care quality is widespread, “no healthcare
organizations or practicing clinicians are immune from the simultaneous pressures to improve quality and lower costs” (Toussaint). In addition to the already high financial costs of healthcare, “a clinician’s insensitivity, a delayed operation, and a stress-increasing medical facility can be meaningful nonmonetary burdens to patients in their assessment of value” (Toussaint). Patient satisfaction is an extremely important factor in evaluating a clinic’s care quality, and much of patients’ perception of quality depends on how smooth the process flow is and how long they wait to be cared for (Clinic Physician, personal communication). In order to improve flow, eliminate mistakes, and increase patient satisfaction, there have been extensive applications of process improvement in healthcare in the last few years.
In many primary care facilities, patient flow issues may cause wait times to be longer than ideal. Increasing timely patient access and decreasing wait times would increase satisfaction
5 for both patients and clinic employees. There are several key performance indicators that must be explored in order to get a better idea of important issues. Throughput is defined as the number of patients “processed within a given time” (Dictionary.com). When throughput is high, delays can easily develop. Additionally, there are two main types of service delays within primary care. The first is appointment delays, or the length of time between the requested and scheduled
appointment dates (Bard et al., 2014). A long appointment delay suggests large-scale issues within a facility, encompassing problems with overall strategy and management of a practice. The second type of delay is real-time delays, or how long a patient waits, starting at the scheduled appointment time and ending at the time they receive service. While appointment delays are measured in days, the latter is measured in minutes or hours and focuses on shorter delays, caused by general service inefficiency, patient/provider earliness or lateness, mismatch between the average appointment duration and the scheduled time slot, and financial or insurance problems (Bard et al., 2014). This project focuses on real-time delays.
As was aforementioned, in recent years, lack of quality has become an important concern in healthcare. In a primary care setting, this can stem from several causes, including a low number of primary care physicians, tight schedules, a rise in administrative requirements and the delicate balance between several responsibilities required of physicians in teaching hospitals (Bodenheimer & Pham, 2010).
2.3 Lateness
Delays can affect more than just the flow of patients through the clinic. Lateness also has an effect on the quality of patient care. A 2008 study performed at a urology clinic in Chicago, Illinois compared the care that late patients received compared to the care received by patients who were early or on time for their appointments. Of the 306 outpatient visits the study team observed, 63.2% of the scheduled patients arrived on time. 22% of patients arrived after their scheduled appointment time, and 14.8% of patients failed to show up at all (Onisuru et al, 2008). The researchers measured time spent waiting in the exam room for the physician, time spent with the physician in the exam room, and exam room utilization for the two groups of patients. A comparison of the two groups can be found in Table 1:
6
Table 1: Early vs. late patients (Onisuru et al, 2008)
Performance Metric On Time Patients Late Patients
Wait time in exam room (minutes) 14.8 ± 9.2 11.0 ± 8.4
Time spent with physician (minutes) 10.7 ± 6.0 8.9 ± 5.8
Exam room utilization 0.31 0.37
The data in the above table shows that patients who arrived on time waited, on average, about four minutes longer to see a physician than patients who arrived late. In general, though, on-time patients were able to spend about two more minutes with their physician (Onisuru et al, 2008). While two extra minutes may seem insignificant at first glance, those two minutes could be the difference between a patient being satisfied with his or her visit and the patient feeling that their appointment was rushed or impersonal.
According to a primary care physician at the clinic, one late arrival can have an enormous effect on the clinic’s schedule for the rest of the day (Clinic Physician, personal communication). To illustrate his point, he used the example of a patient checking in 15 minutes late for an
appointment scheduled to last 20 minutes. Patients who arrive late are given the option to wait for their physician or see another physician who may be available sooner. The dilemma this physician would face if the late patient requested to wait for him is which patient to see first: the one who arrived late, or the on-time patient who is scheduled for the 20-minute slot starting in five minutes. He could also choose to reduce the appointment duration for one or both patients in order to lessen the effect on his schedule (Clinic Physician, personal communication). In either case, one or both patients may experience unsatisfactory levels of waiting, or they may be subjected to a shorter, possibly rushed, appointment with their physician.
While it is often a major contributor, patient lateness is not the only reason for delays in primary care. If a physician starts running behind schedule (due to an appointment lasting longer than scheduled, or something else entirely out of his control), the rest of his on-time patients for the remainder of the day will suffer as well (Clinic Physician, personal communication). This delay would have the same effect on the remaining appointments as a late arrival would. Other things that can contribute to real-time delays include insufficient support staff, long check-in
7 lines and complex patients – patients whose aliments are more acute or complicated than
expected.
2.4 Lean Process Improvement
Lean is a commonly used continuous process improvement method that can be effective when applied to healthcare. A Lean system is free of waste and produces exactly what its customers want at exactly the time they want it (Toussaint). In a healthcare setting, Lean involves reducing seven kinds of waste: confusion, motion, waiting, overprocessing, inventory, defects, and overproduction. Lean processes strive to create products that have value, defined according to the wants and needs of the customer, by streamlining processes and reducing activities that do not directly add value to the customer’s product. The underlying idea in Lean culture is that small changes over time will eventually compound and result in a major
improvement in the process. Lean also encourages every member of an organization to play an active role in problem solving and continuous process improvement, placing an “emphasis on finding solutions instead of assigning blame” and “focusing on the problem; not the person,” allowing every member to contribute to the growth and success of an organization. From a healthcare perspective, Lean means that each patient receives timely, appropriate care that is customized to his or her specific needs. This is especially the case in primary care, which is often an ill or injured patient’s first step for seeking treatment (Jimmerson, 2010).
2.5 Lean Case Studies
The desire for higher quality care and patient satisfaction has led many healthcare facilities, from emergency rooms to small family practices, to reconsider existing processes and make improvements. Studies have been performed in various clinics across the nation, using a wide variety of techniques to measure and improve healthcare processes. This section examines two studies conducted in primary care clinics, focusing on patient flow and scheduling.
2.5.1 Example Case 1
A study published in July of 2011 involved three different Federally Qualified Health Centers (FQHC) in low-income neighborhoods throughout the continental United States. At each of the centers, the researchers from the Altarum Institute organized three one-day events to apply Lean thinking to the primary care clinics: the first to map the current state, the second to
8 determine an ideal future state, and the third to create a to-do list and an action plan to move from the current state to the ideal future state (Graig & Perosino, 2011).
The study identified that the main issues at hand in the clinics included patient flow, the registration and vaccine processes, cycle time, and high volume of walk-in patients. To address these problems and arrive at the ideal future state, each task on the to-do list (varying from simple things like purchasing equipment to more complicated tasks like creating a new check-in and check-out process) was assigned to a specific person and given a deadline. The team
participated in monthly check-ins with a Lean coach to discuss the progress being made and to keep the project moving successfully toward the goal. Outside of these monthly meetings, clinic staff received additional Lean trainings. In each of the three cases, several key problems were resolved, saving time, money, and frustration for the patients and the staff (Graig & Perosino, 2011).
2.5.2 Example Case 2
A second example comes from a simulation study performed on the Family Health Center (FHC) in San Antonio, Texas. The center is made up of about a dozen individual clinics, each with its own specialty, but the study focuses on the family health continuity clinic only. In this clinic, patients register and check in upon arrival. Then, their vital signs are checked by a medical assistant (MA) before they are seen by their provider, either an attending physician or a medical student working under the supervision of a physician (Bard et al., 2014).
The study began with a period of observation to establish a baseline to which future results could be compared. At the start of the study, patients waited, on average, 18 minutes to get their vital signs checked by a nurse and an additional 27 minutes to see a provider. The average total elapsed time, starting at the patient’s scheduled appointment time and ending when they left the clinic, was about 80 minutes. This number does not take into account any time that a patient waited before their scheduled appointment time (if they arrived early). In the initial state, more than half of the time a patient spent in the clinic was spent waiting, and patients waited much longer to see a provider than for anything else. In this case, the provider was the
bottleneck. Utilization rates for providers in the initial state were above 90%, much higher than the rate for any other resource. It was also observed that 21.8% of scheduled patients did not show up for their appointments (Bard et al., 2014).
9 After a baseline was established, the study entered a simulation phase. A detailed model of the clinic was created using Arena, and three sets of alternate scenarios were compared to the baseline model. The researchers tested a number of revised appointment schedules, including adjusting the length of scheduled appointment blocks and the distribution of patients in each block. When compared to the baseline, the revised schedules did not have a significant impact on the process, due to the fact that the provider was the bottleneck in the process. The second
alternative tested involved reducing the no-show rate by 50%. It was found that this had a negative effect on the process, increasing the average length of stay by 14%. Completely eliminating no-shows would require many hours’ worth of overtime in order to clear all the patients out of the waiting room. This dramatic effect is because patients who do not show up for their appointments ease the burden on the clinic and reduce the number of patients a provider must see. The baseline model had enough delays present as it was, and adding more patients only strained the clinic more. The scenario that proved to be the most effective in improving
throughput and reducing patient wait times was a reduction in the simulated time spent with the provider to 75% of the observed time. Reducing the variation in provider time had a minimally significant effect. This simulation study illustrates that many of the delays in a primary care facility are a result of a bottleneck in the providers, and that the most effective tactic to improve patient flow is to reduce the amount of time patients spend with providers so that the time spent with providers matches more closely with the scheduled appointment duration (Bard et al., 2014).
2.5.3 Summary of Key Results from Example Cases
The two studies above show the variety of opportunities and Lean solutions available to the healthcare industry. Below is a summary of the methods and results of the two studies.
10
Table 2: Summary of results from example cases (Bard et al, 2014; Graig & Perosino, 2011)
Problem Method(s) Results
Inefficient vaccine administration process
• Standardized step-by-step protocol and color-coded vaccine storage bins (Graig & Perosino, 2011)
• Streamlined vaccine process (Graig & Perosino, 2011) • Saved time with
associated improvement in patient flow (Graig & Perosino, 2011)
• Reduced waste (Graig & Perosino, 2011)
• Improved staff (Graig & Perosino, 2011)
Poor communication between care teams during patient visit
• Visual management -
installation of color-coded flags outside each patient exam room (Graig & Perosino, 2011)
• Enhanced staff communication and reduced interruptions (Graig & Perosino, 2011)
• Improved cycle time (Graig & Perosino, 2011)
Patients failing to arrive for scheduled
appointments (no-shows)
• Revised scheduling - book extra patients to offset those who are no-shows (Graig & Perosino, 2011)
• Simulated 50% reduction in number of no-shows, with no change to scheduling (Bard et al, 2014)
• More appointment slots filled (Graig & Perosino, 2011)
• Improved access to care (Graig & Perosino, 2011)
• Decrease in throughput (Bard et al, 2014) Provider bottleneck
• Simulated reduction in provider length and variation to 75% of original levels (Bard et al, 2014)
• Reduction in measured length of patient visit (Bard et al, 2014) These two studies demonstrate that there are many factors that affect the length and quality of a patient’s visit to their primary care clinic. They also illustrate that there are multiple ways to successfully improve a clinic’s performance – both Lean techniques (such as process mapping) and simulation studies have been applied effectively in situations similar to the one this project focused on.
11
3.0 The Primary Care Clinic
This project focuses on a large primary care clinic that is part of an integrated health system. The system offers medical services in a number of areas, including emergency medicine, inpatient and outpatient care, hospice, homecare and rehabilitation.
3.1 Process Flow in the Primary Care Clinic
This large primary care clinic serves between 100 and 200 patients every day, including 30 new patients each week. The staff consists of 26 attending physicians, who supervise about 30 resident medical students, 8 Patient Care Associates (PCAs) and 2 nurses, as well as several support staff including telephone operators, administrative assistants, and registration desk staff. These support staff perform a variety of functions which encompass checking patients in and out, booking appointments, and other administrative tasks.
When patients arrive at the clinic, they proceed to the registration desk to check in for their appointment and ensure that the clinic’s records are up-to-date. Upon completion of the registration process, the front desk marks the patient as “Arrived” in the scheduling system, which then flows into the electronic medical record (EMR) system. Depending on which exam rooms their physician is covering that day, the patient is sent to one of three sections of the waiting area. A Patient Care Associate (PCA) calls the patient out of the waiting room and checks his or her vital signs including height, weight, and blood pressure. The PCA also asks the patient some questions about their general health - for example, if they have any pain or if they smoke cigarettes. In many cases, a disconnect exists between the clinic’s electronic and paper systems. For instance, at some of the PCA stations, a patient’s vital signs can be logged
electronically, and automatically flow into the EMR system with a timestamp. However, many PCAs choose to enter the information manually. In the rest of the clinic, inputting the
information must be done manually, so the timestamp can be inaccurate by the difference between the time the PCA measures the patient’s vital signs and the time they are inputted into the system.
After the vital signs check, if the patient’s scheduled exam room is ready, the PCA escorts the patient there to wait for the provider. If the exam room is not yet ready, the patient is sent back to the waiting area until the room is prepared. Once in the exam room, the patient waits until their physician enters the room, at which point their appointment begins. Once patients have seen their physician, they proceed to the check-out desk. Some patients are then free to leave the
12 clinic, but some will need to receive vaccinations or have a procedure done in the lab services department. Since vaccinations are generally not administered in the exam room, a patient who needs a shot must wait in the main waiting area until the designated room is available. If the patient needs a laboratory procedure, he or she proceeds to the lab services waiting area (adjacent to the primary care waiting areas) and waits for an available provider, who may be an attending physician, a nurse practitioner or a medical resident. Providers have busy schedules consisting of several responsibilities, one of which is seeing patients at the clinic. Members of the staff have expressed their dissatisfaction with the clinic’s operations, citing issues such as constantly high activity levels and inconvenient placement of some patient services. There are several
opportunities to reduce waiting in the clinic and improve the overall process flow.
A 2012 study of the primary care clinic conducted by local high school students revealed that waiting time made up a significant portion of overall time that patients spent at the clinic. Although their sample size was low, encompassing 17 patients or less at each step of the process, they measured the total time at 10 different process steps (patient parking, registration, waiting time, time spent with medical assistant, time waiting in the exam room prior to provider arrival, time spent with provider, check out time, time waiting for blood draw, time with phlebotomist, and the length of time from last stop to car). Overall, this yielded an average amount of time spent at the clinic of an hour and twelve minutes for a twenty minute appointment. Almost half (48.8%) of that average time was allocated to waiting, whether in the waiting room or the exam room. This data accounted for 6.05 minutes at registration, 13.5 minutes in the waiting area, 2.8 minutes with the medical assistant, and 21.3 minutes waiting in the exam room before the provider arrived. In total, patients spent an average of 43.5 minutes in the clinic prior to seeing the provider. Because the clinic considers the appointment to start when the patient is in the exam room with the provider, this data indicates that appointments are starting on average 43.5 minutes late, and also shows that only 5% of patients would start their appointments “on time”. Because this study had a small sample size and is a few years old, the collected data cannot necessarily be used directly; however, this study is still helpful in providing an initial understanding of the magnitude of the lateness problem within the clinic. Additionally, it emphasizes the need to dig deeper into waiting times and patient flow within the clinic with the ultimate goal of uncovering the root causes of these issues and implementing effective solutions, instead of simply treating the symptoms of inefficient processes.
13 Figure 1 is a swim-lane diagram summarizing the appointment process, starting when the patient arrives at the clinic and ending when the appointment with the provider begins:
Figure 1: Swim lane diagram of flow through clinic 3.2 Process Improvement at the Integrated Health System
The primary care clinic that was the focus of this project strives to be a Lean
environment. The clinic staff aims to continuously improve processes throughout the entire facility. One of the most widely used tools throughout the organization is the A3 report, a summary of the problem and the actions taken to analyze, correct, and monitor it. An A3 for this project, based on the organization’s preferred A3 report style, can be found in Appendix A
The health system offers several levels of Lean training to its employees. The first level, the White Belt, is an introduction to Lean principles and to some popular tools used in Lean workplaces. Employees who have completed the White Belt program are aware of the main points of Lean, such as defining and identifying value and waste, the basics of root cause analysis, and the PDSA cycle. The next level, Yellow Belt, presents a more in-depth look at the A3 problem solving process. In addition to the training they provide, process improvement implements process improvement projects all throughout the organization.
14
4.0 Methodology
This project, focused on a large primary care clinic belonging to an integrated health system, aims to analyze lateness at the clinic, its effects on the staff and patients, and the way that the clinic responds to patients who are late or providers who are running behind schedule. In order to achieve this goal, the project team focused on the following objectives:
1. Collect qualitative and quantitative information about clinic operations
2. Develop a simulation model to represent the clinic and use it to test possible changes to the clinic’s operations
3. Analyze the model outcomes and make recommendations to the clinic in order to improve performance.
The methods used to complete these objectives are detailed below.
During the first portion of the project (background research and data collection/analysis), the project team consisted of Sarah Abell and Amy Stevens (the author of this report). For the second portion of the project (simulation modeling and analysis), Amy was solely responsible for the project.
4.1 Objective 1: Collect Qualitative and Quantitative Data about Clinic Operations 4.1.1 Interviews and Observations
The first step in any Lean process improvement initiative is to observe the system in question and speak to the people who know it best. It is crucial to gain an understanding of the process before attempting to make changes. At the beginning of the project, we attended several meetings with two attending physicians in the clinic and a process improvement specialist employed by the health system. They gave us a tour of the clinic and provided us with previous studies of the flow within the clinic and other materials, including a map of the clinic and role descriptions for the different jobs within the clinic. The data allowed us to establish a baseline of knowledge about the layout and inner workings of the clinic. We used Microsoft Visio to
compile this knowledge into a swimlane diagram (see Figure 1 in Chapter 3), which depicts the steps a typical patient would follow during their time in the clinic.
Next, we spent time at the clinic observing the process in action. During this period, we were primarily located in one of the areas in which the Patient Care Associates (PCAs) take patient vital signs, and thus, were able to watch the process from when the patient is taken from the waiting room for vitals to their placement in an exam room. We also had the opportunity to
15 speak with the PCAs, registration desk staff and Ambulatory Service Representatives to gather their concerns, preliminary ideas for improvement, and additional information that would allow us to better understand the current state. At this point, we were able to fine-tune our swimlane diagram.
4.1.2 Timestamp Data
Next, we were provided with data pulled directly from the EMR system that contained information about patient arrivals. The data covered the period starting on October 1, 2014 and ending on October 8, 2015. For each appointment during that time period, the data included the scheduled date and time, the provider, and the time that the patient completed the registration process. We referred to this time as the patient’s arrival time, because at this point, the patient is marked as “arrived” in the EMR system and is ready to continue with the next step of their appointment. Using Microsoft Excel and Sigma XL, we organized the data into pivot tables and made control charts that depicted the difference between patient appointment and arrival time, and quantified lateness. We also analyzed the data in terms of what percentage of patients were late to appointments and broke down lateness by physician and appointment type. In this way, we discovered that there was an unusually high incidence of lateness in patients coming to the clinic to receive a flu vaccination (approximately 70%). Further investigation on this extremely high number showed that appointments labeled “flu visit” are actually part of a walk-in flu clinic. Because of the walk-in nature of the flu clinic, patients do not have an assigned appointment time, but a time is listed in the record in the EMR system. For this reason, we excluded flu clinic patients from our data analysis.
4.1.3 Manual Data Collection
At this point, most of the data and information we had was qualitative, and the majority of the quantitative information we had did not cover the entire process – it was concentrated on the arrival and registration parts of the process. In order to get a more complete quantitative picture of how the clinic functioned, we decided to collect data manually about the rest of the process. We chose to collect data from both the patient perspective and the physician
perspective, because lateness is a problem that can originate from many sources. Patients’ arrival times can affect how the clinic functions, but physicians’ actions can also contribute to the clinic being behind schedule. After some preparation, our data collection plan was approved by WPI’s
16 Institutional Review Board (IRB). Our data collection period consisted of five days: each
weekday between Wednesday, November 18th and Tuesday, November 24th, 2015. Patient Data Collection
Because we wanted to track a large number of appointments, and based on both our own observations and a review of some data collected by high school students in 2012, we understood how difficult and time consuming it would be to follow individual patients through their
appointments. We concluded that having the patient track the appointment themselves would provide satisfactory data. This method yielded significantly more data than if we were to shadow patients through the whole process, and it gave us baselines for each step of the appointment process, starting at the registration line and ending when the patient’s time with his or her provider came to an end.
During the data collection period, one or both of us was stationed at the clinic entrance between 7:30 AM and 4:30 PM, distributing blank sheets to patients who entered the clinic. We explained to each one that we were performing a study with the end goal of reducing wait times in the clinic and asked if they would be willing to anonymously track their progress through their appointment by writing down what time each process step started and ended. The form we distributed can be found in Appendix B. There were some time periods during which neither of us was able to be in the clinic, and the clinic staff helped to fill in these gaps as much as possible.
There are several significant limitations to collecting data this way – first and foremost, we were unable to capture every patient who walked into the clinic, for various reasons. During the times when there was nobody distributing forms, which in many cases corresponded to the highest-volume periods of the day, no patient data was captured. At some points, patients were entering the clinic at a faster rate than we could approach them. Additionally, some patients simply ignored us or refused to participate in the study. The second limitation of this sort of data collection is that it relies entirely on self-reported data from patients and is completely optional. Since we could not ensure that every patient we approached would participate fully in the study, our data may not be an entirely accurate snapshot of the clinic’s flow. However, we believe that it provides a good initial qualitative understanding of the way the clinic operates.
As a result of these two limitations, the data sheets we received at the end of the
collection period had varying degrees of completeness. Because it was completed manually and there are often many other things going on during an appointment, some of the forms have fields
17 left blank. This may have resulted from confusion, forgetfulness, distractions or lack of a
timekeeping device. Some patients also left unfinished sheets in the waiting room or the exam room, either because they forgot about them or because they decided to end their participation in the study.
Another limiting factor is the demographics of the clinic’s patients. Because the clinic is located in an urban area, not all of its patients speak English fluently. Patients who have limited proficiency in English often use interpreters during their appointments so that they can
communicate effectively with clinic staff. Using an interpreter essentially doubles the length of an appointment, since everything that is said must be translated and repeated by the interpreter. Such long appointments could be a major contributor to delays in the clinic since patients who need interpreters are not scheduled in longer appointment slots than their English-speaking peers. We contacted the health system’s interpreter services department and were able to procure two translated versions of our data sheet – one in Spanish and one in Vietnamese. This proved to be more challenging than we expected because the patients who needed these translated sheets the most were the ones that we could not communicate well with. We suspect that some patient data was lost due to the language barrier.
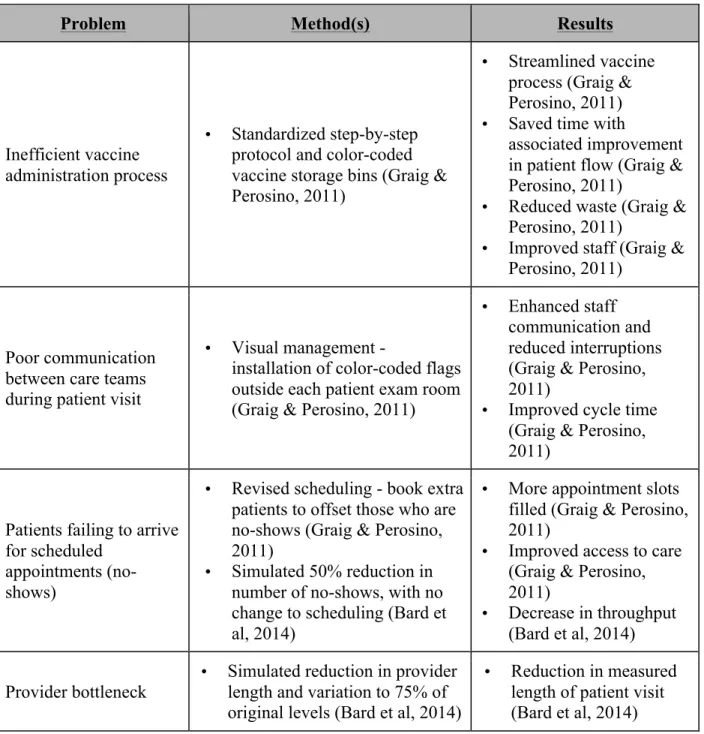
More than a quarter of the patients who had scheduled appointments during that week participated in the study, but the actual rate of participation is higher when the fact that not every appointment that was scheduled actually occurred (due to cancellations or no-shows) was taken into consideration. A total of 314 patients participated in the study. We filtered out appointments with residents as well as urgent care and psychology, because those appointments were outside of the scope of our project. As can be seen in Figure 2, 196 of 280 in-scope participants filled out all of the fields on the form. An additional 24 failed to fill in physician name, date and/or
appointment time; 49 were missing at least one timestamp data point. Eleven more were double counted because patients were missing both a data point and a time/date/physician name field, so ultimately 70% (196) of the forms were completely filled out.
18
Figure 2: Completeness of patient data sheets Physician Data Collection
In addition to the data recorded by patients at the clinic, we also asked physicians to record some data from their perspective. Each willing physician started with a copy of his or her schedule for the day – listing each appointment’s scheduled start time, scheduled duration, and appointment type. As they went about their day, the physicians were asked to record what time each appointment actually started and what time it actually ended, as well as any relevant notes that might explain why an appointment started late or lasted longer than it was scheduled to.
The main limitations of this data collection was similar to that of the patients –
completeness and credibility. Some of the sheets that were returned had spaces left blank or were missing important information about the appointment (such as its scheduled start time).
Thirty-seven providers of various types (attending physicians, medical residents, and nurse practitioners) participated in some capacity during the data collection period. Some provided us with data from every day during the period that they were working in the clinic, while others only gave us data from one clinic session. In total, 1,028 appointments were recorded by providers in the clinic.
Data Analysis
After entering all of the data that we collected into Excel, we began to closely examine the data to ensure that it was usable for the project. The most significant part of this was to compare the patient data to the provider data to make sure that there was some degree of consistency between the two sets of data. Since the commonality between the physician and
196
24
49
11
Completeness of Patient Data
Fully filledMissing info field Missing data point Missing both
19 patient data was the physician name, date, and scheduled appointment time, the goal of this exercise was to determine if providers and patients reported similar appointment lengths.
Beginning with the 314 patient data sheets and 1,028 physician appointments, we first sorted out all residents in addition to urgent care and psychology appointments. Then, we sorted out any form with blanks in the information that we were using to compare (appointment date/time, physician name, and start and end time). After this step, we were left with 221 patient sheets and 605 physician appointments. Of these, only 56 appointments matched (when looking at date, time and physician name). We then calculated the appointment length for each, and compared them. If the difference in appointment lengths was less than or equal to five minutes, any difference was attributed to a difference in timekeeping device or an acceptable level of forgetfulness in marking down the time. If the difference was greater than five minutes, it was considered a bad match. Ultimately, 71% of the matched appointments were “good” matches and 29% were “bad” matches. This exemplified that although the sample size was low, there was some degree of accuracy between the two data sets. Because we had no way of knowing which of any set of matching data points were accurate, or if the points that we had no way of cross referencing were accurate, we did not throw any points out of the study based on this
examination.
4.2 Objective 2: Develop a Simulation Model to Represent the Clinic
After discussions with the sponsoring physicians about how best to approach the problem we faced, we decided to create a simulation model using Arena. A simulation model allows investigators to experiment with changes that may be costly or organizationally difficult to implement, rather than testing changes on the physical system itself. It also allows us to be confident in the recommendations we make to the clinic – we can be reasonably sure that they will have the effect we intend. Because we already had a significant amount of quantitative data about the current state of the clinic’s operations, it would be relatively straightforward to use it to create a computer model of the clinic. Data collected from the patient data sheets was used to create and validate the model, in conjunction with the data from the scheduling and EMR systems for the specific days we collected patient data. A detailed description of the model and the validation process can be found in Chapter 6.
20
4.3 Objective 3: Explore Opportunities for Improvement
Once the base case model was complete, three main areas for improvement were tested, based on discussion with the sponsoring physicians. More details about the alternatives and the results of simulation modeling can be found in Chapter 6. The areas of improvement that were tested include:
− Changes to patient arrival patterns
− Increasing the number of available PCAs in the clinic
− Reducing the gap between scheduled appointment length and the actual length observed in the clinic
In addition, the policy of not processing patients who arrived to the clinic after a certain lateness threshold was tested; in particular, by examining the effects of having patients arriving more than 15 minutes late reschedule their appointments for another day. Policies like this are not
uncommon in clinics in the United States – and are even used in some subspecialty clinics in the health system.
Alternate models were created for each of the scenarios, and compared to the base case model using two calculated statistics – the average difference between the scheduled
appointment start time and the actual start time, and the patients’ total time spent in the system (from the time they finished registration to the time their appointment with their provider ended). Independent t-tests were to determine if the alternate models caused a statistically significant change in either of the statistics. After analyzing these results, I compiled a set of
21
5.0 Results and Findings from Data Collection
This chapter summarizes the findings from the clinic data we analyzed. This includes both the data from the scheduling system that we received, as well as the data that we collected ourselves in November 2015.
5.1 The Majority of Patients Arrive Before their Appointment Time
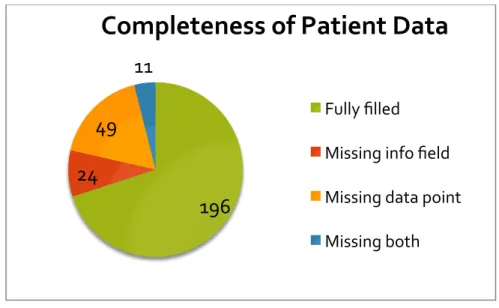
Between October 1, 2014 and October 8, 2015, the primary care clinic served about 51,000 patients. Of these patients, 31% completed the registration process (and were marked as “arrived” in the clinic’s computer systems) after their scheduled appointment time. (Clinic Data, October 2015). While about two thirds of patients arrived early to their appointments, in most cases, patients who arrive extremely early cannot be accommodated before their appointment times due to other patients in the clinic. The majority of patients (about 55%) arrived within 15 minutes of their appointment time (on either side). It is noteworthy that only 6% of patients (about 3,700 over the entire year) arrived more than 15 minutes late (Clinic Data, October 2015). Figures 3 and 4 below represent this arrivals data visually in the form of pie charts.
Figure 3: Percentage of late arrivals
31.16% 68.84%
Percentage of Patients
Arriving Late
Late On time22
Figure 4: Detailed pie chart of patient arrival times
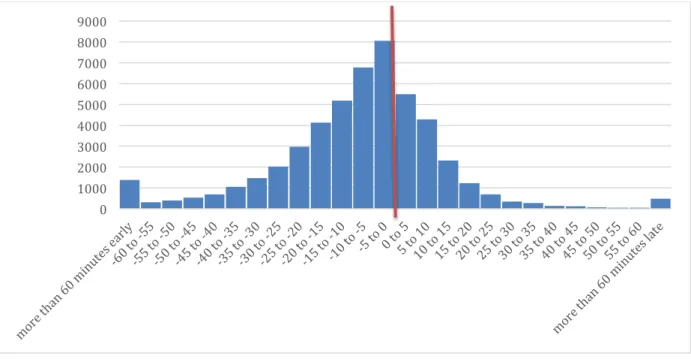
While late arrivals to the clinic can cause severe flow issues within the clinic, there are also large numbers of very early patients, so the average time difference between arrival time and appointment time is -11 minutes, or 11 minutes early to an appointment. In this case, an average is not the ideal metric to use because an overall average does not reflect the variation in arrivals to the clinic – though the average patient arrives early, there is significant variation in the data that can have an effect on the process. A histogram, such as the one shown in Figure 5, can provide a more accurate depiction of the range of early and late arrivals within the primary care clinic. In the histogram, 0 (represented by a vertical red line) represents that a patient registered exactly at his or her appointment time. Negative numbers (on the left side of the red line) indicate that the patient registered before his or her appointment, and positive numbers (on the right side of the line) represent patients who registered after their appointment times.
28%
39% 27%
6%
Patient Arrival Times
15 or more minutes early Within 15 minutes early Within 15 minutes late 15 or more minutes late
23
Figure 5: Patient arrival times from scheduling system data
The histogram in Figure 5 depicts that arrivals to the clinic follow an approximately normal distribution, with the peak of the distribution just before the appointment and a
considerable amount of variation in arrival times relative to appointment times. The majority of patients arrive early for their appointments, and most of those who arrive late are not extremely late.
5.2 More than Two-thirds of Appointments Start Late
This section examines the proportion of appointments in the clinic that start after their scheduled start times. It explores the difference between the proportion of patients arriving late and the proportion of appointments starting late, using data collected by physicians and by timestamps in the EMR system. It also examines the proportions from a patient perspective, and discusses the reasons an appointment may begin late, based on comments from physicians.
5.2.1 Lateness throughout the Process
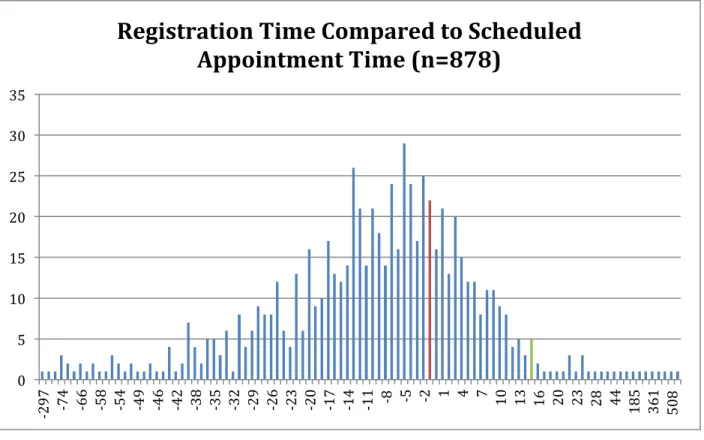
Although most patients arrive early, many patients do not get their vital signs measured before their appointment time and even fewer appointments with physicians actually start on time. The histogram in Figure 6 shows the distribution of patient arrival (registration) times compared to appointment times during our data collection period. The red bar is positioned at 0 –
0 1000 2000 3000 4000 5000 6000 7000 8000 9000
24 anything to the left of this bar (a negative number) indicates an early arrival, and anything to the right (a positive number) indicates a late arrival.
Figure 6: Histogram of registration time minus appointment time
This distribution is consistent with the distribution from the scheduling system data from October 2014 – October 2015 (discussed in Finding #1). It shows that the majority of patients during our data collection period arrived before their appointment times, with very few patients arriving more than 15 minutes after their scheduled appointment time (represented by the green bar).
Figure 7 displays the difference between the time a patient’s vital signs were measured and his or her scheduled appointment start time. Again, the red bar represents a difference of 0. As above, points to the left of the red line represent that the vital signs step happened before the scheduled appointment time, and points to the right of the red line represent that it was
completed after the scheduled appointment time.
0 5 10 15 20 25 30 35 -2 97 -74 -66 -58 -54 -49 6 -4 -42 -38 -35 -32 -29 -26 -23 -20 -17 -14 -11 -8 -5 -2 1 4 7 10 13 16 20 23 28 44 185 361 508
Registration Time Compared to Scheduled
25
Figure 7: Histogram of vital signs time minus appointment time
When compared to Figure 6, it can be seen that a higher percentage (appearing to be roughly half) of patients complete the vital signs step after their appointment start time. The most probable cause for this difference is believed to be insufficient PCA staff. The PCAs are
responsible for measuring patients’ vital signs, performing certain tests requested by physicians or residents, and also for cleaning exam rooms when appointments end. All of their
responsibilities mean that they are usually very busy. The PCA staff that we spoke with
mentioned that they were constantly moving around in the clinic performing various tasks, which may contribute to delays in this process step.
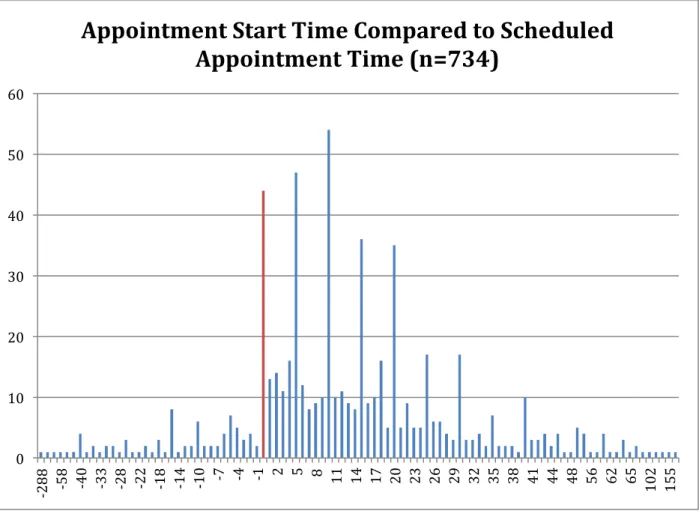
The histogram in Figure 8 shows the difference between the time the provider entered the exam room (considered to be the time the appointment started) and the appointment’s scheduled start time. The trend continues – even fewer patients start this step on time.
0 5 10 15 20 25 30 -2 85 -83 -65 -55 -45 -40 -33 -29 -25 -21 -17 -13 -9 -5 -1 3 7 11 15 19 23 27 31 36 41 51 59 100
Vital Signs Time Compared to Scheduled
26
Figure 8: Histogram of appointment start time minus appointment time
Again, the red bar represents appointments that started exactly on time. The majority of appointments are to the right of the zero mark, which indicates that they started after they were scheduled to. This histogram has some very definite peaks on numbers that are divisible by 5. Our best guess about these peaks is that physicians rounded their recordings to the nearest 5 minutes (for example, if they entered an exam room at 9:08 AM, they might have written down 9:10 as an approximation). We concluded that these approximations would not impact our data significantly, so we did not investigate them further.
5.2.2 Consistency between Data Collected by Patients and Physicians
Next, we calculated the percentage of appointments started on time. Figure 9 depicts the timeliness of appointment starts based on both the patient (left) and physician (right) data. While the percentages are slightly different between the two samples, and the physician sample is nearly three times as large (605 patients compared to 221), it is clear that the majority of
appointments are not starting at the scheduled time. From both sets of data, 15% of appointments
0 10 20 30 40 50 60 -2 88 -58 -40 -33 -28 2 -2 -18 -14 -10 -7 -4 -1 2 5 8 11 14 17 20 23 26 29 32 35 38 41 44 48 56 62 65 102 155
Appointment Start Time Compared to Scheduled
27 started on time. From the patient data, a quarter of appointments started early or on time, while 35% of the appointments recorded by physicians started on time.
Figure 9: Timeliness of appointment starts
In these pie charts, “Early” means that the appointment started before it was scheduled to (For example, a 9:00 AM appointment that started at 8:58 AM). “On Time,” in this case, means that the appointment started close to when it was supposed to. After some discussion with the physicians in the clinic, we assigned a five minute cushion time (a 9:00 AM appointment that started at 9:03 AM would fit into this category). A “Late” appointment started sometime after that five minute buffer period (for a 9:00 AM appointment, this would encompass start times of 9:06 and beyond). These charts emphasize the discrepancy between the proportion of patients who arrive before their appointment time and the proportion of appointments that actually begin on time. The histogram in Figure 10 examines the appointment start times in more detail – organizing them in more categories depending on how early or late they began compared to their scheduled start time. It illustrates the variation in appointment start, and shows that the majority of appointments that begin late are beginning between 15 and 29 minutes late.
10%
75% 15%
Timeliness of Appointment Starts Based on Patient Data
Early Late On Time 20% 65% 15%
Timeliness of Appointment Starts Based on Physician Data
Early Late On Time
28
Figure 10: Evaluation of appointment starts 5.2.3 Reasons for Lateness
In addition to the timestamps, a vital portion of our manual data collection process was the comments physicians provided regarding why they may have been running behind schedule. One of the sponsoring physicians aided us by analyzing 236 legible comments written by physicians. She provided us with the chart in Figure 11. From her chart, we determined that events outside the physician’s control cause the majority of delays. The top three most common reasons for falling behind schedule stemmed from a complex patient, delayed rooming, or a late patient arrival. Complex patients may include patients who required extensive discussion regarding new diagnoses or several medical conditions, or those who were booked in
appointment slots that were shorter than they needed to discuss their issues. Delayed rooming could be caused by a PCA being unavailable to put a patient in a room because they were busy with something else, such as patient testing (EKG), or could also be a result of EMR system errors or patient lateness. The exact reason for a patient being put in an exam room later may be difficult to determine from a physician perspective, so the two categories could be difficult to tell apart.