1
Using EWGM Method to Optimise the FMEA as a Risk
Assessment Methodology
Sahar Al Mashaqbeh1, 2, Jose Eduardo Munive-Hernandez1 and M. Khurshid Khan3
1School of Engineering, Faculty of Engineering and Informatics, University of Bradford, Bradford, UK 2 Faculty of Engineering, Hashemite University, Zarqa, Jordan. 3
3 Abdul Wali Khan University Mardan, Khyber Pakhtunkhwa, Pakistan
Corresponding author:
Sahar, Mechanical & Automotive Engineering, Faculty of Engineering and Informatics, University of Bradford, Bradford, BD7 1DP, UK E-mail: [email protected]
Abstract
Failure Modes and Effect Analysis (FMEA) is a proactive, highly structured, and systematic approach for failure analysis. It has been also applied as a risk assessment tool, by ranking potential risks based on the estimation of Risk Priority Numbers (RPNs). This paper develops an improved FMEA methodology for strategic risk analysis. The proposed approach combines the Analytic Hierarchy Process (AHP) technique with the Exponential and Weighted Geometric Mean method (EWGM) to support risk analysis. AHP is applied to estimate the weights of three risk factors: Severity (S), Occurrence (O) and Detection (D), which integrate the RPN for each risk. The EWGM method is applied for ranking RPNs. Combining AHP with EWGM allows avoiding repetition of FMEA results. The results of the developed methodology reveal that duplication of RPNs has been decreased, and facilitating an effective risk ranking by offering a unique value for each risk. The proposed methodology focuses not only on high severity values for risk ranking but also it considers other risk factors (O and D), resulting in an enhanced risk assessment process. Furthermore, the weights of the three risk factors are considered. In this way, the developed methodology offers unique value for each risk in a simple way which makes the risk assessment results more accurate. This methodology provides a practical and systematic approach to support decision-makers in assessing and ranking risks that could affect long-term strategy implementation. The methodology was validated through the case study of a power plant in the Middle East, assessing 84 risks within 9 risk categories. The case study revealed that top management should pay more attention to key risks associated with electricity price, gas emissions, lost-time injuries, bad odor, and production.
2 EWGM, FMEA, AHP, Risk assessment, RPN.
1.
Introduction
Risks can interrupt the operation process and cause negative long-term effects. These risks and interruptions will emerge from process /products such as failures of equipment, environmental concerns, natural disasters, terrorist attacks, and economic issues (Achebe, 2011). The potential risks along the operation of the business can disrupt the operation and cause significant losses ( catastrophic events like fire or flood or other smaller events like failures). All these risks will cause revenue losses, dropped production rates, and reduce the reliability and hit the reputation of the company (Pan et al. 2016). Thus, risk assessment is a critical activity for risk identification, analysis, and evaluation, supporting strategic decisions (ALMashaqbeh et al., 2018). Failure Modes and Effect Analysis (FMEA) methodology is used for identifying and reducing the potential failures to increase the reliability and safety of complex systems, design, process or service which will inhibit the occurring of failures ((Kutlu and Ekmekçioǧlu, 2012); (Liu et al., 2013)). FMEA is a method to identify and prevent failures, providing information to support risk management decisions (Jacoby, 2012). FMEA is an effective tool for high-risk industries like power plants, emphasising the need for addressing non-technical risks (Makajić-Nikolić et al., 2011). Thus, this paper tries to fill this gap by developing an FMEA methodology as a risk assessment tool for non-technical risks, integrating the AHP technique and the EWGM method for assessing and ranking risks. The advantages of FMEA is to enhance quality, safety, reliability of products, and to reduce the probability of risks (Su and Chou ,2008). FMEA helps in taking risk management decisions through the provided information (Chang,2009). FMEA can be a powerful tool for safety and reliability analysis of systems, processes, designs, and services in different industries (Liu et al. ,2013). FMEA is considered the most widespread tool for reliability and failure mode analysis. This paper proposes an improved FMEA methodology for strategic non-technical risks in power plants. This methodology will support decision-makers regarding risk assessment to support strategic risk management decisions.
3
2.
Literature Review
Risk management helps in identifying and assessing various risks types and taking countermeasure actions for achieving required objectives (Caillaud et al., 1999). In industrial operations, the effective risk analysis process is a crucial step for maintaining and improving the safety, reliability, and sustainability (Pariyani and Reniers, 2018). For the risk analysis process, several methodologies are developed. FMEA is one of these methodologies. FMEA is a qualitative inductive method applied by listing the expected failure and analysing the elements that can cause failure (Khan and Abbasi, 1998). Another methodology for risk analysis in process industries is fault tree analysis (Yazdi and Kabir, 2017). According to the importance and characteristics of process industries, these industries are prepared to face various risks (Ebrahemzadih
et al., 2015). The decision-making process should be explicitly linked to the business strategy. Thus, explicit mechanisms are required to support decision making in organisations to ensure strategic alignment (Milana, Khan and Munive-Hernandez, 2017). On the other hand, there is no standard for the ranking criteria of risks. Risk assessment scales may consider value ranges of 1 to 5, 1 to 7 or 1 to 10, with the higher number representing a higher risk level. The 1 to 5 scale can be very practical, whilst the 1 to 10 scale is very popular in the industry. The RPN, the numeric assessment of risk assigned to a process, can be estimated considering the experience and engineering judgment of practitioners. The RPN considers three key risk factors Severity (S), Occurrence (O), and D (Detection). The RPN is calculated by multiplying the values for S, O, and D, see equation (1), ((Chin, Chan and Yang, 2008) ;(Stamatis, 2003) ; (Okoro, Kolios and Cui, 2017)).
RPN = S* O* D
Where Severity (S) is the seriousness (effects) of the failure; Occurrence (O) is the frequency of the failure, and Detection (D) is the ability to detect the failure.
The evaluation criterion for risk factors can be based on a 5 point scale rating system for an FMEA (Totten, Xie, and Funatani, 2003). FMEA is a quality tool and a risk analysis methodology that helps to specify potential failures of a process and to establish their priorities by estimating RPNs (Adar et al., 2017). Engineers, practitioners, and specialists may apply a point scale to assess risks, specifying these three risk
4
factors through judgment based on their experience. In the case of obtaining the same values for RPNs, the ranking is determined depending firstly on the severity, and then on the detectability. The RPN technique is considered as a quantitative method, although it is depending on qualitative assessments (Maurizio Bevilacqua, Braglia and Gabbrielli, 2000). However, as the scale (1 to 5) is limited but practical, Lijesh & Hirani (2016) use it to quantify the RPN of failure modes for active magnetic bearings and they develop the guidelines tables for S, O, and D depending on that scale. FMEA has been also implemented in organisations to classify internal risks (Jóhannsson, 2015). FMEA is applied to evaluate three factors of project finance risk in the energy sector, with each factor including a set of risk indicators (Makajić Nikolić
et al., 2011). FMEA is a preventive process to assign specific resources to the riskiest elements (Chang, 2009). Besides, this method provides information to support the decision-making management process for risks. Although the conventional FMEA technique has been widely used, it has important limitations.A key limitation of the conventional method can be summarised in four-point as follow: Firstly, the most commonly designated limitation is the relative importance of O, S, and D is not considered and they are assumed equally important. Various combinations of O, S, and D may generate the same value of RPN. Thirdly, for calculating the RPN, the mathematical formula is a very significant part of risk assessment. Differences in ranking may cause different effects on RPN value, which sequentially depends on the values of other factors. Finally, it is most difficult to evaluate O, S, and D ((Okoro, Kolios and Cui, 2017); (Chanamool and Naenna, 2016); (Chang, 2015); (Pei-Ting et al., 2014) ;(Kutlu and Ekmekçioǧlu, 2012); (Wang et al., 2009); (Narayanagounder and Gurusami, 2009); (Pillay and Wang, 2003); (Chang, 2009); (H. C. Liu et al., 2015); (Liu et al., 2013); (Sellappan et al., 2013) ; (Chang and Cheng, 2011); (Sankar and Prabhu, 2001) and (Braglia, 2000)). Varied approaches have been proposed to address such limitations. An RPN methodology applying Fuzzy Ordered Weighted Geometric Averaging (OWGA) was developed by (Chang, 2015) helping to find the most serious risk. Similarly, FMEA provides information for risk management decisions process and is intended to make systems safer and more reliable through the evaluation process of the effects of failures on the performance of the system (Pillay and Wang, 2003). Risk analysis techniques are implemented as an essential decision support tool and identify the potential sources
5
risks where the challenge of risk analysis approaches for use as a decision support tool lies in the detail of the related risks (Okoro, Kolios and Cui, 2017). Consequently, a more general and efficient procedure is needed to evaluate the risk of failure. For example, Pei-Ting et al. (2014) suggest the exponential RPN to enhance the risk evaluation using the FMEA. Conversely, Fuzzy logic has been suggested in FMEA to eliminate the above drawbacks (Kutlu and Ekmekçioǧlu, 2012). A fuzzy if-then rules approach is developed to express the relationships between risk factors and the risk of failure modes (Bowles and Peldez, 1995). While Xu et al. (2002) present a fuzzy logic based FMEA methodology to address the interdependencies of several failure modes. Yang and Wang (2015) use the fuzzy principle by developing a framework for analysing risks using a generic Fuzzy Evidential Reasoning (FER) approach of offshore engineering systems, the proposed method is used to overcome the issues related to the conventional fuzzy rule-based methods. In contrast, a framework to support prioritisation of components of offshore engineering systems based on risk levels for intervention action, leading to inspection, repair, and maintenance is developed. This framework is applicable only to structures in the offshore environment and cannot be used out of context (Okoro, Kolios and Cui, 2017). Wang et al. (2009) utilise the fuzzy weighted geometric to evaluate the risk factors O, S, and D, where the fuzzy risk priority numbers (FRPNs) are proposed for prioritization of failure mode. Liu et al. (2017) improved the risk priority number based on a fuzzy measure and fuzzy integral fusion to overcome the problem of the weights of risk factors. A proposed model for fuzzy risk evaluation in FMEA, involving fuzzy uncertainty environment is developed Deng and Jiang (2017). Li et al., (2017) develop an evidential FMEA to transform the experts’ linguistic judgments into probability assignments. However, Liu et la. (2013) also address the limitations of the fuzzy inference technique applied to the FMEA methodology. Furthermore, (Panchal et al., 2018) develop a fuzzy decision-making methodology combining of FEMA and grey relation analysis to determine the critical components of the considered system depending on the RPN. This integration is done to overcome the equal importance weights in the conventional FMEA.
Conversely, Liu et al. (2013) in their literature review paper clarify that although the fuzzy inference technique is broadly applied to improve FMEA methodology and overcome all the aforementioned
6
limitations for FMEA, it still has various setbacks such as the difficulty in defining a suitable membership function for the risk factors and risk priority level; the fuzzy RPN model has an enormous number of rules provided by the experts; the structuring of a fuzzy if-then rule base is a hard task, needs an enormous number of judgments making by the experts, furthermore, it's highly costly and time-consuming like conventional FMEA; different antecedents of the fuzzy if-then rules but with similar consequence are unable to be distinguished from one another additionally, these fuzzy rules will be unable to be prioritised or ranked; difficulty in dealing with complicated calculations for producing precise risk results without dropping information in fuzzy inference process and finally, difficulty in designing suitable software packages to recognise the instant communication between risk input, output, and failure priority ranking. Commonly, the risks ranking is affected by the risk factors ( S, D, and O) estimation weights which play a significant and crucial role in the criticality risk analysis ((Liu et al., 2013); (Bevilacqua et al., 2000); (Okoro et al. ,2017)). According to the weighting issue in FMEA, the weighting methods which applied in FEMA are classified into three categories; subjective weighting method, objective weighting method, and Minimum cut set and combination weighting method. According to (Liu et al., 2013), AHP is one of the prevailing applied methods from the widest used methods of weighting (subjective weighting). On the contrary, there are a little literature use the integration weighting methods in FMEA. In this paper, the AHP is used to calculate the weights for the three risk factors (S, D, and O) which will be covered in section 3.1.
3.
Developing an Improved FMEA Methodology
This section discusses the development of an improved FMEA methodology, which combines the AHP technique for weighing risks and the EWGM method to facilitate an effective risk ranking.
3.1
Defining the AHP Hierarchy
AHP is a multiple-criteria decision-making (MCDM) process where selected factors are organised in a hierarchical structure, including the overall goal, main criteria and sub-criteria, and the possible alternatives (Saaty, 1990). AHP can help decision-makers to find the solution that best suits their goal. In practice, to ease setting priorities, the decision maker can add or eliminate hierarchical levels and elements as necessary
7
(Aldairi et al., 2015). The applied AHP structured hierarchy for this research starts with a Zero level related to the goal of the risk model: evaluation of key risk factors (S, O and D). The first level considers those three risk factors. The second level considers the possible alternatives, where the impact of the risk factor is classified as high, medium and low weights. After the decision hierarchy has been built, pairwise combinations have to be established by comparing each element in the upper level with one in the lower level. Saaty’s intensity of importance scale is applied to compare pairs and define relative importance. Generally, the weights for S, O, and D are determined using the AHP or estimated depending on experts opinions. Vahdani et al. (2015) estimate the risk factor values of the steel production process as (Ws=0.4, Wo=0.2, and WD=0.4). Similarly, Kutlu & Ekmekçioǧlu (2012) estimate the weights as ( Ws=0.468, Wo=0.201 and WD=0.331) as a hypothetical case study. Likewise Deng and Jiang (2017) use the method to assess risks in multi-sensor information fusion where the estimated weights are (Ws=0.3824, Wo=0.3345, and WD=0.2831) , another case study has been provided using FMEA of diesel engine’s turbocharger system and the weights are selected as (Ws=0.4, Wo=0.35 and WD=0.225) (H.-C. Liu et al., 2015). In order to compute the weights for the different criteria in AHP, the AHP starting by establish a pairwise comparison matrix A. Once the A matrix is built, the normalised pairwise comparison matrix (Anorm) can be derived from A. For the reader convince about the related equations of AHP see ((Saaty, 1990); (Saaty, 2008);(Dijkstra, 2013) ; (Krejčí and Stoklasa, 2018); (Aczél and Saaty, 1983);(Narens and Luce, 1993)).
3.2
Defining the Equation to Apply EWGM
Pei-Ting et al. (2014) discuss the complexities of some of the new methods that have been proposed to overcome the limitations of conventional FMEA. They suggest that a more practical solution is required. To address this issue, this research considers estimating the relative importance weights of the three risk factors using the AHP, providing a clear and reasonable risk assessment. This will overcome the weighting issue of (S, O, and D). The RPN is estimated by applying EWGM to eliminate duplication values. The defined equation to estimate the Weighted Geometric Mean (WGM) is shown in equation (2):
8
𝐖𝐆𝐌 = (∏
𝐧𝐢=𝟏𝐗
𝐢𝐰𝐢)
𝟏 ∑𝑛𝑖=1𝑤𝑖 ⁄
Wi: Assign weights (WS, WO and WD, ) using the AHP technique, where the sum of the weights is (1),
Pei-Ting et al. (2014) develop an exponential RPN as equation (3):
𝑬𝑹𝑷𝑵𝒊 = 𝑿
𝒙𝒊𝒔∗ 𝑾𝑺+ 𝑿
𝒙𝒊𝒐∗𝑾𝑶+ 𝑿
𝒙𝒊𝑫∗𝑾𝑫, 𝑿 ∈ ℤ 𝒂𝒏𝒅 𝑿 ≥ 𝟐
Where:
• X: is a positive integer, ≥2 and it selected as seen in the fifth equation as 3.
• xi: Estimated values of (S, O and D for each risk indicator) (xi: first risk indicator, xn: last risk
indicator, where n in this research is the total number of risk indicators are used = 84), the rating values for S,O and D, are between (1-5) as represented in section 3.5.
• WS, WO, WD : Weights of (S, O and D, will be calculated by AHP)
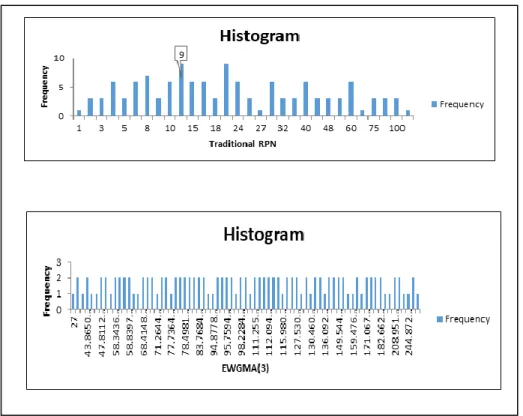
To determine the best value of X, All the potential values for X=2, X=3, X=4 and X=5 are calculated to realise the frequency and the duplication of values. Then, the highest number that can be generated by X is selected. The scale (1 to 5) that has been used in this research for the evaluation process, in the conventional RPN, there is only 30 unique number for the conventional method while for the exponential weighted geometric mean method there is 75 unique number for X≥2. At X=2 the values are very close together but for X≥3 there is a reasonable difference between values which will provide more accurate results additionally, there is no difference seen for X more than 3 therefore; X is assigned at 3 as (4):
𝑬𝑹𝑷𝑵𝒊 = 𝟑𝒙𝒊𝒔∗ 𝑾𝑺+ 𝟑𝒙𝒊𝒐∗𝑾𝑶+ 𝟑𝒙𝒊𝑫∗𝑾𝑫
Applying the weighted geometric mean (equation 2) to the ERPN (equation 4) and replacing (xi*ws) by the weighted geometric mean, the combining between the weighted geometric mean and the exponential are explained as equation (5):
EWGM-RPNi= 3^
(xis)^ Ws× 3^
(xio)^Wo× 3^
(xi D)^WDAccordingly, Equation (5) is shown the improved RPN of the FMEA. This equation can be applied to (2)
(3)
(4)
9
assess various risks. A case study example has been illustrated to show the benefits and the differences between the conventional and the improved methodology. The priority of (84) non-technical will be calculated and compared using the improved and conventional methodologies. Figure 1 represents the histogram charts for the conventional and the EWGM at X=3 where the factors weights are selected as: (WS=0.333, Wo=0.333 and WD=0.334) to derivation purpose only.
Figure 1: Comparison of the Histogram of EWGM at X=3 & Conventional RPN for Scale 1-5
3.3
Developing an FMEA for Non-Technical Risk in Power Plants
An accurate quantitative assessment using decision-making approaches, modeling and simulation will be provided from the risk assessment methodology (Zhu et al., 2018). In oil, gas, and power the supply chain management is more complex than other industries (Jacoby, 2012). From an extensive review of literature in the area of risk management and assessment, 84 non-technical risk indicators that have an impact on power plants performance are identified, These risks should be understood, reviewed and evaluated then, the rank of risk indicators have been determined. In this paper, a new comprehensive and conceptualised risk classification methodology for risk decomposition is adapted and developed using a
10
modified FMEA. The RPN is calculated two times, one depending on the conventional method and secondly, depending on the improved RPN using EWGM (equation 5). When risk data is not available, scholars and practitioners may depend on the experience of experts to support their models (Radivojević and Gajović, 2014). Similarly, (Milana et al., 2017) assert that knowledge and expertise are needed to support the decision-making process. (Geng et al., 2012) clarify that defining key indicators to evaluate business performance is critical, highlighting the need to consider the dynamics of such indicators. The developed FMEA methodology was validated using relevant data from the literature review and from the case study of the Energy Corporation in the Middle East. Information to support the developed methodology is collected depending on some literature review and on expert opinion in a power plant in the Middle East. The data was collected through a questionnaire and interviews as focus groups. 18 expert from power plants in the Middle East were asked as focus groups to fill the questionnaire and discussing the risk assessment techniques, evaluating the risk factors (S, O, and D), assessing all risk indicators and constructing the AHP matrix. Afterward, the AHP and the weighting process is implemented using Expert choice software. In this paper, the focus is on the developed FMEA and the research methodology regarding the opinion of each expert and the method of Aggregation the analytic hierarchy process will be clarified more on other future paper. The weights for three risk factors in the selected power plant in own case study are calculated and estimated depending on the previous case studies from literature ((Vahdani, Salimi and Charkhchian, 2015); (Kutlu and Ekmekçioǧlu, 2012); Deng and Jiang (2017); (H.-C. Liu et al., 2015)) , historical data and expert opinion from power plants in the Middle East through questionnaire and focus groups. By applying the AHP and construct a comparison between these three factors where the S is more important than O by 2 and by 5 with D where the O is more important than D by 4 accordingly, then the calculated weights are (WS=0.57, WO=0.333 and WD=0.097).
3.4
Improving the FMEA Risk Evaluation Stages
As summarised in section 3.2, the developed RPN equation has been constructed accordingly. The risk assessment and ranking process can be started based on equation 5. The process to develop the FMEA is as follows:
11
1.
Identify key internal and/or external risks for the organisation.
2.
Categorise the risks for groups depending on the risk type to facilitate the process.
3.
Determine the possible causes of each risk.
4.
Estimate the weights for the three risk factors (S.O, and D) using AHP (or other methods).
5.
Estimate the value of (S, O, and D) for each risk (Historical data, expert opinion, etc. can
be considered). The values of these risk factors are estimated using a (1-5) scale, section
3.5.
6.
After the values of three risk factors are determined for each risk, the RPN can be calculated
by applying equation (5) and computing the RPN by the developed method ( EWGM).
7.
Ranking the risks depending on the RPN’s values where the most important risk is related
to the highest RPN and the less important is the least RPN value.
8.
Depending on the RPN, the top management can take the suitable decisions where this
decrease the consuming time for risk monitoring and reduce the related cost for each risk,
where the attention should pay for the more risky.
The proposed methodology has been validated with the case study of an energy company in the Middle East, using relevant data and supporting the analysis with the literature review.
3.5
Calculating the Improved RPN
An improved FMEA methodology combining exponential and (WGM) has been developed to overcome some of the limitations highlighted in section 2. A comparison between the results of the conventionally estimated RPN and the improved methodology was carried out by applying equation (1) to calculate the conventional RPNs and the EWGM equation (5) to calculate the enhanced RPNs. The ranking of failure modes may be affected by risk factors weights (Liu et al., 2013). The appropriate assessment of risk factor weights (S, O, and D) plays a vital role in the criticality analysis. The weights for (S, D, and O) have been determined by the AHP technique.
12
The risk rating scale has been defined to include occurrence, detection, and severity, as indicated below (Stamatis, 2003); (Totten et al., 2003) and (Lijesh and Hirani, 2016):
1. The risk is of minimal nature, unlikely of occurrence, and very high probability to be detected. 2. Risk will result in minor disruption of operations/supply/services, low probability of occurrence,
and a high probability of risk detection.
3. Risk will result in failing to satisfy performance expectations/targets of operations/supply/services, a moderate probability of occurrence, and moderate/likely probability of risk detection.
4. Risk will result in significant failing to satisfy performance expectations/targets of operations/ supply/services, a high probability of occurrence, and low probability/not likely to detect the risk. 5. Risk will result in severe/catastrophic failing to satisfy performance expectations/targets of
operations/ supply/services, the risk is almost inevitable, and very low probability to detect the risk.
3.6
Validating the Methodology through a Case Study
The developed methodology has been validated and compared with other methodology of risk assessment from the current literature such as ((Pei-Ting, Chang and Yung-chia, 2014);(Lijesh and Hirani, 2016)). In this section, an empirical study of a power plant in the Middle East is applied to demonstrate the practicability of the improved methodology. This methodology was validated by populating the different tools with relevant data from the literature review and with data from Energy Corporation in the Middle East through questionnaire and interviews as focus groups. Accordingly, these results will differ depending
on the selected power plants. Table 1 demonstrates a case study example using the previously mentioned steps
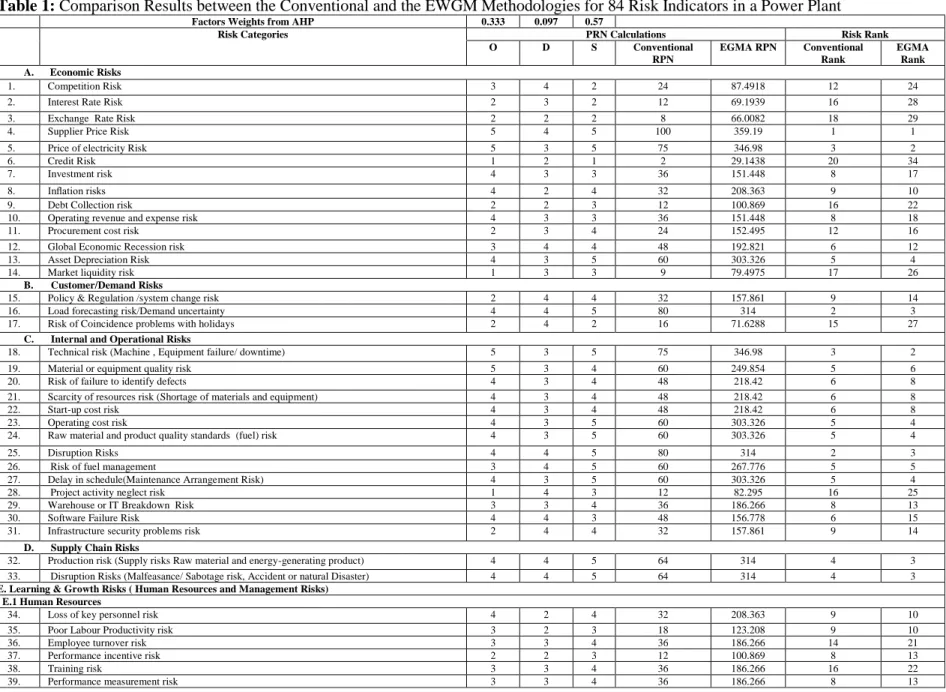
in section 3.4. From Table 1, it is clear that: repetition rate for the conventional method is 91.7% while is
77.3% for the EWGM, which means that this method is more reasonable and the RPN values are not close together as the conventional method. Hence, this will serve to see a clear vision of the risks impact and ranking and later will help the decision makers to assess and evaluate the risk correctly; the EWGM method helping in looking at all factors in risk assessment not only on the severity part like other research. Interestingly, if the severity is high in certain risk but the occurrence is almost impossible, and the other
13
two factors (O, D) are medium in their influence on another risk, the attention should be paid for the risk with the two medium influence, not for the more severe risk with the negligible occurrence. These results will differ depending on the selected power plants where the economic, environmental and social risks are different from country to another and also from the power plant to another.
14
Table 1: Comparison Results between the Conventional and the EWGM Methodologies for 84 Risk Indicators in a Power Plant Factors Weights from AHP 0.333 0.097 0.57
Risk Categories PRN Calculations Risk Rank
O D S Conventional RPN EGMA RPN Conventional Rank EGMA Rank A. Economic Risks 1. Competition Risk 3 4 2 24 87.4918 12 24
2. Interest Rate Risk 2 3 2 12 69.1939 16 28
3. Exchange Rate Risk 2 2 2 8 66.0082 18 29
4. Supplier Price Risk 5 4 5 100 359.19 1 1
5. Price of electricity Risk 5 3 5 75 346.98 3 2
6. Credit Risk 1 2 1 2 29.1438 20 34
7. Investment risk 4 3 3 36 151.448 8 17
8. Inflation risks 4 2 4 32 208.363 9 10
9. Debt Collection risk 2 2 3 12 100.869 16 22
10. Operating revenue and expense risk 4 3 3 36 151.448 8 18
11. Procurement cost risk 2 3 4 24 152.495 12 16
12. Global Economic Recession risk 3 4 4 48 192.821 6 12
13. Asset Depreciation Risk 4 3 5 60 303.326 5 4
14. Market liquidity risk 1 3 3 9 79.4975 17 26
B. Customer/Demand Risks
15. Policy & Regulation /system change risk 2 4 4 32 157.861 9 14
16. Load forecasting risk/Demand uncertainty 4 4 5 80 314 2 3
17. Risk of Coincidence problems with holidays 2 4 2 16 71.6288 15 27
C. Internal and Operational Risks
18. Technical risk (Machine , Equipment failure/ downtime) 5 3 5 75 346.98 3 2
19. Material or equipment quality risk 5 3 4 60 249.854 5 6
20. Risk of failure to identify defects 4 3 4 48 218.42 6 8
21. Scarcity of resources risk (Shortage of materials and equipment) 4 3 4 48 218.42 6 8
22. Start-up cost risk 4 3 4 48 218.42 6 8
23. Operating cost risk 4 3 5 60 303.326 5 4
24. Raw material and product quality standards (fuel) risk 4 3 5 60 303.326 5 4
25. Disruption Risks 4 4 5 80 314 2 3
26. Risk of fuel management 3 4 5 60 267.776 5 5
27. Delay in schedule(Maintenance Arrangement Risk) 4 3 5 60 303.326 5 4
28. Project activity neglect risk 1 4 3 12 82.295 16 25
29. Warehouse or IT Breakdown Risk 3 3 4 36 186.266 8 13
30. Software Failure Risk 4 4 3 48 156.778 6 15
31. Infrastructure security problems risk 2 4 4 32 157.861 9 14
D. Supply Chain Risks
32. Production risk (Supply risks Raw material and energy-generating product) 4 4 5 64 314 4 3 33. Disruption Risks (Malfeasance/ Sabotage risk, Accident or natural Disaster) 4 4 5 64 314 4 3
E. Learning & Growth Risks ( Human Resources and Management Risks) E.1 Human Resources
34. Loss of key personnel risk 4 2 4 32 208.363 9 10
35. Poor Labour Productivity risk 3 2 3 18 123.208 9 10
36. Employee turnover risk 3 3 4 36 186.266 14 21
37. Performance incentive risk 2 2 3 12 100.869 8 13
38. Training risk 3 3 4 36 186.266 16 22
15
40. Employee safety risk 4 3 5 60 303.326 5 4
41. Job seasonality (months/year) risk(level of continuity of the job over time) 1 2 2 4 49.6275 19 32
42. Unemployment rate risk 3 3 4 36 186.266 8 13
43. Sick leave risk ([h/year]) the number of hours which employees spend on sick 4 2 4 32 208.363 9 10 44. IT Infrastructure Risk ( Scarcity of skills/technique (Lack of Qualified labour) 4 3 4 48 218.42 6 8
45. Moral hazard Risk 3 3 3 27 129.154 11 20
E.2 Management Risk
46. Partnership ( relationship) risk (Lack of relationship management) 4 2 2 16 94.5441 15 23 47. Inappropriate organizational response to changing environment risk 4 3 4 48 218.42 6 8 48. Inappropriate organizational structure risk 4 2 4 32 208.363 9 10 49. Ineffective integrating and managing enterprise resources risk 4 2 4 32 208.363 9 10 50. Unclear strategy for achieving organizational objectives (Poor definition of scope) risk 4 3 4 48 218.42 6 8
51. Poor coordination 4 2 3 24 144.476 12 19
52. Mismatch between organizational strategy and culture 4 3 3 36 151.448 8 18
53. Information sharing problems 4 3 3 36 151.448 8 18
54. Planning risk 4 3 3 36 151.448 8 18
55. Location of facilities selection risk/Site/ Facilities risk 4 3 1 12 58.2007 16 30
56. Management lagging behind expansion 3 4 4 48 192.821 6 12
57. Interaction between stakeholders 4 3 3 36 151.448 8 18
F. Sustainability Risks F.1 Environmental Pillar
58. GHG emissions (NOx,Co2 and So2) risk 5 3 5 75 346.98 3 2
59. Environmental regulations 3 3 4 36 186.266 8 13
60. Industrial water reuse ratio risk 5 3 4 60 249.854 5 6
61. Recycling of treated water risk 2 3 5 30 211.774 10 9
62. Solid waste risk in thermal power plants 4 4 5 80 314 2 3
63. Waste handling risk (Polychlorinated Biphenyls (PCBs) Waste Management) 5 4 5 100 359.19 2 3
64. Lost time Injuries Risk 5 3 5 75 346.98 3 2
65. Accident fatalities per energy produced (Severe accidents Risks) 2 4 5 40 219.226 7 7 66. Human Toxicity Potential Expresses (ex. Polychlorinated Biphenyls (PCBs) 4 3 5 60 303.326 5 4
67. Noise Impact Caused by Energy System 5 3 5 75 346.98 3 2
68. Bad Odours Risk 5 3 5 75 346.98 3 2
69. Mortality due to normal operation (reduced life- expectancy Years of life lost/GWh) 2 2 5 20 202.024 13 11
70. Soil Pollution 4 4 5 80 314 2 3
F2.Social Pillar
71. Lack of motivation for staff 3 2 3 18 123.208 14 21
72. Lack of innovation 3 2 3 18 123.208 14 21
73. Lack of organizational learning capability 3 3 1 9 49.6331 17 31
74. Poor relationship between parties 3 3 3 27 129.154 11 20
75. Labour strikes risk 4 3 5 60 303.326 5 4
76. Social challenges (poverty, substantial levels of inequalities, health challenge) 3 4 4 48 192.821 6 12
77. Behavioural aspect of employees 3 3 4 36 186.266 8 13
78. Union/labour relations risk 4 3 4 48 218.42 6 8
79. Reputation Risk (Negative Media Coverage) 2 2 1 4 38.7633 19 33 80. Changing behaviour risk (Change Human Behaviour) 4 3 4 48 218.42 6 8
81. Local community impacts risk 4 2 3 24 144.476 12 19
F3. Technological Pillar
82. Obsolescence Risk (Adaptation or Technology Exchange risk 4 3 4 48 218.42 6 8 83. Improved fuel efficiency/efficiency of the combustion risk 2 3 5 30 211.774 10 9 84. Sustainable technology innovation risk/ energy efficient technologies or renewable methods 4 3 5 60 303.326 5 4
16
4.
Conclusions
This paper proposed an improved FMEA methodology for evaluating strategic non-technical risks in power plants. The study has identified 84 key non-technical risks to be considered to validate the proposed approach. The proposed FMEA methodology has applied EWGM to calculate the RPN. The application of the developed methodology has resulted in an important reduction in the duplication of RPNs, facilitating risk ranking and provides a unique value for each risk. The proposed methodology focuses not only on high severity values for risk ranking but it also addresses the other risk factors (O and D), resulting in an enhanced risk assessment process. The developed methodology offers a unique value of each risk which makes the risk assessment results more accurate. Furthermore, provides a practical and systematic approach to support decision-makers in assessing and ranking risks that could affect long-term strategy implementation. The methodology was validated through the case study of a power plant in the Middle East. The analysis of the case study identified and assessed 84 risks, within 9 risk categories. The case study revealed that top management should pay more attention to key risks associated with electricity price, gas emissions, lost-time injuries, bad odor and production. The managerial implication of this methodology will help decision makers in better assessment of risks, supported strategy of a power plant regarding risk management process and development of countermeasures for various risks types. The methodology can be applied to other industries and power plants. The output of the improved RPN of FME process can be utilised and integrated with other methods to improve the risk assessment process such as Fuzzy approaches. Furthermore, it will be possible to model this methodology by considering the changes in system environment with time utilising a system dynamic approach to check how risks change with time and understanding the system behavior.
Acknowledgments
This research has been supported by Hashemite University, Jordan.
References
Achebe, K. O. (2011) Risk Based Models for the Optimization of Oil and Gas Supply Chain Critical Infrastructure, Public Health. doi: 10.3141/2100-07.
17
Aczél, J. and Saaty, T. L. (1983) ‘Procedures for Synthesizing’, Journal of Mathematical Psycology, 102, pp. 93–102. doi: 10.1177/0969733011431927.
Aldairi, J. and Khan, M. K. (2015) ‘A Conceptual Model for a Hybrid Knowledge- based Lean Six Sigma Maintenance System for Sustainable Buildings’, II(October), pp. 1–6.
ALMashaqbeh, S., Munive-hernandez, J. E. and Khan, M. K. (2018) ‘Developing a FMEA Methodology to Assess Risk Indicators in Power Plants’, in Proceedings of the World Congress on Engineering.
Bevilacqua, M., Braglia, M. and Gabbrielli, R. (2000) ‘Monte Carlo simulation approach for a modified FMECA in a power plant’, Quality and Reliability Engineering International, 16(4), pp. 313–324. doi: 10.1002/1099-1638(200007/08)16:4<313::AID-QRE434>3.0.CO;2-U.
Bevilacqua, M., Braglia, M. and Gabbrielli, R. (2000) ‘MONTE CARLO SIMULATION APPROACH FOR A MODIFIED FMECA IN A POWER PLANT’, QUALITY AND RELIABILITY ENGINEERING INTERNATIONAL, 16(April), pp. 313–324.
Bowles, J. B. and Peldez, C. E. (1995) ‘Fuzzy logic prioritization of failures in a system failure mode, effects and criticality analysis’, Reliability Engineering and System Safety, 50(2), pp. 203–213. doi: 10.1016/0951-8320(95)00068-D.
Braglia, M. (2000) ‘MAFMA: multi‐attribute failure mode analysis’, International Journal of Quality & Reliability Management, 17(9), pp. 1017–1033. doi: 10.1108/02656710010353885.
Caillaud, E., Gourc, D. and Garcia, L. A. (1999) ‘A framework for a Knowledge Based-System for Risk Management in concurrent Engineering’, Concurrent Engineering: Research and Applications, 7(3), pp. 257–267.
Chanamool, N. and Naenna, T. (2016) ‘Fuzzy FMEA application to improve decision-making process in an emergency department’, Applied Soft Computing Journal. Elsevier B.V., 43, pp. 441–453. doi: 10.1016/j.asoc.2016.01.007.
Chang, K. H. (2009) ‘Evaluate the orderings of risk for failure problems using a more general RPN methodology’, Microelectronics Reliability. Elsevier Ltd, 49(12), pp. 1586–1596. doi: 10.1016/j.microrel.2009.07.057.
Chang, K. H. (2015) ‘Generalized multi-attribute failure mode analysis’, Neurocomputing. Elsevier, 175(PartA), pp. 90–100. doi: 10.1016/j.neucom.2015.10.039.
Chang, K. H. and Cheng, C. H. (2011) ‘Evaluating the risk of failure using the fuzzy OWA and DEMATEL method’, Journal of Intelligent Manufacturing, 22(2), pp. 113–129. doi: 10.1007/s10845-009-0266-x. Chin, K., Chan, A. and Yang, J. (2008) ‘Development of a fuzzy FMEA based product design system’, pp. 633–649. doi: 10.1007/s00170-006-0898-3.
Deng, X. and Jiang, W. (2017) ‘Fuzzy Risk Evaluation in Failure Mode and Effects Analysis Using a D Numbers Based Multi-Sensor Information Fusion Method’, Sensors, 17(9), p. 2086. doi: 10.3390/s17092086.
Dijkstra, T. K. (2013) ‘On the extraction of weights from pairwise comparison matrices’, Central European Journal of Operations Research, 21(1), pp. 103–123. doi: 10.1007/s10100-011-0212-9.
Ebrahemzadih, M., Maleki, A., Darvishi, E. and Abadi, M. M. (2015) ‘The Analysis of Process Accidents Due to Risks in the Petrochemical Industries — The Case Study of Radiation Intensity Determination Proportional to Distance from Tank Level’, Open Journal of Safety Science and Technology, (June), pp. 21–26.
Geng, Y., Fu, J., Sarkis, J. and Xue, B. (2012) ‘Towards a national circular economy indicator system in China: An evaluation and critical analysis’, Journal of Cleaner Production. Elsevier Ltd, 23(1), pp. 216– 224. doi: 10.1016/j.jclepro.2011.07.005.
Jacoby, D. (2012) Optimal supply chain management in oil, gas, and power generation. PennWell Corporation.
Khan, F. I. and Abbasi, S. A. (1998) ‘Techniques and methodologies for risk analysis in chemical process industries’, Journal of Loss Prevention in the Process Industries, 11(4), pp. 261–277. doi: 10.1016/S0950-4230(97)00051-X.
Krejčí, J. and Stoklasa, J. (2018) ‘Aggregation in the analytic hierarchy process: Why weighted geometric mean should be used instead of weighted arithmetic mean’, Expert Systems with Applications. Elsevier Ltd,
18 114, pp. 97–106. doi: 10.1016/j.eswa.2018.06.060.
Kutlu, A. C. and Ekmekçioǧlu, M. (2012) ‘Fuzzy failure modes and effects analysis by using fuzzy TOPSIS-based fuzzy AHP’, Expert Systems with Applications, 39(1), pp. 61–67. doi: 10.1016/j.eswa.2011.06.044.
Li, Z., Xiao, F., Fei, L., Mahadevan, S. and Deng, Y. (2017) ‘An Evidential Failure Mode and Effects Analysis Using Linguistic Terms’, Quality and Reliability Engineering International, 33(5), pp. 993–1010. doi: 10.1002/qre.2075.
Lijesh, K. P. and Hirani, H. (2016) ‘Failure mode and effect analysis of active magnetic bearings’, Tribology in Industry, 38(1), pp. 90–101.
Liu, H.-C., You, J.-X., Ding, X.-F., Su and Qiang (2015) ‘Improving risk evaluation in FMEA with a hybrid multiple criteria decision making method’, nternational Journal of Quality & Reliability Management. doi: 10.1108/MBE-09-2016-0047.
Liu, H. C., Liu, L. and Liu, N. (2013) ‘Risk evaluation approaches in failure mode and effects analysis: A literature review’, Expert Systems with Applications. Elsevier Ltd, 40(2), pp. 828–838. doi: 10.1016/j.eswa.2012.08.010.
Liu, H. C., You, J. X., Lin, Q. L. and Li, H. (2015) ‘Risk assessment in system FMEA combining fuzzy weighted average with fuzzy decision-making trial and evaluation laboratory’, International Journal of Computer Integrated Manufacturing. Taylor & Francis, 28(7), pp. 701–714. doi: 10.1080/0951192X.2014.900865.
Liu, H., Deng, X. and Jiang, W. (2017) ‘Risk Evaluation in Failure Mode and Effects Analysis Using Fuzzy Measure and Fuzzy Integral’, Symmetry, 9(8), p. 162. doi: 10.3390/sym9080162.
Makajić Nikolić, D., Jednak, S., Benković, S. and Poznanić, V. (2011) ‘Project finance risk evaluation of the Electric power industry of Serbia’, Energy Policy, 39(10), pp. 6168–6177. doi: 10.1016/j.enpol.2011.07.017.
Milana, M., Khan, M. K. and Munive-Hernandez, J. E. (2017) ‘Design and development of Knowledge Based System for Integrated Maintenance Strategy and Operations’, Concurrent Engineering, 25(1), pp. 5–18. doi: 10.1177/1063293X16665662.
Narayanagounder, S. and Gurusami, K. (2009) ‘A New Approach for Prioritization of Failure Modes in Design FMEA using ANOVA’, World Academy of Science, Engineering and Technology, 3(1), pp. 524– 531.
Narens, L. and Luce, R. D. (1993) ‘Commentary ARISING FROM AXIOMATIC MEASUREMENT THEORY’, Social Science, 4(2), pp. 127–130.
Okoro, U., Kolios, A. and Cui, L. (2017) ‘Multi-criteria risk assessment approach for components risk ranking – The case study of an offshore wave energy converter’, International Journal of Marine Energy. Elsevier Ltd, 17, pp. 21–39. doi: 10.1016/j.ijome.2016.12.001.
Pan, I., Korre, A. and Durucan, S. (2016) ‘A systems based approach for financial risk modelling and optimisation of the mineral processing and metal production industry’, Computers and Chemical Engineering. Elsevier Ltd, 89, pp. 84–105. doi: 10.1016/j.compchemeng.2016.03.010.
Panchal, D., Jamwal, U., Srivastava, P., Kamboj, K. and Sharma, R. (2018) ‘Fuzzy methodology application for failure analysis of transmission system’, International Journal of Mathematics in Operational Research, 12(2).
Pariyani, A. and Reniers, G. (2018) ‘Risk analysis in the Process Industries: State-of-the-art and the future’,
Journal of Loss Prevention in the Process Industries. Elsevier, 53(March), pp. 1–2. doi: 10.1016/j.jlp.2018.03.006.
Pei-Ting, L., Chang, K.-H. and Yung-chia, C. (2014) ‘Applying the concept of exponential approach to enhance the assessment capability of FMEA’, Journal of Intelligent Manufacturing, pp. 1413–1427. doi: 10.1007/s10845-013-0747-9.
Pillay, A. and Wang, J. (2003) ‘Modified failure mode and effects analysis using approximate reasoning’,
Reliability Engineering & System Safety, 79(1), pp. 69–85. doi: 10.1016/S0951-8320(02)00179-5.
Radivojević, G. and Gajović, V. (2014) ‘Supply chain risk modeling by AHP and Fuzzy AHP methods’,
19
Saaty, T. L. (1990) ‘How to make a decision: The analytic hierarchy process’, European Journal of Operational Research, 48(1), pp. 9–26. doi: 10.1016/0377-2217(90)90057-I.
Saaty, T. L. (2008) ‘Relative measurement and its generalization in decision making why pairwise comparisons are central in mathematics for the measurement of intangible factors the analytic hierarchy/network process’, Revista de la Real Academia de Ciencias Exactas, Fisicas y Naturales. Serie A. Matematicas, 102(2), pp. 251–318. doi: 10.1007/BF03191825.
Sankar, N. R. and Prabhu, B. S. (2001) ‘Modified approach for prioritization of failures in a system failure mode and effects analysis’, International Journal of Quality & Reliability Management, 18(3), pp. 324– 335. doi: http://dx.doi.org/10.1108/MRR-09-2015-0216.
Sellappan, N., Oman, S. and Palanikumar, K. (2013) ‘Modified Prioritization Methodology for Risk Priority Number in Failure Mode and Effects Analysis’, nternational Journal of Applied Science and Technology, 3(4), pp. 27–36.
Stamatis, D. H. (2003) Failure mode and effect analysis: FMEA from theory to execution. ASQ Quality Press.
Su, C. T. and Chou, C. J. (2008) ‘A systematic methodology for the creation of Six Sigma projects: A case study of semiconductor foundry’, Expert Systems with Applications, 34(4), pp. 2693–2703. doi: 10.1016/j.eswa.2007.05.014.
Totten, G. E., Xie, L. and Funatani, K. (2003) Handbook of mechanical alloy design. CRC press.
Vahdani, B., Salimi, M. and Charkhchian, M. (2015) ‘A new FMEA method by integrating fuzzy belief structure and TOPSIS to improve risk evaluation process’, International Journal of Advanced Manufacturing Technology, 77(1–4), pp. 357–368. doi: 10.1007/s00170-014-6466-3.
Wang, Y.-M., Chin, K.-S., Poon, G. K. K. and Yang, J.-B. (2009) ‘Risk evaluation in failure mode and effects analysis using fuzzy weighted geometric mean’, Expert Systems with Applications. Elsevier Ltd, 36(2), pp. 1195–1207. doi: 10.1016/j.eswa.2007.11.028.
Xu, K., Tang, L. C., Xie, M., Ho, S. L. and Zhu, M. L. (2002) ‘Fuzzy assessment of FMEA for engine systems’, Reliability Engineering and System Safety, 75(1), pp. 17–29. doi: 10.1016/S0951-8320(01)00101-6.
Yang, Z. and Wang, J. (2015) ‘Use of fuzzy risk assessment in FMEA of offshore engineering systems’,
Ocean Engineering. Elsevier, 95, pp. 195–204. doi: 10.1016/j.oceaneng.2014.11.037.
Yazdi, M. and Kabir, S. (2017) ‘A fuzzy Bayesian network approach for risk analysis in process industries’,
Process Safety and Environmental Protection. Institution of Chemical Engineers, 111, pp. 507–519. doi: 10.1016/j.psep.2017.08.015.
Zhu, L.-N., Li, P.-H., Yang, X., Shen, G.-J. and Zhao, Y.-W. (2018) ‘EE-RJMTFN: A novel manufacturing risk evaluation method for alternative resource selection in cloud manufacturing’, Concurrent Engineering, p. 1063293X1879521. doi: 10.1177/1063293X18795210.
Author Biographies
Sahar Mohammad AL Mashaqbeh is a PhD student at the Faculty of Engineering and Informatics, University of Bradford. She has a BSc in Mechatronics Engineering and an MSc In Industrial Engineering from Hashemite University, Jordan. She has 10 year experience as quality engineer.
Dr J. Eduardo Munive-Hernandez is a Lecturer in Advanced Manufacturing Engineering at the Faculty of Engineering and Informatics, University of Bradford. He received his Ph. D in Total Technology from the University of Manchester Institute of Science and Technology in 2003.
Professor Mohammed Khurshid Khan is currently the Vice Chancellor of Abdul Wali Khan University, Mardan, Pakistan. He is also a Professor of Manufacturing Systems Engineering at the University of Bradford. He received his BEng, PhD and MBA degrees from the University of Bradford in 1983, 1987 and 1997, respectively.