Volume 3
Issue 1 Volume 3, Issue 1, 2018
Article 1
2018
Pulsar selection using fuzzy knn classifier
Pulsar selection using fuzzy knn classifier
Taha M. Mohamed
Faculty of Computers and Information, Helwan University, Egypt, [email protected]
Follow this and additional works at: https://digitalcommons.aaru.edu.jo/fcij
Part of the Computer Engineering Commons
Recommended Citation
Recommended Citation
Mohamed, Taha M. (2018) "Pulsar selection using fuzzy knn classifier," Future Computing and Informatics Journal: Vol. 3 : Iss. 1 , Article 1.
Available at: https://digitalcommons.aaru.edu.jo/fcij/vol3/iss1/1
This Article is brought to you for free and open access by Arab Journals Platform. It has been accepted for inclusion in Future Computing and Informatics Journal by an authorized editor. The journal is hosted on Digital Commons, an Elsevier platform. For more information, please contact [email protected], [email protected], [email protected].
Pulsar selection using fuzzy
knn
classifier
Taha M. Mohamed
*
Faculty of Computers and Information, Helwan University, Egypt Received 13 November 2017; accepted 21 November 2017
Available online 21 December 2017
Abstract
Pulsars are rare type of stars that emit radio signals that could be detected from earth. Astronomy scientists give more attention to this type of stars for many reasons. In the near past, the problem of pulsar selection was carried out manually. Recently, neural network techniques are proposed to solve the problem. In this paper, we present a novel technique to efficiently selecting pulsars. The proposed algorithm is based on the fuzzy knn classifier. Results show that, the proposed algorithm outperforms five other classifiers, including neural network classifiers, using three evaluation metrics. The proposed algorithm is evaluated on the recent HITRU 2 dataset.
Copyright©2017 Faculty of Computers and Information Technology, Future University in Egypt. Production and hosting by Elsevier B.V. This is an open access article under the CC BY-NC-ND license (http://creativecommons.org/licenses/by-nc-nd/4.0/).
Keywords:Fuzzy classifiers; Fuzzy knn; HITRU 2; Pulsar selection
1. Introduction
Pulsars are a rare type of stars that produce radio signals detectable from the Earth. When pulsars rotate, their emission beam sweeps across the sky. So, a detectable pattern of broadband radio emission is produced when this beam crosses our line of sight. The pattern repeats periodically when pulsars rotate rapidly [1,7]. Pulsars are laboratories for extreme physics unachievable on the earth[5]. They are very important as they may be used as probes of space-time, inter stellar medium, super fluid, states of matter, and many others[1,5,7]. Currently, there are around 2200 known pulsars in the Milky Way, the Magellanic clouds, and globular clusters[5].
However, searching for pulsars is not a simple task. Discovering pulsars involves identifying periodic signals in observational data. Then, these data is reduced to a set of diagnostic values and graphical representations called a candidate [2]. Unfortunately, most of the candidates are
caused by radio frequency interference (RFI) and noise, that incorrectly look like pulsars[1,7].
Pulsar surveys are carried out by pointing the telescope at a region of the sky for several minutes to hours. The observa-tional data is then recorded, and the telescope is moving to another region of the sky looking for new pulsars [3]. The pulsar candidates are the recorded plots and statistics of radio signals that is the raw material for further analysis. The can-didates should be further inspected by either automatically, or by human expert, to determine their authenticity [1]. Until recently, the selection of promising candidates to be observed again for confirmation is heavily dependent on human in-spection. However, the human inspection is a subjective, time-consuming, and error prone process[1,2]. Moreover, those of likely pulsars are highlighted for further analysis, and possibly allocated extra telescope time for confirmation. The candidate ‘selection’process is the process of deciding which a candi-date is really a pulsar or not [1]. Until recently [1], the candidate selection process was a manual task. However, the manual selection is impractical due to the large amount of candidates produced by recent high technology telescopes[1]. Recently, the research is oriented to machine learning ap-proaches to solve the candidates selection problem.
*Corresponding author
E-mail address:[email protected].
Peer review under responsibility of Faculty of Computers and Information Technology, Future University in Egypt.
ScienceDirect
Future Computing and Informatics Journal 3 (2018) 1e6
http://www.journals.elsevier.com/future-computing-and-informatics-journal/
https://doi.org/10.1016/j.fcij.2017.11.001
2314-7288/Copyright©2017 Faculty of Computers and Information Technology, Future University in Egypt. Production and hosting by Elsevier B.V. This is an open access article under the CC BY-NC-ND license (http://creativecommons.org/licenses/by-nc-nd/4.0/).
The recent High Time Resolution Universe (HTRU) survey is a sky survey conducted in 2008, and has been recently completed. It uses the efficient Parkes radio telescope to search the whole visible sky for pulsars[5]. This survey pro-duces several millions of candidates. Unfortunately, the ma-jority of which are non pulsars that are caused either by human made radio-frequency interference (RFI), or due to noise[2,5]. Many features of the candidates are proposed in the liter-ature[1]. Among them, the features proposed by Ref.[1]that experimentally prove superiority over other used features. These features are tested on HITRU1 [2], HITUE2 [1], and LOTAAS[1]datasets. The authors in Ref.[1]claims that, the features maximize the separation between noise and non-noise candidates. Another advantage of these proposed features is the low number of features which avoid the curse of dimen-sionality problem.
The HTRU2 dataset, is the recent publicly available data set
[1,8], that describes a sample of pulsar candidates collected during the High Time Resolution Universe (HTRU) Survey
[1]. The data set is represented as eight variables Xi ε
{X1,…,X8} representing some statistical information about
HTRU signals. The first four features are simple statistics obtained from the integrated pulse profile. The remaining four features are similarly obtained from the DM-SNR curve[1]. The goal of the classification process is to classify the given candidates as pulsars or non pulsars. The binary labels, the class label,Y¼{0, 1}, whereY¼0 refers to non-pulsar. On the contrary, whenY¼1, this refers to existing of pulsars.
Among the various machine learning approaches, the fuzzy
K-nearest Neighbors (knn) classifier, which is one of the most known and effective methods in supervised classification[10]. To the best of our knowledge, no research is conducted to evaluate fuzzy classifiers in pulsar selection problems. How-ever, neural networks are the dominant machine learning techniques used in this domain.
In this paper, a new fuzzyknnclassifier is proposed to solve the pulsar selection problem. The proposed algorithm is tested on the publicly available HITRU2 data set [8], and proves superiority over other classifiers used in the literature. The rest of this paper is organized as follows; Section 2 presents the necessary background. Section 3 presents the related work. Section4 presents the proposed algorithm. The experimental results are described in Section 5. Finally, the paper is concluded in Section 6.
2. Background
Neural networks, and perceptron techniques, are good classifiers in case of classes that are separable. However, this is not always the case, in most situations, some of the samples of the given classes are ambiguous and seem to belong to more than one class. The neural networks converge if there is a separable plane between classes. If this is not the case, the neural network may not converge. In this case, there are some fuzziness of the membership of a test pattern to more than one class. The fuzzy classifiers are more useful in this case, and also perform better.
Additionally, the Bayesian classifiers guarantee the optimal error rate in classification in case of previously knowing the prior probabilities and class densities. The available sample size should be large enough for perfect classification. How-ever, if one of the previous conditions is violated, theknearest neighbor (knn) classifier, and also the fuzzy knn, classifiers present better alternative to the Bayesian classifiers, and also perform more better. Another advantage of using knn and fuzzyknnis the simplicity and the economical computational requirements.
The nearest neighbor classifier is a non parametric classi-fication algorithm. The problem addressed by the nearest neighbor classifier (NN) is the assignment of unknown test patternxto one of the given classesCi. The solution given by
the NN classifier is the minimum distance that could be computed using the Euclidean distance or any other distance. For example, the Euclidean distance is given by equation(1)
as: d¼ ffiffiffiffiffiffiffiffiffiffiffiffiffiffiffiffiffiffiffiffiffiffiffiffiffiffiffiffiffiffiffiffiffi Xn j¼1 ðjCiðjÞ xjÞ2 s ð1Þ wherenis the feature vector size. Next, the unknown patternx
is assigned to the class with minimum distance. It is shown that, the error rate of theNNclassifier is bounded by no more than twice the error rate obtained by Bayesian classifier. Additionally, in theknnclassifier, askincreases, the error rate decreases asymptotically. There are some problems with the
NN classifier. The most important problem is the equal dis-tance problem between the test pattern and more than one class. This problem is partially solved using theknnclassifier. In this classifier, the k nearest neighbors are computed. The test pattern is classified as belonging to the class with the maximum number of neighbors. However, NN, and knn, al-gorithms are still suffering from some other problems. The most important problem is that, they treat all samples with equal importance. However, this is not always the case, especially when there are some outliers in the given samples. An additional problem arises when the test pattern has an equal k to more than one class. In this case, an ambiguity occurs. Another problem is that, once a test pattern is assigned to a certain class, no indication of a class membership could be inducted[11].
The previous problems lead to the development of the fuzzy
knn[11]that could give a fuzzy decision on the test pattern. The fuzzy knn assigns a membership value to a sample pattern, and then assign a membership value to each class, and assign the class label to the maximum membership value rather than assign this pattern to a particular class. The vari-ablemdetermines the amount of the weights of the distances that could give larger weights to near patterns and lower weights to farther patterns. The fuzzy nearest neighbor algo-rithm (fuzzyknn) is introduced in Ref.[11]. The classification results of fuzzyknnshows the superiority of this classifier over other crispknnand other classifiers such as linear discriminant functions, Bayesian, and neural networks classifiers. An extensive survey on fuzzyknncould be found in Ref. [12]. 2 T.M. Mohamed / Future Computing and Informatics Journal 3 (2018) 1e6
Letxbe a training set, composed of Ninstancesx¼{x0,
x1,…, xN} which belong to C classes [10]. Let Q be the test
pattern. The fuzzy membership function of each training patternUcðxÞis given by equation(2). Here,nncis the number
of instances belonging to classcfound among thekin
neigh-bors ofx. The initialk,kin, is a constant that could take a value
in the interval from 3 to 9[10].
UcðxÞ ¼ 8 > > > < > > > : nnc kin *0:49þ0:51; if c¼w 0:49* nnc kin ; otherwise 9 > > > = > > > ; ð2Þ A test pattern is classified using the maximum votes that are given by equation(3). Vkj;c ¼Uc kj :1.Qkj 2=ðm1Þ Pk i¼1 1 . ðkQkikÞ 2=ðm1Þ ð3Þ
wherekjis thejnearest neighbor.mis a constant often set to 2 [10,11].
3. Related work
Eatough et al. [4] propose the first machine learning approach in candidate selection problem. In their work, each candidate was reduced to a set of twelve numerical feature values. They used an artificial neural network to select pulsars from candidates. Bates et al.[6]describe the candidates using ten further numerical features to train neural network classi-fiers. Morello et al.[2]propose the SPINN system that uses the neural network by using a set of six features. In Ref.[3], the authors present the PEACE (Pulsar Evaluation Algorithm for Candidate Extraction). The authors claim that, the algorithm improves the efficiency of identifying pulsar signals [3]. Recently, in Ref.[1], the authors study the candidate filtering problem used during the past fifty years [1]. The authors propose a new method for selecting candidates using a Gaussian Hellinger Very Fast Decision Tree (GH-VFDT). They also propose a new set of features. The authors also evaluate the proposed algorithm on three pulsar candidates datasets using five different classifiers.
It is shown from the previous literature survey that, the machine learning techniques are new to the field of pulsar selection process. Until recently, the process was performed manually. However, the limitations of the manual process and the huge amount of data make the manual selection process impossible and impractical. Also, it is noted that, neural net-works are the dominant classifiers used in this arena. To the maximum of our knowledge, there is no other machine learning approach that being used in solving this problem, except the modified decision tree introduced in Ref.[1]. 4. The proposed algorithm
The proposed algorithm is a fuzzyknnalgorithm proposed to solve the pulsar selection problem. The proposed algorithm
operates on HITRU2 dataset containing 8 input features {X1, …, X8}, and one output variableY. The data set contains 1639
pulsar patterns and 16259 non pulsar patterns with a total of 17898 patterns. The proposed algorithm aims to enhance the accuracy, F-score, and the G-mean of the classification pro-cess. A test pattern x is used with an input samples matrix containing the sample vectors.
As, a pre processing step, the correlation matrix is con-structed to discover the relationship between the input features with each other, and also the relationship between the input features and the response variable Y. Then, the membership values of each sample is computed. By using the membership function described by equation (2), all nearest neighbors are given a high membership to the class they are near from. However, the samples that are far from a class will be given a small membership value to this class.
Once the membership values are computed, the minimum distance is computed between the test pattern x and all sample vectors using equation (3). To compute the distance, the Euclidean distance described by equation (1), may be used or any other distance metric. These steps may be repeated if there are more than one pattern to be tested. The complete algorithm for pulsar selection is shown in Algorithm 1 listing.
The main advantage of using fuzzyknnclassifier is that, it doesn't assign a hard crisp membership that is used in the originalknn. The“fuzzification”process ensures voting from different samples belonging to more than one classes, using the membership function, that may be considered as a weighted voting. The algorithm performs better if thekfolds cross validation is used [13]. Thek-fold cross validation is a technique used for better evaluation of classification algo-rithms. In this algorithm, the initial data are randomly parti-tioned intokmutually exclusive subsets, called folds,D1,D2,
…,Dk. Each fold is approximately of equal size. The training
and testing processes are performed ktimes. In iterationi, a partition Di is reserved as the test set, and the remaining partitions are used together for training[13].
5. Experimental results
In this section, we will illustrate the classification results and evaluations of the proposed algorithm. In our experiments, we use MS Excel 2007 for figures drawing and some
Algorithm 1: Fuzzy knn Pulsar Selection Algorithm
Input: Test patterns matrix T, A candidate pulsar x, k
Output: A decision for x which is pulsar or not
Steps:
1. Construct the correlation matrix discovering features relationship 2. Find the distance between and T by Euclidean distance 3. Select ( pick) the first k samples (shortest distances)
4. calculate the membership values to the k samples (soft labels) using equation 2.
5. calculate the membership value to the two classes using equation 3 6. Set the final class label = max
7. Repeat steps 2-6 if there are more than one test pattern 8. Use many folds to efficiently evaluate the classifier
computations. The Matlab R2012a is used for fuzzy knn
implementation and results evaluation.
Firstly, we define some evaluation metrics that will be used in the comparison. The true positive (TP) is the number of candidate patterns that are already pulsars, and are also being classified as pulsars. The true negative (TN) is the number of candidates which are non-pulsars and also being classified as non pulsars. However, the false negative (FN) is the number of actual pulsar candidates that are incorrectly being classified as non pulsars. The false positive (FP) is the number of non-pulsars candidates that are incorrectly being classified as pulsars. The equations from 4 to 10 gives some important additional metrics that are computed for comparisons. More information about these metrics could be found in Refs.[1,9]. In general, good classifier should maximize the accuracy, precision, recall, F-score, specificity, and G-mean. However, the false positive rate (FPR) should be minimized.
Accuracy¼ TPþTN TPþTNþFPþFN ð4Þ FPR¼ FP FP þTN ð5Þ Precision¼ TP TP þFP ð6Þ Recall¼ TP TP þFN ð7Þ
Fscore¼2 precision recall
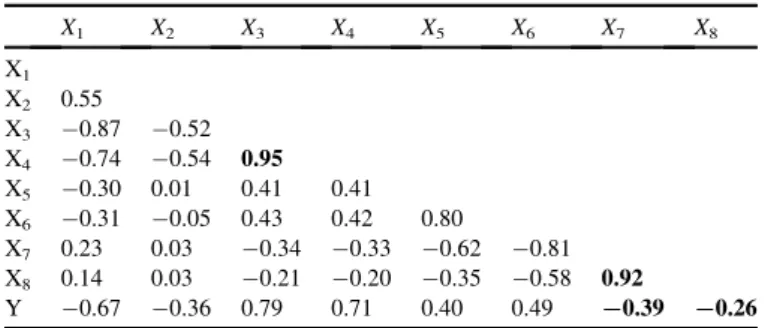
precision þrecall ð8Þ Specificity¼ TN FP þTN ð9Þ GMean¼ ffiffiffiffiffiffiffiffiffiffiffiffiffiffiffiffiffiffiffiffiffiffiffiffiffiffiffiffiffiffiffiffiffiffiffiffiffiffiffiffiffiffiffiffiffiffiffiffiffi TP TPþFN X TN TNþFP s ð10Þ In our experiments, all these metrics are computed to evaluate the performance of the proposed algorithm.Table 1
shows the correlation matrix [13] between the features Xi
together, and between the features and the response variableY
(the output). It is clear that, most of the correlation values are normal.
However, there are four exceptions which are bolded. The first exception is between the input features X3 and X4 in
which the correlation value equals 0.95 which is a strong correlation. Suggesting that, removing one feature of them may enhance the classification accuracy as the two features depend on each other. The second exception is between the features X7and X8which is also a strong positive correlation
equals 0.92. The third exception is between the input variable X7and the response variable Y which equals0.39. This is a
weak correlation between the input and the output suggesting that, removing X7from the classification process may enhance
the classification process. The final exception is between the input variable X8 and the output variable Y which is also a
weak correlation equals0.26, suggesting that, removing the variable X8 may enhances the classification accuracy. From
these results, we make our experiments considering three cases; the first case is to use all input variables together in the classification. The second experiment is to remove both vari-ables X3, X8and perform the classification. The final case is to
remove only the variable X8and consider all other variables in
the classification. All these cases are shown next.
Regarding the work presented in Ref.[1], the authors eval-uate the pulsar selection problem using five different classifiers; C4.5, MLP, NB, SVM, and their proposed GH-VFDT fiers. The authors claim that, their proposed GH-VFDT classi-fier outperforms the other four classiclassi-fiers. However, we will show here that, our proposed classifier outperforms all these five classifiers in many other evaluation metrics.
Fig. 1shows the evaluation comparison of the six classifiers (the five classifiers compared in Ref. [1], and our proposed algorithm). The comparison here regarding the accuracy of the classifiers computed using equation(4). Here, we consider all eight input variables (features). It is clear from the figure that, the proposed algorithm outperforms the other five classifiers compared in Ref.[1]. However, although our proposed algo-rithm outperforms the other five classifiers, the accuracy dif-ference between our algorithm and the GH-VFDT classifier is not very large. Comparing to the other four classifiers, our proposed algorithm has a significant performance increase compared to these algorithms.
The G-Mean computed from equation (10)is very impor-tant in pulsar selection problem [1]. Fig. 2 shows the Table 1
The correlation matrix between features and output.
X1 X2 X3 X4 X5 X6 X7 X8 X1 X2 0.55 X3 0.87 0.52 X4 0.74 0.54 0.95 X5 0.30 0.01 0.41 0.41 X6 0.31 0.05 0.43 0.42 0.80 X7 0.23 0.03 0.34 0.33 0.62 0.81 X8 0.14 0.03 0.21 0.20 0.35 0.58 0.92 Y 0.67 0.36 0.79 0.71 0.40 0.49 ¡0.39 ¡0.26 Bold indicates maximum values and minimum values.
Fig. 1. Accuracy comparison. 4 T.M. Mohamed / Future Computing and Informatics Journal 3 (2018) 1e6
performance comparison of the G-mean of the six classifiers. The figure shows a significant increase in the G-mean of the proposed algorithm compared to the other five algorithms. It outperforms the MLP classifier by about 0.02, and out-performs the other classifiers by much more values.
Fig. 3 shows the performance comparison of the F-score shown by equation(8). The importance of F-score is that, it combines both the recall and the precision in one equation. Again, it is clear from Fig. 3 that, the proposed algorithm outperforms the other five algorithms in the F-score value.
Fig. 4 shows the performance comparison of the false positive rate (FPR) compared to the other five classifiers.
Although, the proposed algorithm does not give the minimum FPR, however, it performs as the second ranked algorithm among the six classifiers. The first rated algorithm here is the GH-VFDT classifier proposed by Ref.[1]. In general, the FPR is required to be decreased to avoid extra telescope time for re-inspection of candidates by telescopes.
Table 2 shows more on the performance of the proposed algorithm using different features. There are three columns, the first column is the results obtained by using all input features. The second column gives the results obtained by excluding the variable X8from classification. The third
col-umn gives the results obtained by excluding both variables X3
and X8. Excluding of these variables is based on the
correla-tion matrix obtained from Table 1 It is clear from the table that, using all features and excluding the variable X8only are
comparable in performance. Suggesting that, excluding of X8
leads to simplify the calculations as the number of features included in the computation are decreased. Moreover, both F-score and G-mean are enhanced by excluding the feature X8.
However, by excluding both features (X3, X8), the
perfor-mance is slightly decreased compared to the other two cases. This conclusion is very important, as opposite to the work in Ref. [1], which claim that, all features are important in the classification process.
Table 3shows the effect of using differentkvalues, in the cross validation process. The proposed algorithm is evaluated using different kvalues; 3, 5, 12, and 20. In all experiments, the constantm, described in equation(3), equals 0.3. It is clear that, there is no significant changes, of the performance met-rics, between the different values of k. Suggesting that, the proposed algorithm is robust using the different values of k. However, the best performance parameters are obtained using values of kequals 5 and 12.
6. Conclusions
Pulsars are rare type of stars that emit radio signals detected from the earth. The process of pulsar selection is very complicated, and impractical to be performed manually. The neural network techniques are not always appropriate as there Fig. 2. G-mean comparison.
Fig. 3. F-score comparison.
Fig. 4. FPR comparison.
Table 2 Features effects.
All Excl. 8 Excl. 3, 8
Accuracy 0.978 0.978 0.972
f score 0.873 0.875 0.834
G-mean 0.961 0.962 0.954
FPR 0.17 0.17 0.23
Table 3
Effects of k fold cross validation using all features.
K¼3 K¼5 K¼12 K¼20
Accuracy 0.977 0.978 0.978 0.977
f score 0.866 0.873 0.870 0.870
G-mean 0.965 0.961 0.965 0.953
are some fuzziness in the features of the candidates. In this paper, we present a novel fuzzy knntechnique to be used in pulsar selection process.
Results show that, the proposed algorithm outperforms five other classifiers in both accuracy, F-score, G-mean, and also in some other metrics. Results also show that, the features are not equally important. Further research is required to address the importance and relationship between the input features. The proposed algorithm is applied to the HITRU 2 dataset which is the latest dataset in pulsar selection domain.
References
[1] Lyon RJ, Stappers BW, Cooper S, Brooke JM, Knowles JD. Fifty years of pulsar candidate selection: from simple filters to a new principled real-time classification approach. Mon Not R Astron Soc June 2016;459(1): 1104e23.
[2] Morello V, Barr ED, Bailes M, Flynn CM, Keane EF, van Straten W. SPINN: a straightforward machine learning solution to the pulsar candidate selection problem. Mon Not R Astron Soc 2014;443(2): 1651e62.
[3] Lee KJ, Stovall K, Jenet FA, Martinez J, Dartez LP, Mata A, et al. PEACE: pulsar evaluation algorithm for candidate extractionea software package for post-analysis processing of pulsar survey candidates. Mon Not R Astron Soc 2013;433(1):688e94.
[4]Eatough RP, Molkenthin N, Kramer M, Noutsos A, Keith MJ, Stappers BW, et al. Selection of radio pulsar candidates using artificial neural networks. Mon Not R Astron Soc 2010;407(4):2443e50. [5]Thornton D. The high time resolution radio sky. PhD thesis. University of
Manchester; 2013.
[6]Bates SD, Bailes M, Barsdell BR, Bhat NDR, Burgay M, Burke-Spolaor S, et al. The high time resolution universe pulsar surveyeVI. An artificial neural network and timing of 75 pulsars. Mon Not R Astron Soc 2012;427(2):1052e65.
[7]Lorimer DR, Kramer M. Handbook of pulsar astronomy. Cambridge University Press; 2005.
[8] The HTRU2 data set, last visited Nov. 13, 2017https://archive.ics.uci. edu/ml/datasets/HTRU2.
[9]Powers D. Evaluation: from precision, recall and F-measure to roc, informedness, markedness&correlation. J Mach Learn Technol 2011; 2(1):37e63.
[10]Derrac J, Chiclana F, García S, Herrera F. Evolutionary fuzzy k-nearest neighbors algorithm using interval-valued fuzzy sets. Inf Sci J Feb. 2016; 329:144e63. ELSEVIER.
[11]Keller JM, Gray MR, Givens JA. A fuzzy k-nearest neighbor algorithm. IEEE Trans Syst Man Cybern 1985;15(4):580e5.
[12]Derrac J, García S, Herrera F. Fuzzy nearest neighbor algorithms: tax-onomy, experimental analysis and prospects. Inf Sci J 2014;260:98e119. [13]Han J, Pei J, Kamber M. Data mining: concepts and techniques. 3rd ed.
Elsevier; 2011.