November 10, 1998 1
"Instrumenting the enterprise":
implementing an enterprise-level
performance management system
by Ian Gilmour
In the past decade, inefficient public water and wastewater utilities have become prey to private operators. Because of enormous investment requirements in infrastructure, these utilities represent a natural monopoly with significant profit potential.
The Toronto Works and Emergency Services Department is no exception. As a publicly owned and operated utility, it supplies water and sewage treatment services through 4 water plants and 3 sewage plants to the City of Toronto with a population of 2.2 million citizens. Over the years, the utility has become 35-45% less efficient than "best-practice" utility operators.
To close this "competitiveness gap", the Department commissioned the Works Best Practices Program. Jim Coe, the program manager, defined its mandate as follows: "The goal is to save approximately $37M annually in operating budgets by completely redesigning and substantially automating Works operations, maintenance and support services. We are specifically emphasizing broadly redesigned work practices, enabled by key, strategic technologies and organizational transformation. The program plans to invest $110M over five years in an enterprise-wide business process re-engineering and automation program." The program involved Works staff and consultants in a major business redesign effort to apply industry best practices to design a cost efficient model of plant operations and maintenance. The future plant model would still need to meet, and even exceed, exacting regulatory standards for water and wastewater treatment. How could the utility undertake such wholesale changes in operations and information systems without
jeopardizing its environmental responsibilities?
The program recommended the early deployment of an enterprise-level Performance and Operations Management System (POMS). It would provide rapid and continuing feedback on the quality, effectiveness and efficiency of each operation as it was being re-engineered. POMS would signal plant staff and
management if a particular operation were in danger of missing its regulatory mandate. It would also help predict whether the anticipated efficiencies would be achieved.
Implementing POMS was a significant technical and management challenge. POMS would receive its performance data from applications to be implemented over five years. POMS must be integrated with each system. POMS also supports performance management and continuous improvement as a new management style. Works management was expected to move from a traditional command and control style to a culture that delegated decision making and problem solving to the lowest appropriate level in the organization. To successfully implement POMS, the project team had to closely synchronize systems engineering with business practice changes. Fortunately, the change management and automation method chosen by the Works Best Practices Program combined the two disciplines of systems and business engineering. The program method was based on convergent engineering®, developed by David Taylor1.
Convergent engineering is a model-based, iterative method that combines business and systems engineering. It uses four phases to redesign and automate business practices: analysis, design, construction and
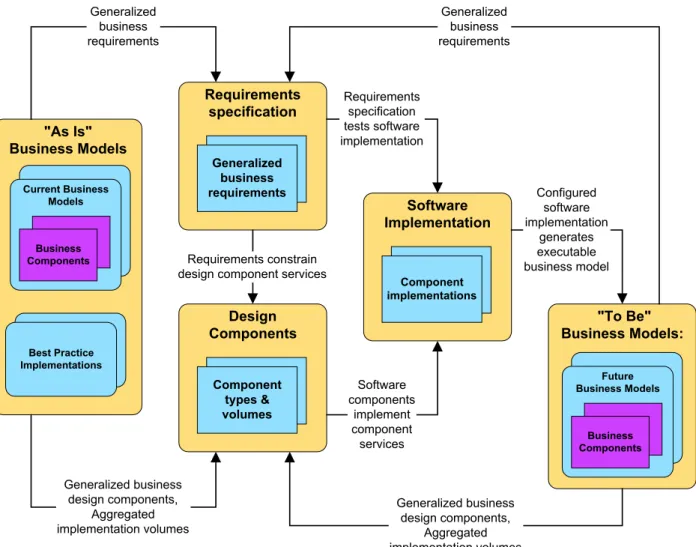
deployment. The convergent engineering process generates an "as is" business model of current practices and a "to be" business model of future business practices. To move from the current to the future model, the process develops three intermediate deliverables:
• A business and technical requirements specification • A set of business and technical design components
• A software implementation.
Figure 1 illustrates the model-driven approach of convergent engineering. Table 1 summarizes how each deliverable is created and updated throughout the process.
Figure 1. Model-driven approach
Requirements specification Software Implementation "To Be" Business Models: Design Components "As Is" Business Models Current Business Models Current Ontario Government ProgramsBest Practice
Implementations Business Components Generalized business requirements Generalized business requirements Generalized business design components, Aggregated implementation volumes Requirements constrain design component services
Software components implement component services Component types & volumes Future Business Models Business Components Component implementations Requirements specification tests software implementation Configured software implementation generates executable business model Generalized business requirements Generalized business design components, Aggregated implementation volumes
November 10, 1998 3 Table 1. Deliverable development throughout convergent engineering process
Deliverable Analysis Design Construction Deployment
As is business model Identify problems in current model Train staff in changes to current model To be business model Envision objectives & solutions to implement in future model Instantiate components in workshops & prototypes Instantiate components in test environments Configure & instantiate components in acceptance test & production environment Requirements specification Populate with business requirements as use cases Identify technical requirements Instantiate requirements as scenarios Use scenarios as functional & integrated test cases
Use scenarios as acceptance test cases
Design components
Populate with types of business components Define technical architecture Identify technical component types Define interfaces & collaborations among components Map component types to component implementations Software implement-ation Identify software implementation (build, buy and/or assemble)
Build, assemble and extend component implementations
Deploy in user acceptance test & production environments
Analyzing the required business change
The POMS project began by describing the nature, purpose and scope of business change in a white paper on performance management. The paper was widely circulated throughout the Water and Wastewater Division. It emphasized that managers are to manage the performance of the business, not the individuals in the business.
The paper conceived of the utility as a "value web" with resources flowing from one "performance center" to another. Like a manufacturing line, the output of one performance center might be an input to another. For example, one performance center might pump raw lake water to a filtration plant (a second center) for purification. The mission of each performance center is to produce value-added products and services using input resources in response to demand (see Figure 2). Individual "performance indicators" measure a specific performance dimension (eg, quality or efficiency) for a given performance center or resource flow.
Figure 2. A performance center
Performance
Center
How effective is the centre in responding to demand? How efficient is the center in using input resources to produce products & services?Demand flow:
What is the quantity, quality & value of what
the center is asked to process?
Output flow:
What is the quantity, quality & value of products & services produced by the center?
Input resource flow:
What is the quantity, quality & value of resources
used by the center to produce products
& services?
Performance centers are "fractal": they contain other performance centers at different levels. Performance centers were identified at the following levels in the utility:
• Division • Plant • Work area
• Process area (eg, filtration, containing a bank of large-scale filters) • Process stream (eg, a particular filter).
Once the utility agreed in principle to fundamental changes to its management approach, the team began to derive a set of business requirements, such as:
• Identify and configure performance centers, resource flows, and performance indicators • Capture source measurements and calculate derived measurements
• Set performance targets and report performance against targets. Requirements were specified as high-level use cases.
Based on the future business model and the requirements specification, the team identified the required types of business objects or components. Components included such business concepts as performance center, resource flow, performance indicator, and measurements. An analysis of the current and anticipated structure of the Works Department estimated the size of the future business model. It will have
approximately 600 performance centers, covering seven plants and the collection and distribution system (reservoirs, pumping stations, etc.) These performance centers will source or derive approximately 90,000
November 10, 1998 5 The Executive Information System (EIS) market produced applications that had some required functions. Unfortunately, they could not scale to handle thousands of daily measurements. The team discovered Alacrity Results Management (ARM), a framework of business components designed for performance measurement. The components were implemented in Smalltalk in a very scalable three-tier environment. The ARM vendor, Alacrity Inc, agreed to extend their framework to handle hourly, shift, daily and weekly measurements.
Generating a design
To ensure that Alacrity had a clear specification for their extended components, the team conducted responsibility-driven design workshops with Works and Alacrity staff.2 Each workshop developed and extended the design of the business components to meet a set of related requirements. For example, a workshop might design the components required to manage source measurements. Scenarios instantitated each requirement. For example, the team created a scenario to measure the hourly flow of centrate liquid produced as a byproduct from a centrifuge, to illustrate the requirement to source an hourly measurement for a resource flow.
The business components involved in each scenario were documented on a CRC card (Class-Responsibility-Collaborator Card).3 Workshop participants played instances of the business components. For example, the participant playing the centrifuge (an instance of a performance center) might be asked for its total centrate flow in the past hour. The centrifuge component collaborates with the centrate component (an instance of a resource flow) to request its total flow for the period. The centrate component creates a flow measurement (an instance of a source measurement) and passes it back to the centrifuge. Participants recorded the responsibilities of their components on the CRC cards along with their collaborators.
Recording responsibilities defined the interface of each business component. After the workshop, systems designers mapped responsibilities to the services or "API" of the components. During system design, the Department implemented a pilot "work area" to begin implementing best practices for operations and maintenance. (A work area has a team of employees dedicated to operate a clearly delimited part of the business). The pilot was in the solids removal building of the Highland Creek Treatment Plant.
To support the work area, the POMS team created an Excel spreadsheet prototype of POMS. The POMS prototype provided feedback on:
• The performance measurements that were most useful in managing the work area
• The degree of acceptance of, and resistance to, performance management and continuous improvement. With the rest of the Works Best Practices Team, the POMS team participated in designing the technical architecture within which POMS would function. A multi-tiered architecture used message-oriented middleware to support asynchronous communications between applications. The project selected ActiveWeb, from Active Software, as the middleware.
With the help of custom-developed adapters, each source system published hourly, daily, weekly or monthly measurement events (see Figure 3). The ActiveWeb information broker routed the measurement events to the POMS adapter. The adapter then communicated the event as a source measurement to the ARM server. Users could view the performance measurements derived from the source measurements via the ARM client.
Figure 3. Integration architecture Process Control System Adapter Work Management System Adapter Lab Information System Adapter Finance & Administrative System Adapter Information Broker (ActiveWeb) Hourly process events Daily work events Daily quality events Daily financial events Performance & Operations Management System (ARM) Adapter Subscribed events
The team then worked on the ARM user interface. POMS was to be used by the Commissioner of Works and Emergency Services and the plant technician alike. Only a planning analyst or engineer could love the original ARM interface. It featured complex explorer-based navigation and cross-tab tables of measurement values. It would never fly at the plant floor level.
Works staff indicated that plant personnel were more oriented to a graphical presentation of the business model using wall-mounted control panels or SCADA graphics. The team generated a set of requirements and a design for the user interface:
• POMS would provide a visualization of the business model through a series of drill-down control panels showing resource flows between centers (see Figure 4 for the Solids Work Area control panel)
• Each performance center and resource flow has a dashboard to display statistical process control charts • Each chart shows performance trends for a given indicator (see Figure 5 for a screen print of a control
November 10, 1998 7 Figure 4. Solids area control panel
Solids Work Area
Heat
Treatment Dewatering Incineration
Blended
Sludge TreatedHeat Sludge
Sludge
Cake Ash
Decant
Liquor Centrate
Labour Hydro NaturalGas WaterCity
Exhaust Gas
Parts ServicesPlant
Constructing the software implementation
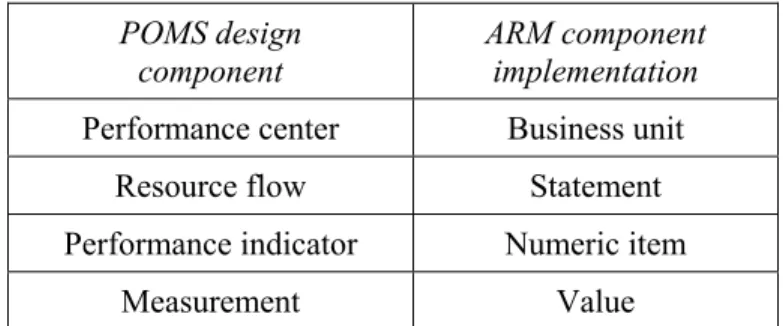
Before Alacrity could assemble POMS components from their existing business objects, the team had to map POMS design components to ARM component implementations. Table 3 illustrates how some of the POMS component types were implemented by ARM components.
Table 3. Mapping POMS design components to ARM implementations POMS design
component
ARM component implementation Performance center Business unit
Resource flow Statement
Performance indicator Numeric item
Measurement Value
The team prepared test cases based on the requirements specification. Approximately 70 high level business requirements were tested (eg, receive a source measurement) with main, alternate and exception scenarios (eg, receive a source measurement, receive an out-of-range source measurement). Alacrity delivered weekly builds of the client and server applications for functional testing.
After functional testing, the team participated in integrated testing to determine that source measurements could be successfully transmitted and received from source systems via the Information Broker and adapters.
The ARM server was implemented in Gemstone Smalltalk. Although Gemstone is a mature object database, the Works Department was committed to relational database technology as a default standard. Works was understandably concerned about introducing an object database into the support mix. During the
construction phase, we had an opportunity to compare the performance of POMS under a relational database with the performance of the Gemstone object database. The results, as you will see, were impressive. While Alacrity was revamping the graphical user interface, the team decided to put a functional POMS prototype into service to supplement the Excel prototype in the work area. The prototype was developed in PowerBuilder 5 with a SQL*Server database. It focussed on critical operational measures for the work area such as hourly, daily and weekly throughput as well as key quality and effectiveness indicators.
The prototype generated weekly performance reports in addition to the statistical control charts. Once a week, the team took the daily log sheets from the work area and keyed them into the prototype prior to a weekly meeting in the work area. The team discovered that the prototype took approximately two hours to calculate a week's worth of derived measurements at shift, daily and weekly frequencies on a Windows NT server. To get this level of performance required programming of stored procedures in SQL*Server, since initial runs were taking about four hours. Many of the calculations were extremely complex. Some calculations blew the database's stack depth for stored procedure calls.
The team was able to compare the performance of the prototype with the ARM product as it underwent performance testing. To test ARM performance, the team loaded six months worth of source measurements and invoked a global calculation of derived measurements. The ARM server, running on a comparable NT machine, crunched through the batch data in approximately one hour. The ARM calculation throughput was
November 10, 1998 9
Deploying the future business model
While working on the software implementation, the team "deployed" a prototype of the performance management business model in the work area, supported by Excel spreadsheets. This technique of early implementation of the practices provided critical feedback into the development of the model. For example, the work area resisted reporting performance against targets. The POMS team introduced statistical process control functions into the model to ensure that targets were set based on a realistic assessment of the current capabilities of each process, rather than arbitrary, top-down objectives.
During integration testing, the team configured the business model for deployment in the pilot work area for user acceptance testing and training. The team ran a parallel operation during deployment, taking over the spreadsheet prototype while the work area staff began using POMS. In addition to manually entered measurements, POMS began receiving automated measurements across the middleware from three other applications: Process Control, Work Management and the Finance and Administration System.
Resources and schedule
During the project, the POMS team had the following resources: • A 1/2 time project leader:
• 1 business analyst • 1 systems designer
• 1 test coordinator from the design phase on
• 1.5 Systems integrators/developers from the design phase • part time clerical support.
The project cost $1.4 M to design, build and deploy POMS in the pilot work area. It was scheduled to take 12 months from inception to deployment. It took 18 months. The project was delayed by two major factors: 1. The amalgamation of 6 local municipalities into the City of Toronto (the Department grew from 1,100
to 9,600 employees during the project).
2. Project management difficulties arising from the integration of three concurrently deployed applications (POMS, Work Management and an interim Process Control System).
Conclusions
In the last quarter of 1998, the team began deploying POMS in two more work areas in the pilot plant and one work area in the Water Supply organization. The Highland Creek plant began the project with 120 staff. It now operates with 79 staff. When plant automation is completed, it will require only 55 staff. The POMS system has also confirmed the belief that significant energy savings could be achieved by shutting down the heat treatment process in the solids work area without jeopardizing regulatory targets.
During the analysis phase, the project team was sobered to discover that the history of performance management systems in the utility business was littered with expensive failures. POMS is a usable performance management system for two key reasons:
1. The model-driven approach tamed the essential complexity of analyzing, designing, implementing and deploying an integrated, enterprise-level application
2. The parallel and iterative process of implementing practices in the work area while designing and developing the enterprise-level application turned up significant business requirements to feed into the process.
1 Taylor, David A, Business Engineering with Object Technology, John Wiley & Sons, Inc., 1995. Convergent engineering is a registered service mark of Enterprise Engines Inc.
2 Wirfs-Brock, Rebecca, et al, Designing Object-Oriented Software, PTR Prentice Hall, 1990 3 Bellin, David, et al, The CRC Card Book, Addison Wesley., 1997
Ian Gilmour ([email protected]) is the Associate Director of the Convergent Engineering Institute, a
consulting and training organization that specializes in implementing enterprise-level business models. He is the POMS project leader.