Computational Framework for Data-Independent
Acquisition Proteomics
By
Chih-Chiang Tsou
A dissertation submitted in partial fulfillment
of the requirements for the degree of
Doctor of Philosophy
(Bioinformatics)
in The University of Michigan
2016
Doctoral Committee:
Associate Professor Alexey I. Nesvizhskii, Chair
Professor Philip C. Andrews
Assistant Professor Brent R. Martin
Associate Professor Kayvan Najarian
Associate Professor Maureen Sartor
ii
Acknowledgements
First of all, I would like to thank my research mentor and dissertation advisor Dr. Alexey Nesvizhskii for the guidance towards the completion of this dissertation and giving me the opportunity to participate such an interesting project. Also, the work presented in this dissertation would not have been possible if we did not have all the supports and collaborations with Dr. Anne-Claude Gingras and her lab members. Her complementary insights on mass spectrometry and biological applications have tremendously helped the developments of the project. I am also grateful to have Dr. Philip Andrews, Dr. Brent Martin, Dr. Kayvan Najarian, and Dr. Maureen Sartor as the thesis committees. Their useful inputs and critical comments on the dissertation have been very important for me to finish the dissertation. I also would like to thank the guys in Nesvizhskii lab and all my friends, thank you for the constant supports and the company.
This dissertation is dedicated to my family, especially my lovely wife Wan-Hui Chang. I could not have finished the degree without her generous supports. Our two year old daughter, Annie, has been the greatest joy in my life and further motivated me to complete the degree and pursue the professional career in the next stage.
iii
Table of Contents
Acknowledgements ii
List of Figures vii
List of Tables xi
List of Appendices xii
Abstract xiii
Chapter 1 Introduction 1
1.1 Mass spectrometry-based proteomics 1
1.2 Data dependent acquisition 2
1.3 Data independent acquisition 6
1.4 Spectral library-dependent DIA targeted analysis 8 1.5 Drawbacks of spectral library-based targeted approaches 9
1.6 Motivation 10
Chapter 2 Untargeted proteomics identification analysis for data
independent acquisition data 13
2.1 Background 13
2.2 Methods 14
2.2.1 Sample preparation UPS2, E. coli, and human datasets 14
2.2.2 Mass spectrometric analysis 15
2.2.3 Glycoproteomics SWATH dataset 16
2.2.4 mzXML File conversion 16
2.2.5 Precursor and fragment ion 2D peak detection in DIA-Umpire 16
2.2.6 Precursor-fragment grouping 21
iv 2.2.8 Peptide and protein identification using pseudo MS/MS spectra 25 2.2.9 Peptide and protein identification parameters 26 2.2.10 Targeted extraction analysis using OpenSWATH 28 2.2.11 DIA-Umpire analysis using reduced database 30 2.2.12 Isotopic pattern validation of glycopeptide identifications 30
2.2.13 Code and data availability 31
2.3 Results 32
2.3.1 DIA-Umpire untargeted identification workflow 32 2.3.2 Analysis of experimental and computational parameters used in
DIA-Umpire 34
2.3.3 Untargeted protein identification using DIA-Umpire 40 2.3.4 Comparison between untargeted and targeted DIA analysis 46 2.3.5 Comparison between untargeted and targeted DIA analysis using an
SWATH N-glycopeptide dataset 50
2.4 Discussion 54
2.5 Contributions 56
Chapter 3 Hybrid DIA quantification workflow using DIA-derived
internal library 58
3.1 Introduction 58
3.2 Methods 59
3.2.1 Data processing for datasets 59
3.2.2 Quantification in DDA data 60
3.2.3 Comparison of ion intensities between DDA and DIA 61 3.2.4 Targeted extraction using internal spectral libraries 61 3.2.5 Retention time prediction and mass calibration for target peptide
ions 63
3.2.6 Peptide-centric matching targeted re-extraction 63 3.2.7 Targeted re-extraction U-score probability and FDR 65 3.2.8 Quantification in DIA data using DIA-Umpire 66
v 3.2.10 SAINT interaction scoring for AP-SWATH interactome dataset 69
3.2.11 Data availability 70
3.3 Results 70
3.3.1 DIA-Umpire’s hybrid targeted re-extraction workflow 70 3.3.2 Targeted extraction and protein quantification 71 3.3.3 Application of DIA-Umpire to interactome data 78
3.4 Discussion 83
3.5 Contributions 84
Chapter 4 Improved DIA-Umpire pipeline for Untargeted, spectral library-free analysis of Orbitrap DIA data 85
4.1 Introduction 85
4.2 Methods 87
4.2.1 Q Exactive datasets 87
4.2.2 Orbitrap Fusion datasets 88
4.2.3 Definition of datasets 89
4.2.4 DIA-Umpire pseudo MS/MS extraction 89
4.2.5 Filtering of detected features using fractional mass and isotope
peak pattern 90
4.2.6 DDA and DIA (pseudo) MS/MS database search 94 4.2.7 FDR estimation independently for each DDA/DIA run 94 4.2.8 FDR for peptide ion identifications in DDA data at the dataset level
95 4.2.9 FDR for protein identifications in DDA data at the dataset level 96 4.2.10 Generation of the spectral library for targeted re-extraction in DIA
data 96
4.2.11 Targeted re-extraction scoring function 97
4.2.12 Posterior probabilities of correct identification at the targeted
re-extraction step 100
4.2.13 Combing untargeted and targeted re-extraction identification
vi 4.2.14 FDR for peptide ion identifications in DIA data at the dataset level 103 4.2.15 FDR for protein identifications in DIA data at the dataset level 103 4.2.16 Targeted re-extraction analysis using external libraries 104
4.2.17 Data availability 106
4.3 Results 107
4.3.1 Improved feature detection using fractional mass and isotope
pattern filters 107
4.3.2 Q Exactive DIA datasets 111
4.3.3 Orbitrap Fusion DIA datasets 117
4.3.4 Performance of semi-parametric mixture modeling 122
4.3.5 Performance of external library searches 124
4.4 Discussion 129
4.5 Contributions 131
Chapter 5 Conclusions and future directions 132
Appendices 138
vii
List of Figures
Figure 1-1 Illustration of LC-MS data and isotope peaks of a peptide precursor. ... 3 Figure 1-2 Illustration of the difference between DDA and DIA. ... 5 Figure 1-3 Untargeted and targeted data analysis strategies and DIA-Umpire hybrid framework ... 11 Figure 2-1 DIA-Umpire signal extraction algorithms. ... 17 Figure 2-2 Examples of co-eluting peptide ions. ... 19 Figure 2-3 Retention time differences for peptide ions commonly identified between DDA replicates. ... 29 Figure 2-4 Example of precursor peptide ion and fragment ion LC elution signals and the corresponding pseudo MS/MS spectrum generated by DIA-Umpire. ... 33 Figure 2-5 PeptideProphet analysis of X! Tandem search results using DDA and DIA pseudo MS/MS data ... 37 Figure 2-6 Effect of MS1 survey scan ion accumulation time on peptide identification using DIA-Umpire. ... 39 Figure 2-7 Untargeted peptide and protein identification using DDA and DIA data from UPS2, E. coli, and human cell lysate samples... 44 Figure 2-8 Comparative analysis of peptide identifications from DDA and DIA data from human cell lysate samples. ... 45
viii Figure 2-9 Comparison between untargeted DIA-Umpire analysis and OpenSWATH targeted extraction: effect of the search space. Human cell lysate data ... 47 Figure 2-10 Number of peptide ion identifications and ambiguous identifications filtered by isotope pattern for each DIA run. ... 51 Figure 2-11 Deamidated peptide identifications ... 52 Figure 2-12 Example of an ambiguous identification involving the deamidated peptide NTTFNVESTK by OpenSWATH targeted search ... 54 Figure 3-1 DIA-Umpire targeted re-extraction using internal library ... 71 Figure 3-2 Increased identification coverage after targeted re-extraction in DIA-Umpire. Human cell lysate DIA data. ... 72 Figure 3-3 MS1-based protein quantification in DIA human cell lysate data... 74 Figure 3-4 MS2-based protein quantification in DIA human cell lysate data... 75 Figure 3-5 Comparison between MS1 and MS2-based protein quantification. Human cell lysate data. ... 76 Figure 3-6 Protein quantification results in the UPS2 standard protein sample. ... 77 Figure 3-7 Application of the entire DIA-Umpire workflow to an AP-SWATH interactome data set. ... 79 Figure 3-8 Distributions of scores computed by the targeted re-extraction algorithm of DIA-Umpire. AP-SWATH dataset, MEPCE bait (biological replicate 3). ... 80 Figure 3-9 The numbers of identified proteins and peptide ions via untargeted spectrum-centric search and targeted re-extraction matching. ... 82 Figure 4-1 Theoretical intensity ratios of ith isotope peak over monoisotopic peak. 92
ix Figure 4-3 Effects of feature detection filtering. ... 109 Figure 4-4 Identification numbers and reproducibility in the Q Exactive DIA and DDA datasets. ... 113 Figure 4-5 Number of identifications as function of FDR in the Q Exactive datasets. ... 115 Figure 4-6 Identification numbers and reproducibility in the Orbitrap Fusion DIA and DDA datasets. ... 119 Figure 4-7 Elution time duration of peptide ions in the first replicate of DIA 10 Da Orbitrap Fusion dataset. ... 121 Figure 4-8 Score histograms and mixture modeling ... 123 Figure 4-9 Venn diagrams of peptide ion identifications from DIA-Umpire analysis ... 126 Figure 4-10 U-score histograms and retention time alignment for the two external library searches ... 128 Figure A-1 Untargeted peptide identification using DDA and DIA data from human cell lysate samples using three search engines combined. ... 138 Figure A-2 Untargeted peptide identification using DDA and DIA data from E. coli cell lysate samples with X! Tandem search engine. ... 140 Figure A-3 Untargeted peptide identification using DDA and DIA data from E. coli
cell lysate samples with three search engines combined. ... 141 Figure A-4 Comparison between untargeted DIA-Umpire analysis and OpenSWATH targeted extraction: effect of the search space. E. coli cell lysate data. ... 142
x Figure A-5 Example of an ambiguous identification of the deamidated peptide NSPLDEENLTQENQDR by OpenSWATH targeted search. ... 143 Figure A-6 Example of an ambiguous identification of the peptide DIENFNSTQK by OpenSWATH targeted search. ... 144 Figure A-7 Example of an ambiguous identification involving the deamidated peptide TGNGLFLSEGLK. ... 145 Figure A-8 Example of an ambiguous identification of the deamidated peptide VAPEEHPTLLTEAPLNPK by OpenSWATH targeted search. ... 146 Figure B-1 Assessment of retention time and MS1 intensity reproducibility of identified peptide ions between DDA and DIA (SWATH) experiments. ... 149 Figure B-2 Protein quantification in AP-SWATH data. ... 151
xi
List of Tables
Table 2-1 Analysis of precursor-fragment grouping parameters ... 35
Table 2-2 Numbers of protein and peptide ion identifications from DDA MS/MS and DIA pseudo MS/MS spectra ... 41
Table A-1 List of the raw files deposited at ProteomeXchange. ... 147
Table C-1 Detailed identification results of HEK-293 Q Exactive dataset ... 152
Table C-2 Detailed identification results of the microtissue Q Exactive dataset ... 154
xii
List of Appendices
Appendix
A. Supplementary materials for Chapter 2 138
B. Supplementary materials for Chapter 3 149
xiii
Abstract
Mass spectrometry (MS) is one of the main techniques for high throughput discovery- and targeted-based proteomics experiments. For years, the most popular method for MS data acquisition has been the so-called data dependent acquisition (DDA) strategy which primarily selects high abundance peptide species for tandem mass spectrum sequencing. In order to reach low abundance peptides, most DDA strategies incorporate stochastic data acquisitions to avoid repetitive sequencing of same peptide over consecutive scan cycles, therefore resulting in relatively irreproducible qualitative and quantitative results for low abundance peptides between experiments. Data independent acquisition (DIA), in which peptide fragment signals are systematically acquired for all the peptides within a certain mass range, is emerging as a promising alternative to address the stochasticity of the conventional DDA. DIA by design results in more complex signals, posing a major computational challenge for complex sample and high-throughput analysis. As a result, targeted extraction which is dependent on pre-existing spectral libraries has been the most commonly used approach for automated DIA data analysis. However, building spectral libraries requires additional amount of analysis time and sample materials which are the major barriers for most proteomics research groups.
In my dissertation, I develop a computational tool called DIA-Umpire, which is comprised of multiple computational and signal processing algorithms to enable
xiv untargeted DIA identification and quantification analysis without relying on any prior spectral library. In the first study, a signal feature detection algorithm is developed to extract and assemble peptide precursor and fragment signals into pseudo tandem mass spectra which can be analyzed by the existing DDA untargeted analysis tools. This novel step enables direct and untargeted (spectral library-free) DIA identification analysis and we show the performance using complex samples including human cell lysate and glycoproteomics datasets. In the second study, a hybrid approach is developed to further improve the DIA quantification sensitivity and reproducibility. The performance of DIA-Umpire quantification approach is demonstrated using an affinity-purification mass spectrometry experiment for protein-protein interaction analysis. Lastly, in the third study, I improve the DIA-Umpire pipeline for data obtained from the Orbitrap family of mass spectrometers. Using several publicly available datasets, I show that the improved version of DIA-Umpire is capable of highly sensitive, untargeted and direct (spectral library-free) analysis of DIA data for the data generated using Orbitrap family of mass spectrometers. The dissertation work addresses the barriers of DIA analysis and should facilitate the adoption of DIA strategy for a broad range of discovery proteomics applications.
1
Chapter 1
Introduction
1.1
Mass spectrometry-based proteomics
Proteomics is the large-scale study of proteins, which includes protein sequence analysis, structural proteomics, interaction proteomics, post-translational protein modification, and etc. It has been greatly accelerated because of the achievements of genomics and mass spectrometry. Genome sequencing provided the blueprint of possible gene products which are comprised of the basis of proteomics, has shifted proteomics field from purely hypothesis-driven science to discovery science. The remarkable breakthrough in ionization techniques, including electrospray ionization (ESI) and matrix assisted laser desorption & ionization (MALDI), have enabled the detection of larger molecules such as proteins and peptides using mass spectrometers. As a result, a combination of liquid chromatography (LC) and mass spectrometry (MS), LC-MS, has rapidly evolved as a powerful technology for high-throughput proteomics analysis in a wide range of discovery-based biological applications. The most popular approach for high-throughput proteomics analysis is the so-called ‘shotgun proteomics’. In a typical shotgun proteomics experiment, proteins are first digested into peptides using a proteolytic enzyme such as trypsin, and the resulting peptide samples are separated using LC coupled online to a tandem mass spectrometer. As peptides elute from the LC column, they are ionized as peptide ions and subjected to a survey scan (MS1) and further to tandem mass
2 spectrometry analysis to obtain MS/MS (also called MS2) spectra. The spectral peaks in MS1 spectra, representing mass-to-charge ratio (m/z) and intensities of detected peptide ions, only indicate the observed molecular mass of peptide species and, are insufficient to uniquely identify them. In order to identify the detailed amino acid compositions of peptides, tandem mass spectrometry isolates ionized peptides with specific mass-to-charge ratio (m/z) by mass filter and breaks the isolated peptide ions into shorter fragments. For an isolated peptide ion signal, also called peptide precursor ion, the fragment signals are recorded as an MS/MS spectrum. Various computational strategies [1] including de novo sequencing and MS/MS database search algorithms can be applied to identify peptide amino acid composition given an MS/MS spectrum. Once peptide sequences are identified, protein inference strategies can further identify protein identities [1, 2].
1.2
Data dependent acquisition
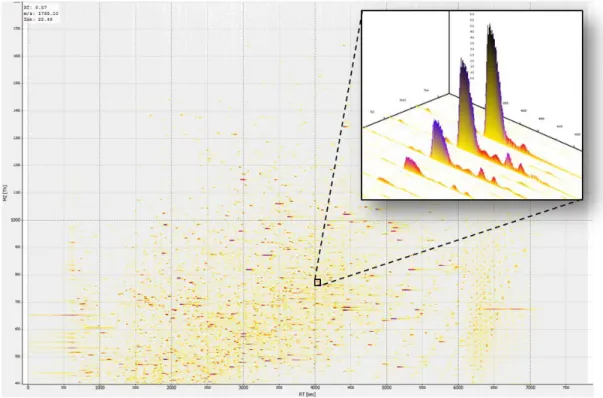
In a typical LC-MS experiment with a complex proteomics sample, digested peptides are separated by LC and ionized into different charged forms, resulting in millions of ionized signals in a single LC-MS run (as the example of LC-MS image shown in Figure 1-1). The number of potential peptide precursor ions increases exponentially if we consider modified peptide species derived from chemical and post-translational modifications. With the huge number of ion signals, the current mass spectrometers do not have sufficient scan speed to acquire an MS/MS spectrum for each one of the precursor signals. As a result, most experiments adopt a compromised strategy called data dependent acquisition (DDA) [3]. In DDA, each
3 scan cycle begins with a MS1 survey scan to detect peptide precursor ions. The m/z
values of the top few most intense peptide precursor ions in the MS1 survey scan are then automatically isolated and fragmented by mass spectrometer to acquire corresponding MS/MS spectra in the following scans, as the illustration shown in Figure 1-2. Dynamic exclusion strategy [4, 5] is often applied with DDA to avoid repetitive sampling of same peptide precursor ions over a short period of time to increase identification coverage. As mentioned above, the MS/MS spectra can be used to identify the peptides and proteins by various computational methods, most commonly by MS/MS database search engines. In a single LC-MS run, DDA can effectively identify 6,000 - 10,000 proteins. For years, DDA has been the most popular approach for high-throughput proteomics experiments.
4
The x-axis is retention time, y-axis is m/z, and each dot represents a possible ion signal with the colors indicating its intensity. The image was exported using OpenMS 1.10 [6].
Despite the wide use of DDA strategy, its limitations are also well known and have been discussed in the literature. Even with a continuously increasing speed of data acquisition, the mass spectrometers are not able to reliably isolate and acquire high quality MS/MS spectra on all peptides present in a typical proteomics sample. Due to the dependency of ion selection on the precursor ion intensity, identification of low abundance peptides is more stochastic and less reproducible between replicate LC-MS analyses. In addition, the selection of a peptide ion for MS/MS sequencing during DDA is not guaranteed to always be at the LC elution peak apex, which may reduce the quality of the MS/MS spectrum and make its computational interpretation more difficult. These issues also affect the accuracy of protein quantification. The spectral-count based quantification strategies, while very robust and easy to use, are most affected by the stochastic nature of DDA. When the quantification is directly based on the number of acquired and identified MS/MS spectra for that protein, robust and sensitive detection of abundance changes across different samples for low abundance proteins becomes difficult due to their naturally small (and variable) spectral counts [7]. MS1 peak intensity-based quantitation approaches allow more sensitive quantification of proteins identified by one or several peptides. However, missing quantification remains a problem which is also caused by DDA’s stochastic acquisition and not all MS1 peaks have MS/MS spectra to identify peptide identity.
5
6
In each LC-MS image, the x-axis is retention time and y-axis is m/z. In each scan cycle, the solid line represents the MS1 survey scan and the dash lines represent the following MS/MS spectra. DDA: Each scan cycle begins with an MS1 survey scan followed by several MS/MS scans. MS/MS scans are acquired based on a smaller size of isolation window for a specific peptide precursor ion. Because the insufficient scan speed, DDA results in more stochastic identification and quantification performance. DIA: Each scan cycle also begins with an MS1 survey scan. In the following MS2 spectra, DIA uses a wider isolation window size to allow systematic acquisition of fragmentation signals across the entire mass and retention time ranges. The wider isolation window size used in DIA causes peptide co-fragmentation and results in more complex MS/MS spectra.
1.3
Data independent acquisition
The alternative to the DDA method are data-independent acquisition (DIA) methods [8-18], where the fragment ion information are acquired for all precursor ions within a certain range of m/z values. By design, DIA results in more complex MS/MS spectra because the signals are from co-fragmentation of multiple co-eluting peptides. The early DIA strategies had to use a very large precursor isolation window (e.g. the entire reliably measurable m/z range in the case of MSE approach)
to keep the duty cycle time within the limits established by the peptide LC elution peak width [8]. Alternatively, the isolation window could be significantly narrowed (e.g. to 1 - 4 Da), but at the expense of splitting the analysis of one sample into multiple LC-MS runs each covering a different range of m/z values [11, 15]. In the first case, the resulting MS/MS spectra were often too complex to be effectively analyzed, whereas in the second case the potential advantages of improved sensitivity of peptide identification were negated by the increase in the overall MS analysis time. As a result, the number of studies employing the DIA strategies for
7 untargeted (discovery) proteomics has trailed significantly those based on the conventional DDA approach. Instead, a variant of DIA – multiple reaction monitoring (MRM) [19-21] – has gained a wider use for targeted protein quantification [22]. In targeted proteomics applications [21] using MRM, the analysis is restricted to a small number of predetermined peptide ions of interest. Selected fragment ions corresponding to these peptide ions are measured continuously over a period of time. This enables building an extracted ion chromatogram (XIC) specifically for these fragment ions, thereby allowing higher sensitivity of detection and better quantitation accuracy for selected peptides of interest.
Recent improvements in MS instrumentation have significantly widened the window of opportunity for applying DIA strategies in proteomics studies. Sequential Window Acquisition of all THeoretical Mass Spectra (SWATH) [16] is a variant of the DIA strategy that takes advantage of the increased scan speed and improved mass resolution available on newer instruments such as AB Sciex 5600 TripleTOF and Orbitrap mass spectrometers. In SWATH MS DIA (and related workflows [16]) an intermediate isolation window size (e.g. 25 Da in SWATH) is used instead of a narrow m/z window as in DDA or a very large window as in MSE DIA. By
sequentially stepping up the m/z windows across the wide mass range (e.g. 400 Da - 1200 Da), fragments of virtually all peptide ions from this range should be present in the corresponding MS/MS spectra (Figure 1-3). Due to the high scan speed resulting in a short cycle time (~ 3.4 seconds for AB Sciex 5600), the high resolution fragment signals in SWATH MS2 spectra can be viewed as high throughput MRM
8 data. As a result, SWATH has been utilized as an alternative to MRM for targeted proteomics quantitation [23-26].
1.4
Spectral library-dependent DIA targeted analysis
Initially, DIA was considered as similar to high-throughput MRM and hence follows the same workflow as in MRM quantitation analysis. To quantify a target protein of interest, extensive prior information is needed to unambiguously locate its peptides in an LC-MS run. This information includes the choice of the peptides to monitor, their retention times and fragmentation patterns. The prior information is usually acquired in a separate analysis using DDA, and summarized in the form of a ‘transition lists’ or ‘spectral library’. The fragment ion intensities for the target peptides in DIA data are then extracted from the data using a targeted extraction approach with the help of spectral library. The concept of targeted extraction was inspired by MRM analysis and has been adopted by different computational tools for DIA analysis including the commercial software PeakView and Spectronaut [27], and the open-source packages such as OpenSWATH [28] and Skyline [29].
To quantify a peptide ion in a DIA file using a spectral library, first the observed fragments, also called ‘transitions’, of the peptide ion are extracted from the library. Based on the observed fragment m/z values, the XICs of the fragments in the DIA MS2 spectra are then built for either the entire retention time range or for a smaller window around the peptide ion observed elution time (or calculated by computational algorithms) from the library. Each fragment XIC across the retention time extraction range is then split into individual peaks (each scattered at different
9 retention time points) by peak detection algorithms, indicating potential retention time spots of the targeted peptide ion from the perspective of the single fragment. Combining all the detected peaks from all the fragment XICs, the targeted extraction tools mentioned above determine a group of co-eluting fragment peaks for the targeted peptide ion using the scoring models such as mProphet [30] and DIANA [31]. Finally, the fragment intensities from the DIA data are then extracted to quantify the peptide. Recent studies have further advanced such targeted extraction approaches to various proteomics applications [32-40] including post-translational modifications [34, 35], protein-protein interaction [35, 36], immunopeptidome [40].
1.5
Drawbacks of spectral library-based targeted approaches
The applications using spectral library-based DIA approach mentioned above require replicate analysis of the same samples using both DDA (to build the spectral library) and DIA (to quantify the target proteins). This essentially doubles the amount of the sample necessary for complete quantitative analysis as well as the MS analysis time. Furthermore, this strategy (as most targeted strategies) relies heavily on the precise knowledge of the peptide retention times, and thus ideally involves retention time calibration using peptide standards (e.g. iRT peptides) spiked-in each analyzed sample. The analysis of DIA data becomes further complicated if the DDA experiments used to build the spectral library were done using a different LC gradient or LC system, a different MS analyzer, or a different fragmentation method, which could lead to deviations in peptide retention times or fragmentation patterns between the DDA and DIA runs. In the analysis of complex samples such as human
10 tissues, retention times of some peptides may vary significantly from sample to sample depending on the number of co-eluting peptides in each sample.
1.6
Motivation
The main motivation behind this dissertation work is to explore and develop computational strategies that would allow taking the advantage of the new generation of DIA strategies such as SWATH for untargeted protein identification and quantitation analysis without any extensive parallel DDA analysis of the same samples. As the conceptual workflow in Figure 1-3 shows the conventional identification analysis of DDA data often relies on MS/MS database search (Figure 1-3a). As mentioned, the analysis of DIA data mostly relies on targeted extraction using spectral library (Figure 1-3b). Therefore, the first aim of this dissertation work is to develop algorithms to transform DIA data into precursor-fragment group data (pseudo MS/MS spectra) which is fully compatible with DDA MS/MS database search engines (spectrum-centric search) so that one can perform untargeted identification analysis directly for DIA data (Figure 1-3c). The second aim of the dissertation is to extend the untargeted analysis to a complete DIA analysis including quantification analysis. When we consider quantification analysis in an experimental setting that includes multiple replicates / samples, retention time alignment and “internal spectral library” searching can be developed to further reduce missing quantification across multiple LC-MS experiments. Lastly, the third aim of this dissertation work is to further improve the algorithms of the pipeline
11 and show its performance using DIA data obtained from different mass spectrometers.
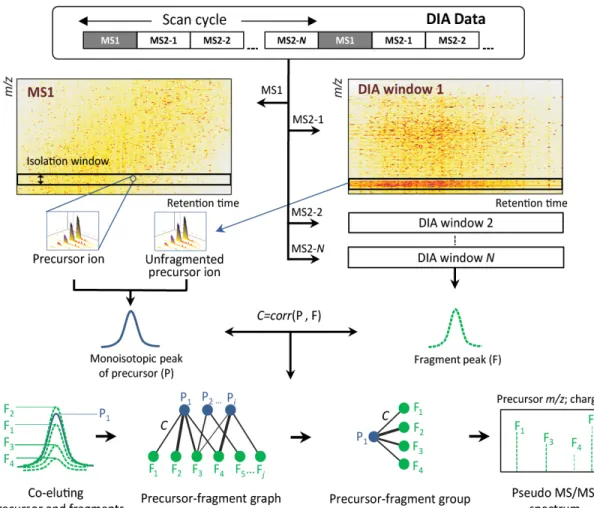
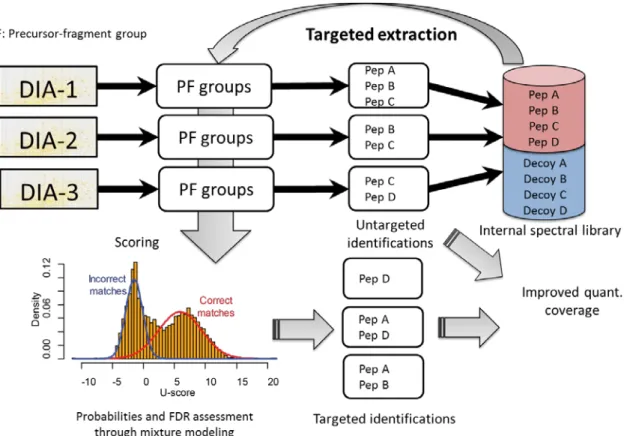
Figure 1-3 Untargeted and targeted data analysis strategies and DIA-Umpire hybrid framework
(a) Conventional analysis of DDA data is based on matching MS/MS spectra against a proteome-wide sequence database or a spectral library (spectrum-centric search). Peptides (and then proteins) are quantified using MS1 signal intensity or spectral counts (label-free quantification) (b) Current methods for DIA analysis are based on targeted data extraction, in which peptide ions from a spectral library are queried against experimental data (peptide-centric search) to find the best matching fragment ion signals and their intensities (MS2 based quantification). (c) DIA-Umpire hybrid workflow performs signal extraction from DIA MS1 and MS2 spectra to construct precursor–fragment groups. Each precursor– fragment group is then analyzed using spectrum-centric searching to identify the peptides,
12
as in (a). Peptide-centric matching is then performed to query unidentified precursor– fragment groups against a spectral library, as in (b). The spectral library can be built from the initial untargeted (spectrum-centric) results using the same DIA data, or can be combined (replaced) with an external spectral library built using DDA data. Quantification can be done from either MS1 precursor- or MS2 fragment-ion intensities.
13
Chapter 2
Untargeted proteomics identification
analysis for data independent acquisition data
The content of this chapter was previously published by the author as a research article in Nature Methods [41].
2.1
Background
DIA data presents a potential for more comprehensive proteomics analysis because its unbiased acquisition. However, as mentioned in Chapter 1, the common approach for DIA analysis is dependent on spectral libraries. The aim of the first study is to develop a computational method which can enable untargeted analysis (spectral library-free) for DIA proteomics data. We develop a pipeline called DIA-Umpire that includes a series of optimized signal processing algorithms for detection of signal features from DIA MS1 and MS2 spectra. The detected MS1 and MS2 features represent all observed peptide precursor and fragment ions, respectively. All the detected features are then assembled into precursor-fragment groups. This strategy allows untargeted analysis of DIA data by means of converting the detected precursor-fragment feature groups into “pseudo” MS/MS spectra. These pseudo MS/MS spectra are fully compatible with the conventional DDA database search engines and statistical analysis tools for estimating the false discovery rates (FDR). This untargeted analysis method was first evaluated using
14 four sets of samples of different complexity consisting of just the UPS (Universal Protein Standard) proteins, E. coli lysates, human cell lysates, and a public glycoproteomics dataset. We demonstrated that the algorithm can identify proteins in DIA data with similar numbers obtained from DDA data. We observed that, in our hands, DDA still outperforms DIA slightly for untargeted peptide and proteins identification in complex samples, especially in the low abundance range. We also performed a detailed comparison between the untargeted and targeted (exemplified by OpenSWATH [16]) analysis of DIA data using the complex E. coli and human cell lysate samples and the public glycoproteomics dataset.
2.2
Methods
2.2.1Sample preparation UPS2, E. coli, and human datasets
Proteomics Dynamic Range Standard (UPS2) sample was acquired from Sigma-Aldrich (St. Louis, MO), the MassPREP E. coli Digest Standard was acquired from Waters (Milford, MA) and the MS compatible human protein extract digest was from Promega (Madison, WI). The UPS2 samples were reduced with 5 mM TCEP (tris(2-carboxyethyl)phosphine), alkylated with 50 mM iodoacetamide, and digested overnight with 1 µg trypsin (Promega, Madison, WI) in 100 mM Tris pH 8 at 37°C. UPS2, E. coli, and human peptides were acidified with formic acid and loaded at various concentrations, alone or in combination, onto an in-house made 75 µm x 12 cm analytical column emitter packed with 3 µm ReproSil-Pur C18-AQ (Dr. Maisch HPLC GmbH, Germany). A NanoLC-Ultra 1D plus (Eksigent, Dublin CA) nano-pump was used to deliver a 90 minute gradient from 2% to 35% acetonitrile with 0.1%
15 formic acid, followed by a 30 minute wash with 80% acetonitrile prior to re-equilibration to 2% acetonitrile with 0.1% formic acid.
2.2.2 Mass spectrometric analysis
Each sample was analyzed in duplicates (1 ug E. coli lysate, 500 ng Human lysate) or in triplicates (UPS2, UPS2 plus E. coli; affinity purified samples previously reported [26]) on a TripleTOFTM 5600 instrument (AB SCIEX, Concord, Ontario,
Canada) once using DDA and once using DIA (SWATH) with an extended ion accumulation time of 250 ms for MS1 scans. UPS2 samples were also analyzed using SWATH with the previously-reported MS1 survey scan ion accumulation time of 50 ms [16, 26]. The DDA run consisted of one 250 ms MS1 TOF survey scan covering 400–1300 Da followed by ten data dependent 100 ms MS/MS scans (1 Da isolation window, scan range 100–2000 Da) with precursors excluded for 15 s after being selected for fragmentation once (dynamic exclusion option). The SWATH run consisted of one 250 ms or 50 ms MS1 TOF survey scan followed by 34 sequential MS2 windows of 25 Da covering a mass range of 400–1250 Da at 95 ms per each SWATH scan. The DIA run (Thermo Q Exactive Plus) consisted of one MS survey scan (17500 resolution, target 3e6, max fill time 50 ms) every 10 scans, and 24 sequential MS2 windows of 26 amu (17500 resolution, target 5e5, max fill time 80 ms) covering a mass range from 400–1000 Da. The DDA run (Thermo QE Plus) consisted of one MS survey scan (70000 resolution, target 1e6, max fill time 30 ms) followed by fifteen MS/MS scans (2 Da isolation, 17500 resolution, target 1e5, max
16 fill time 125 ms), with former precursors excluded for 20 seconds after being selected once.
2.2.3 Glycoproteomics SWATH dataset
The .wiff raw files of the public glycoproteomics SWATH and DDA datasets [35] were downloaded from ProteomeXchange Consortium using the dataset identifier PXD000704.
2.2.4 mzXML File conversion
All the .wiff raw files from AB SCIEX 5600 TripleTOF were first converted to mzML format with the AB MS Data Converter (AB SCIEX version 1.3 beta) using “centroid” option, and the resulting mzML files were further converted into mzXML format by msconvert.exe from the ProteoWizard package (version 3.0.4462) [42] using the default parameters.
2.2.5Precursor and fragment ion 2D peak detection in DIA-Umpire
A two-dimensional feature detection algorithm was developed to locate precursor and fragment ion signals in MS1 and MS2 data (Figure 2-1). Feature detection analysis starts with the LC elution profile (“peak curve”) detection step. A peak curve represents a mass trace continuous in time, and a peak must be present in at least three consecutive scans (for data presented in this study, >9 second on average). It is stored as three vectors of m/z values MZ = (m1, m2, …, mn), intensities INTraw = (i1, i2, … in), and retention timesRTraw = (t1, t2, … tn), where n is the number of consecutive scans and ti+1>ti. For detected features the algorithm reports m/z
17 value, retention time span (elution start and end times, t1 and tn) and extracted ion chromatograms (XICs).
Figure 2-1 DIA-Umpire signal extraction algorithms.
The feature detection algorithm is applied to DIA MS1 and MS2 spectra to detect all possible MS1 peptide precursor ions and MS2 fragment signals. Each detected precursor feature is grouped with corresponding co-eluting fragment ion features based on Pearson correlation of LC elution peaks and retention times of peak apexes to form precursor-fragments groups. These precursor–fragment groups are used to construct pseudo MS/MS spectra (separated into different quality tiers based on the quality of detected precursor ion signal) for untargeted spectrum-centric database search and identification.
The m/z value M of a peak curve is calculated as a weighted average (by intensity) of detected m/z values in the retention time span,
18 𝑀𝑀 =∑𝑛𝑛𝑗𝑗=1𝑖𝑖𝑗𝑗𝑚𝑚𝑗𝑗
∑𝑛𝑛𝑗𝑗=1𝑖𝑖𝑗𝑗 .
Each peak curve is then smoothed by B-spline interpolation (using the 2nd
degree basis function). XICs are represented as two vectors of interpolated retention times RT = (t1, t2, … tk) and intensities INT = (i1, i2 , … ik), where k is the total number of interpolated points per peak (we used 150 points per minute, making k = 150(tn
-t1)). As a peak curve might have multiple maxima, we apply a Continuous Wavelet
Transform (CWT)-based approach for splitting it into several separate peak curves using Mexican-hat wavelet (See Du et al [43] and Tautenhahn et al [44] for mathematical details of CWT) . For each unimodal peak curve, the apex intensity is determined as Imax = max(INT).
In MS1data generated using high-resolution instruments, several isotope peaks for each peptide precursor ion can usually be detected (referred to as precursor ion features) helping to distinguish true precursor signals from noise. Single peak curves detected in MS1 scans are grouped together to form isotopic clusters based on RT apex distance and m/z spacing, which should fit the spacing for a given charge state (in this study, +2, +3, and +4 only).
In complex samples, however, the presence of multiple co-eluting peptides having similar m/z values results in overlapping signals, leading to multiple alternative possibilities for isotope peak grouping (see Figure 2-2 for an illustration). In such cases, the algorithm intentionally over predicts the number of precursor ion features by first considering the m/z of each peak curve as a possible monoisotope,
19 and then attempting to find heavier isotope peaks for that presumed monoisotopic
m/z value. In doing so, the algorithm maximizes the sensitivity with respect to finding true precursor ion features at the cost of introducing some redundant features with incorrectly assigned monoisotopic m/z values.
20
(a) Two co-eluted peptide ions A and B with the monoisotopic peak A1 of peptide ion A overlapped with the third isotope peak B3 of peptide ion B. The peak detection algorithms have a difficulty with detecting B3 because it is completely buried by A1 signal. (b) Another, more complicated example where co-elution of multiple peptide ions presents an ambiguity with the interpretation of different isotope peak groups. To effectively detect as many true precursor ions as possible, the signal detection algorithm of DIA-Umpire considers each peak curve as a possible monoisotopic peak, and then attempts to find higher isotope peak curves for the assumed monoisotopic peak.
In general, the higher the number of isotope peaks detected for an MS1feature, the more likely it is to be a true precursor ion signal. Thus, the algorithm uses the number of isotope peaks as a measure of quality of precursor ion features. Features with three or more isotope peaks are labeled as Quality Tier 1 (QT = 1 or Q1) precursors, i.e. the precursors that are most likely to represent true precursor peptides with the correctly determined monoisotopic m/z values. MS1features with only two detected isotope peaks are labeled as Quality Tier 2 (QT = 2 or Q2). All single peaks observed in MS1scans (i.e. peaks with no isotopic envelope detected) are discarded.
In addition to detection of precursor ion features in MS1 scans, unfragmented precursor ions can sometimes be observed in DIA MS2 spectra. This is likely due to the collision energy not being universally suitable for complete fragmentation of all the precursor ions within a particular DIA isolation window. To take advantage of this, all peaks in MS2 spectra having m/z values within the corresponding DIA isolation window are considered as potential unfragmented precursors (seeFigure 2-1). Unfragmented precursor ion features are detected as described above for MS1 data, requiring at least two isotope peaks. These features are added to the precursor
21 list as Quality Tier 3 (QT = 3 or Q3). Note that some peptide precursor ions can be detected in both DIA MS1and MS2 spectra, and their corresponding features thus may be included in both Quality Tier 3 and Quality Tier 1 (or 2) sets.
Fragment ion peak detection in MS2 data is performed similarly, with one modification. It is generally more difficult to detect multiple isotope peaks for low intensity fragment ions. Relaxed stringency of feature detection for fragment ions (compared to MS1 precursor ions feature detection described above) resulted in improved sensitivity of peptide identification and reduced the computational time. Thus, isotope peak grouping and charge state determination for fragment ions is not performed at this stage. Instead, each possible fragment peak is treated independently, and isotope detection and charge state determination is performed at a later stage (after the precursor–fragment grouping step described below).
2.2.6 Precursor-fragment grouping
“Co-elution” is an important characteristic of the data that reveals relationships between a precursor ion and its fragments [17]. The algorithm takes advantage of this characteristic by calculating the Pearson correlation coefficient and the retention time difference of LC elution peak apexes between all detected precursors (P) and all possible fragment ions (F) (see Figure 2-1). This pairing is naturally restricted to fragment ions in the DIA isolation window corresponding to the m/z
value of the precursor. For a precursor Pq and a fragment Fr the Pearson correlation coefficient Cq,r = corr(Pq, Fr) is computed using the LC profiles (XICs) of monoisotopic precursor and fragment ion features. All precursor-fragment pairs are
22 represented as a bipartite graph (see Figure 2-1). In this representation, one fragment ion can have multiple precursors and several precursors can share the same fragment.
To better connect precursor ions to their most likely fragment ions, the following parameters are calculated based on the correlation scores for each possible Pq, Fr pair. First, given a fragment ion Fr, RP(Pq, Fr) score is calculated as the rank of the precursor ion Pq based on Pearson correlation Cq,r between that fragment and all candidate precursors. Second, given a precursor ion Pq, RF(Pq, Fr) score is calculated as the rank of the fragment Fr based on Pearson correlation between that precursor and all possible fragments. For a precursor ion with many co-eluting fragments, a higher-ranking fragment is more likely to be derived from it. Similarly, for a fragment ion, a higher-ranking precursor ion is more likely to be its true precursor. These two metrics, as well as the retention time difference of LC profile apexes,
ΔT(Pq, Fr), are used to assemble precursor-fragment groups (see Figure 2-1). 2.2.7Generation of pseudo MS/MS spectra
To generate a pseudo MS/MS spectrum for a precursor ion Pq, the algorithm first detects the charge state of each fragment peak (if only a single isotope peak is detected, charge state +1 is assumed). It then detects all likely complementary
y-and b-ions in the spectrum (detected as pairs of fragments summing up to the precursor peptide mass [45]). For non-complementary ion peaks, only those fragments Fr are kept that pass the following set of thresholds: RF(Pq, Fr) ≤ RFmax ,
23 implemented as user-specified options in the software, allowing re-evaluation and adjustment of the default thresholds (described below), if necessary.
Charge state and precursor m/z for each pseudo MS/MS spectrum are determined by precursor ion features. Fragment ion intensities are computed in three steps. For fragment Fr, the intensity is taken as LC apex intensity of the corresponding elution peak curve, Ir. Then for each complementary b-, y- fragment pair Fr1, Fr2, the intensity of the less intense fragment is boosted to match that of the
more intense one, Ir1 = Ir2 = max(Ir1, Ir2). At the last step, intensities are adjusted by
weighting according to the square of correlation with the precursor peak curve, Ir′ =
Ir×C2q,r. The presence of complementary ions is a positive sign of a connection between the precursor and fragment ions, and boosting the intensities of complementary ions has been shown to improve the sensitivity of peptide identification [46]. Note that this fragment intensity adjustment step can optionally be skipped for other applications, e.g. to use a spectral library search engine for searching pseudo MS/MS spectra or to build a spectral library from the pseudo MS/MS spectra. Also note that the adjusted (boosted) intensities are not used for quantitation, only for identification. An example of a pseudo MS/MS spectrum (before and after complementary ion boosting), the underlying precursor ion and fragment ion elution profiles in DIA MS1 and MS2 data, and the DDA MS/MS spectrum for the same peptide are shown in Figure 2-4.
The performance of the DIA-Umpire algorithm for different combinations of the threshold parameters described above was evaluated using a subset of the data. The
24 results are shown in 2.3 and Table 2-1. When the pseudo MS/MS spectra extracted under different settings were searched using X! Tandem, the following threshold values resulted in the highest number of identifications (at 1% FDR) and were selected as default values in the software: allow the top 25 ranked precursors for each fragment (RPmax= 25), the top 300 ranked fragments for each precursor
(RFmax = 300) and 0.6 minutes apex elution time difference (ΔTmax = 0.6). Note
that the best performance was achieved by allowing the possibility of an MS2 fragment to be included in multiple MS/MS spectra (RPmax= 25). Because the algorithm takes the square of a peak shape correlation coefficient between the precursor and fragment signals as the weighting factors for calculation of adjusted fragment intensities in pseudo MS/MS spectra, true high intensity fragments can still contribute to the identification of their corresponding peptide even if they have a relatively poor correlation with the precursor (e.g., due to ion suppression effects affecting either the precursor ion or the fragment ion elution peak shape). The overall robustness of the pseudo MS/MS spectrum generation process was also evident from similar numbers of peptide ion identifications obtained by searching the spectra with three different database search engines (X! Tandem, Comet, and MSGF+, detailed results are shown in Table 2-2.
These results indicate that inclusion of more fragment ions in a pseudo MS/MS spectrum does not hamper the identification rate. On the contrary, by doing so the algorithm increases the chance of true fragments to be included, thus improving the number of confident identifications. An additional analysis was also carried out for E. coli and human cell lysate datasets by removing fragments from pseudo MS/MS
25 spectra that were also matched in other pseudo MS/MS spectra identified with high confidence. Repeating X! Tandem search with those fragments removed did not change the number of identified peptide ions in either dataset.
2.2.8 Peptide and protein identification using pseudo MS/MS spectra
In this study, we used X! Tandem [47], Comet [48], and MSGF+ [49] as search engines to identify peptides from pseudo MS/MS spectra (however, any database search engine developed for searching DDA spectra can be used). Because of the similar characteristics of DDA and DIA pseudo MS/MS spectra, all downstream analysis of the database search results, including protein inference and estimation of posterior probabilities of correct identification and FDR, can also be performed using conventional strategies developed for DDA data. Database search output files were processed by PeptideProphet [50] via the Trans-Proteomic Pipeline (TPP) [51], followed by ProteinProphet [2] analysis to assemble peptides into proteins/protein groups and to determine protein probabilities. The final protein and peptide identification lists were filtered to achieve a desired FDR (here – 1%) estimated using the target-decoy approach [1]. The only modification was to compute posterior peptide probabilities by PeptideProphet separately for each of the three quality categories of MS/MS spectra (Quality Tiers QT= 1, 2 or 3) because of very different ratios of correct vs. incorrect identifications among them (see Figure 2-5).
Further analysis of the model parameters and the distributions of scores reported by PeptideProphet (see Figure 2-5) did not show any evidence indicating that pseudo MS/MS spectra extracted using DIA-Umpire behaved any different than
26 conventional DDA spectra with respect to the basic assumptions in PeptideProphet or the target-decoy FDR estimation strategy.
2.2.9 Peptide and protein identification parameters
For UPS2, E. coli, and human cell lysate datasets, DDA MS/MS spectra and the DIA pseudo MS/MS spectra were searched by X! Tandem, Comet, and MSGF+ using the following parameters: allow tryptic peptides only, up to one missed cleavage, oxidation of methionine and cysteine alkylation as variable modifications. The glycoproteomics SWATH dataset was searched by X! Tandem only, with cysteine alkylation specified as a fixed modification and with deamidation of asparagine as a variable modification. The instrument-specific parameters – the precursor ion mass tolerance and the fragment ion mass tolerance – were set to 30 ppm and 40 ppm for AB SCIEX 5600 TripleTOF, respectively. In X! Tandem, the analysis was limited to 140 most intense peaks which gave the best results based on the same subset of the data that was used to select the parameters for the DIA-Umpire pseudo MS/MS extraction algorithm (see above). However, the search results were not very sensitive to the choice of this parameter (which is also evident from the fact that similar results were obtained using Comet and MSGF+ search tools that do not provide an option to restrict the number of peaks in the spectra). The sequence database for the UPS2 experiment was compiled from the UPS sequences (total 50 sequences: 48 UPS1 proteins and 48 UPS2 proteins, www.sigmaaldrich.com). For the E. coli experiments, E. coli proteome sequences (4,431 proteins) were extracted from UniProtKB. The non-redundant human protein sequence FASTA file from the
27 UniProt/SwissProt database (release of 09-Jan-2013), appended with common contaminant proteins, was used for the human cell lysate experiment and the glycoproteomics datasets. For all sequence databases, reversed sequences were added as decoys for target-decoy analysis. The initial search results from the search engines were first converted into pepXML format, followed by analysis using PeptideProphet [50] via the Trans-Proteomic Pipeline (TPP) [51] (v4.7). For DIA derived pseudo MS/MS spectra, PeptideProphet was run separately for each of the three quality categories of MS/MS spectra (Quality Tiers QT = 1, 2 or 3). The iProphet [52] tool was used when merging the search results from all three search engines. Unless noted otherwise, peptide ion identification lists for each DDA or DIA run were filtered at 1% FDR, estimated by target-decoy approach based on PeptideProphet probability for each search engine (or iProphet peptide ion probability when using iProphet).
Protein inference for different analyses was performed as follows. To report the numbers of protein identifications for individual DIA/DDA runs (Table 2-2), PeptideProphet output files (individual search engine analysis) or iProphet output files (when combining the search results) were analyzed by ProteinProphet [2] for protein inference. For the comparison between DDA and DIA or between DIA-Umpire and OpenSWATH results at the protein level, PeptideProphet output files (based on X! Tandem results) for both DIA and DDA were processed together by ProteinProphet. The final protein lists for each ProteinProphet analysis were determined by a 1% FDR threshold, estimated by target–decoy approach.
28
2.2.10 Targeted extraction analysis using OpenSWATH
The E. coli and human cell lysate experiments from AB SCIEX 5600 TripleTOF were also processed with OpenSWATH to identify proteins and peptides using the fully targeted approach. The two DDA replicates acquired for each sample were used to build the spectral library using SpectraST [53] with the following options: best replicate; union; 0 minimum peaks for exclusion; 0 minimum amino acids for exclusion. Only the DDA non-decoy identification spectra that passed 1% FDR threshold were used for building the library. The probability thresholds were: 0.6979 for DDA E. coli replicate 1; 0.7877 for DDA E. coli replicate 2; 0.8075 for DDA human replicate 1; 0.8233 for DDA human replicate 2. This resulted in a total of 12,820 and 17,402 peptide ions including decoys represented in the “transition lists” used by OpenSWATH for E. coli and human, respectively. For OpenSWATH analysis using DIA-derived libraries, the libraries were built with SpectraST using the pseudo MS/MS spectra (without complementary b- and y-ion boosting) from peptide ions identified by the DIA-Umpire’s untargeted workflow and filtered at an 1% FDR threshold (8,757 peptide ions for human and 6,364 for E. coli samples).
29
Figure 2-3 Retention time differences for peptide ions commonly identified between DDA replicates.
30 OpenSWATH was run using the following parameters: extraction elution time window (seconds): 60; minimum transitions: 2; maximum transitions: 6; unique ion signature threshold: -1; retention time normalization factor (seconds): 7200 (i.e. the whole LC-MS run duration in our case). Our dataset did not contain iRT [54] peptides for retention time normalization because all the experiments were performed using the same instrumentation setup and the retention times were highly reproducible (within one minute) between the DDA/DIA runs (Figure 2-3). Peptide ion identification lists were filtered using mProphet [30] at 1% FDR. The number of candidate peptide ions used for scoring against the extracted peak groups in OpenSWATH analysis was estimated as the number of ions in the DDA-derived library falling within the corresponding 25 Da SWATH isolation window and within the specified retention time tolerance (1 minute).
2.2.11 DIA-Umpire analysis using reduced database
In order to demonstrate how search space affects peptide identifications, in addition to searching DIA pseudo MS/MS spectra against the proteome-wide sequence database (all E. coli or human proteome sequences plus decoys), we also used a smaller database of peptide sequences (5,997 and 8,784 sequences for E. coli
and human cell lysate experiments, respectively) identified from the corresponding DDA data. Reverse versions of these sequences were also appended to the database for target-decoy analysis. All other search parameters and settings were the same as described above.
31 Identification of N-linked glycopeptides relies on detection of asparagine deamidation due to PNGase F treatment which causes a small mass shift (0.984 Da). The mass shift is close to the mass difference between the isotope peaks which could lead to false identification of a peptide as deamidated if an “M+1” isotope peak is mis-recognized as a true monoisotopic peak. In another scenario, if there is a noise signal at “M-1” Da of a deamidated ion that is mis-recognized as the monoisotopic peak, the deamidated peptide would be mis-identified as an unmodified peptide ion. To remove these erroneous identifications, we applied a two-step filtering strategy. All confident identifications from DIA-Umpire were first grouped if their precursor features shared an isotope peak at same retention time (see Figure 2-2 for one such example). We then removed grouped precursor features if the observed MS1 isotope peak distribution did not fit the theoretical isotope pattern (chi-squared goodness of fit probability < 0.8). This first stage filtering was able to remove misidentifications in the second scenario. To remove the cases in the first scenario, the precursor masses of peptides identified in each group were compared, and only the identification with the smallest mass in the group was kept.
2.2.13 Code and data availability
The program was developed in the cross-platform Java programming language (v1.7) and the executable files along with source codes are publically available at
http://diaumpire.sourceforge.net/. All the spectrum files (Table A-1) along with DIA-Umpire results presented in this study have been deposited at the
32 ProteomeXchange Consortium [55] (http://proteomecentral.proteomexchange.org) via the PRIDE partner repository with the dataset identifier PXD001587.
2.3
Results
2.3.1 DIA-Umpire untargeted identification workflow
DIA-Umpire incorporates a number of computational algorithms for DIA analysis (see 2.2 for detail). It begins with a two dimensional (m/z - retention time) feature detection algorithm that discovers all possible precursor and fragment ion signals in DIA MS1 and MS2 data, respectively, and also possible unfragmented precursor ions in the MS2 data (Figure 2-1). Because DIA usually employs wider isolation m/z
range (e.g. 25 Da) than DDA, co-eluting peptides are more frequently co-fragmented, generating complex MS2 spectra. In order to measure the likelihood that a detected fragment signal is derived from a particular precursor peptide ion, the algorithm calculates the Pearson correlation coefficient of LC elution peaks and retention time differences of LC elution peak apexes between all detected precursor features and all co-eluting fragment ions. Reflecting the complex nature of precursor-fragment relationships, all precursor-fragment pairs are represented as a bipartite graph (Figure 2-1). After filtering by a combination of thresholds, sets of fragment peaks are grouped with precursor features and stored as precursor-fragment groups (Figure 2-1).
33
Figure 2-4 Example of precursor peptide ion and fragment ion LC elution signals and the corresponding pseudo MS/MS spectrum generated by DIA-Umpire. (a) Elution profiles for the first 3 isotope peaks of a doubly charged precursor peptide ion AMGIM[Oxy]NSFVNDIFER extracted from MS1 data from a DIA (SWATH) run on a AB SCIEX 5600 instrument. (b) Elution profiles for fragments of this precursor peptide detected in the DIA MS2 data. (c) DDA MS/MS spectrum (from a DDA run generated on the same instrument and using the same sample) from which the same peptide was identified, with matched b- and y- ions highlighted. (d) Pseudo MS/MS spectrum extracted by DIA-Umpire from the DIA data (before complementary ion boosting). (e) Same pseudo MS/MS spectrum after complementary ion boosting. Note a larger number of b- ions matched in (e) compared to (d). (a) and (b) images exported from Skyline. (c), (d), and (e) are exported from TPP spectrum browser.
For direct untargeted analysis, DIA-Umpire generates a pseudo MS/MS spectrum (Figure 2-4) for each precursor-fragment group. The pseudo MS/MS spectra can be
34 searched by any conventional DDA MS/MS database search engine. Here we used X! Tandem [47] Comet [48], and MSGF+ [49] followed by PeptideProphet [50] or iProphet [52] and ProteinProphet [2] analysis. The resulting peptide and protein identification lists were filtered using computed peptide and protein probabilities controlling the false discovery rate (FDR) via, e.g., the target-decoy approach [1].
2.3.2Analysis of experimental and computational parameters used in
DIA-Umpire
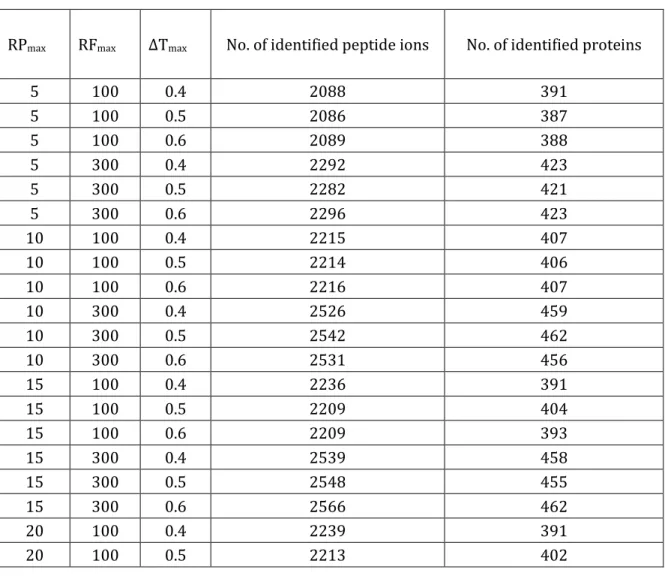
We first performed the analysis to understand how different parameters used in the precursor-fragment group step affects the results of untargeted peptide ion identifications. Number of identified peptide ions and proteins for a representative SWATH run (250 ms MS1 accumulation time, E. coli cell lysate mixed with UPS2 proteins sample) identified using different thresholds for precursor-fragment grouping. The search was done by X! Tandem search engine, and only DIA pseudo-MS/MS spectra from Q1 set were used. The numbers of peptide ions and protein identifications were filtered by an 1 % FDR threshold. The red-highlighted row is the parameter set chosen for this study. RPmax: maximum number of top precursors for a fragment ion considered for precursor-fragment grouping. Ranking is based on Pearson correlation between that fragment and all candidate precursors. RFmax: maximum number of fragments for a precursor feature considered for precursor-fragment grouping. ΔTmax: maximum retention time difference of LC
peak apexes for a fragment to be considered as a precursor's fragment in precursor-fragment grouping. The results are shown in Table 2-1. It was clear that the
35 parameters did not influence the numbers hugely, and generally including more fragments increased the number of identifications even many of low correlated fragments are noise peaks. The results indicated that the MS/MS database search engine is robust enough against the noise peaks. According to the results, we selected the following value as default setting in the software: allow the top 25 ranked precursors for each fragment (RPmax= 25), the top 300 ranked fragments for each precursor (RFmax = 300) and 0.6 minutes apex elution time difference
(ΔTmax = 0.6).
Table 2-1 Analysis of precursor-fragment grouping parameters
RPmax RFmax ΔTmax No. of identified peptide ions No. of identified proteins
5 100 0.4 2088 391 5 100 0.5 2086 387 5 100 0.6 2089 388 5 300 0.4 2292 423 5 300 0.5 2282 421 5 300 0.6 2296 423 10 100 0.4 2215 407 10 100 0.5 2214 406 10 100 0.6 2216 407 10 300 0.4 2526 459 10 300 0.5 2542 462 10 300 0.6 2531 456 15 100 0.4 2236 391 15 100 0.5 2209 404 15 100 0.6 2209 393 15 300 0.4 2539 458 15 300 0.5 2548 455 15 300 0.6 2566 462 20 100 0.4 2239 391 20 100 0.5 2213 402
36 20 100 0.6 2213 392 20 300 0.4 2562 464 20 300 0.5 2563 466 20 300 0.6 2559 464 25 100 0.4 2243 391 25 100 0.5 2214 404 25 100 0.6 2214 393 25 300 0.4 2570 469 25 300 0.5 2571 469 25 300 0.6 2573 470 30 100 0.4 2244 391 30 100 0.5 2214 404 30 100 0.6 2214 393 30 300 0.4 2557 467 30 300 0.5 2570 468 30 300 0.6 2566 465
We next analyzed whether the score results obtained between DDA and DIA are different. Figure 2-5shows the model distributions learned by PeptideProphet in the analysis of X! Tandem search results from identifications of doubly charged peptide ions for one replicate of the human cell lysate data. The learned distributions appear to be an accurate fit in both DIA and DDA data, demonstrating that the search results obtained using DIA pseudo MS/MS spectra can be satisfactory analyzed using PeptideProphet. The overall higher ratio of incorrect vs correct identification in the DIA QT=1 vs. DDA data (and similarly in DIA QT=2 vs. QT=1 data) simply reflects the higher number of pseudo MS/MS spectra extracted from the data compared to DDA data (and similarly, more noise in DIA QT=2 vs QT=1 data), which does not affect the accuracy of computed PeptideProphet probabilities or the subsequent FDR estimates for DIA data.
37
Figure 2-5 PeptideProphet analysis of X! Tandem search results using DDA and DIA pseudo MS/MS data
The figures shown here are model distributions learned by PeptideProphet in the analysis of X! Tandem search results (doubly charged peptide ions) for one replicate of the human cell lysate data. Left panels: mass accuracy distributions. Right panels: the distributions of the discriminant database search scores (computed from the X! Tandem Expect scores). Red and blue curves represent the models learned by PeptideProphet for correct and incorrect
38
identifications, respectively. Also shown are the distributions for the number of missed cleavages parameter (nmc) between correct and incorrect identifications. (a) DDA data; (b) DIA data, QT=1 pseudo MS/MS spectra; (c) DIA data, QT=2 spectra.
DIA-Umpire relies on precursor signal features to be detected to generate corresponding pseudo MS/MS spectra. Therefore it is important to understand how MS1 signal quality would affect the performance of DIA-Umpire’s untargeted identification. In addition to the standard MS1 accumulation time (50 ms) proposed by the original SWATH method [16], we also conducted experiment with 250 ms MS1 accumulation time to see if it improves DIA-Umpire’s performance. The results are shown in Figure 2-6. The numbers shown are non-redundant contributions to the total number of peptide ion identifications in each replicate / condition from pseudo MS/MS spectra from three different quality tiers: QT = 1 (white bar), 2 (grey), and 3 (dark grey). The QT = 1 category represents pseudo MS/MS spectra that are linked to high quality MS1 precursor features (3 or more detected isotope peaks), QT = 2 represent lower abundance precursors (2 detected isotope peaks only), and QT = 3 represents unfragmented precursors which were detected in DIA MS2 scans.
39
Figure 2-6 Effect of MS1 survey scan ion accumulation time on peptide identification using DIA-Umpire.
Experiments to assess the identification performance of DIA-Umpire on data generated using different MS1 ion accumulation times in DIA (SWATH) analysis using AB SCIEX 5600 instrument were carried out using two samples: UPS1 proteins, and UPS2 mixture spiked in with E. coli background. Two settings (50 ms and 250 ms MS1 ion accumulation times) were tested.
40 In a low complexity UPS1 sample, the dominant majority of peptide ions were identified from QT =1 spectra. Even with the using short MS1 accumulation time (50 ms), 92–93% of the peptides ions were identified from the QT = 1 spectral subset (this fraction increased slightly, to 94–96%, with the longer 250 ms accumulation time). Note that inclusion of unfragmented precursors detected in DIA MS2 data (QT = 3 subset) in the analysis contributed 4–6% of the total peptide ion identifications in UPS1 samples. In the more complex UPS2 plus E. coli samples, the effect of the accumulation time on the quality of MS1 signal was more pronounced. The longer DIA MS1 survey scan ion accumulation time resulted in more high quality (QT = 1) precursor peptide features detected, and thus more peptides identified from pseudo MS/MS spectra in the QT = 1 subset (81–85% for 250 ms vs. 59–64 % for 50 ms). Congruently, QT = 2 and QT = 3 spectral subsets contributed higher percentages to the total number of peptide ion identifications when using 50 ms accumulation time setting. The overall number of identifications (from all 3 QT sets) has improved with 250 ms vs. 50 ms acquisition time (~10%). Overall, this analysis indicates that longer MS1 accumulation time provides an advantage to DIA-Umpire algorithm with respect to the total number of identified peptide ions, especially peptide ions identified with a high quality MS1 precursor ion signals.
2.3.3Untargeted protein identification using DIA-Umpire
We first evaluated the performance of DIA-Umpire for untargeted protein identification using samples ranging from low complexity (48 Universal Protein Standard (UPS) proteins) to high complexity (E. coli and human cell lysates) by
41 performing parallel DDA and DIA runs in at least duplicates on an AB SCIEX TripleTOF 5600. Based on the results shown above, we acquired DIA data using 250 ms ion accumulation time for MS1 survey scans instead of the 50 ms SWATH setting used in earlier reports [16], which improved the MS1 signal quality and detectability of precursor ion signals in complex samples (See results in Figure 2-6). Three replicate runs were acquired for each sample / condition.
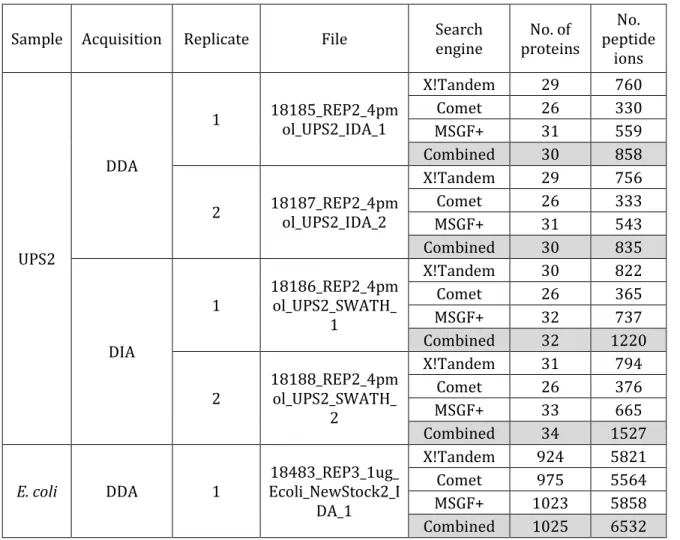
Table 2-2 Numbers of protein and peptide ion identifications from DDA MS/MS and DIA pseudo MS/MS spectra
The number of identifications obtained using three different search engines (X!Tandem, Comet, and MSGF+), as well as using all three search engines combined and analyzed by iProphet.
Sample Acquisition Replicate File Search engine proteins No. of peptide No. ions UPS2 DDA 1 18185_REP2_4pmol_UPS2_IDA_1 X!Tandem 29 760 Comet 26 330 MSGF+ 31 559 Combined 30 858 2 18187_REP2_4pmol_UPS2_IDA_2 X!Tandem 29 756 Comet 26 333 MSGF+ 31 543 Combined 30 835 DIA 1 18186_REP2_4pmol_UPS2_SWATH_ 1 X!Tandem 30 822 Comet 26 365 MSGF+