© 2017. Astha Ameta & Kalpana Jain. This is a research/review paper, distributed under the terms of the Creative Commons Attribution-Noncommercial 3.0 Unported License http://creativecommons.org/licenses/by-nc/3.0/), permitting all non-commercial use, distribution, and reproduction inany medium, provided the original work is properly cited.
Classification of HRS using SVM
By Astha Ameta & Kalpana Jain
Abstract-
The kidney diseases are one of the main causes of death around the world. Automatic
detection and classification of kidney related diseases are important for diagnosis of kidney
irregularities. Hepatorenal Syndrome (HRS) is a life-threatening medical condition when kidney fails
due to liver failure. The treatment to such cases is liver transplant, or dialysis for temporary basis. This
paper proposed to apply the Support Vector Machine (SVM) classification for diagnosis of HRS. The
results were evaluated using realistic data from hospitals. RBF kernel function is used along with
SVM. The results show a significant accuracy of 95%.
Keywords:
support vector machine, RBF kernel, cross validation, accuracy, ROC curve.
GJCST-C Classification:
H.5.5, D.2.5
ClassificationofHRSusingSVM
Strictly as per the compliance and regulations of:
Online ISSN: 0975-4172& Print ISSN: 0975-4350
Publisher: Global Journals Inc. (USA)
Type: Double Blind Peer Reviewed International Research Journal Volume 17 Issue 1 Version 1.0 Year 2017
Software & Data Engineering
Global Journal of Computer Science and Technology
: CClassification of HRS using SVM
Astha Ametaα & Kalpana Jainσ
Abstract-The kidney diseases are one of the main causes of
death around the world. Automatic detection and classification of kidney related diseases are important for diagnosis of kidney irregularities. Hepatorenal Syndrome (HRS) is a life-threatening medical condition when kidney fails due to liver failure. The treatment to such cases is liver transplant, or dialysis for temporary basis. This paper proposed to apply the Support Vector Machine (SVM) classification for diagnosis of HRS. The results were evaluated using realistic data from hospitals. RBF kernel function is used along with SVM. The results show a significant accuracy of 95%.
Keywords: support vector machine, RBF kernel, cross validation, accuracy, ROC curve.
I.
I
ntroductionepatorenal Syndrome (HRS) is a major complication of Cirrhosis, where approximately 8% patients with ascites are annually incident. HRS starts developing at the latest phase of disease. It is now medically proven that it is a very important determinant for showing survival rate. A majority of reviews on HRS reflect the problems in the investigation of this syndrome. On the contrary, HRS has no experimental model. Hence, many of its aspects are still poorly understood.
A high degree of predictive accuracy is needed in the healthcare sector. The predictive accuracy of any data mining/Machine learning technique is based on the data, its quantity and quality. Techniques such as classification, clustering, time series, temporal analysis, association and correlation analysis are various data mining techniques taken into consideration. Classification techniques are used to analyze data and predict labels that describe important properties of data. Many classification techniques have been developed such as Naïve Bayes, k-NN, SVM, Decision Tree induction, Back propagation, and more. Here, we propose SVM technique to be used for diagnosis of HRS.
II.
S
upportV
ectorM
achineSVM, abbreviated as Support Vector Machine, is a class of learning methods that can be used for the purpose of classification. Many classifiers have been proposed in the literature to study classification problems. In training SVMs, decision boundaries are
directly determined from training data thus maximizing its generalization ability. Hence, ability of SVM to generalize is somehow different than those of other classifiers, usually in the case of small number of training data. In its simplest or linear form, SVM is defined as a hyperplane which separates a set of negative examples from set of positive examples by using the concept of maximize the class margin. The form in which data points are provided is {(y1,x1),
(y2,x2),…,(yn,xn)}, where xi is a vector of n-dimensions
and yi can either be 1 or -1, which denotes the class to
which point xi belongs. For training SVM, set of xi are
pre-labeled with yi components which denotes the
correct classification which is required by SVM to search for a separating hyperplane.
For the case where data are linearly separable, two hyperplanes, w . x - b = -1 and w . x + b = 1 are generated which are parallel. Thus, no training sample lies in between and distance is maximized for the two planes. In the quadratic form, it can be formalized as: Min ½ ||w||2
Subject to yi(w . xi – b) ≥ 1, 1 ≤ i≤ l. This is a convex problem. Its dual form is: min ½ αTQα − eTα
subject to yTα = 0 and α ≥ 0,
where Q is an l x l matrix with Qij = yiyjxi . xj and e is the
vector of all ones. Let α be the solution to dual problem, then w =∑𝑙𝑙 yiαi𝑥𝑥𝑥𝑥
𝑥𝑥=1 is a solution to the primal problem. Vectors xi,which corresponds to αi>0, lie on the margin.
Such vectors are termed as support vectors (SV). Once the above equations are resolved, then new items can be classified with w .x where x is the new sample vector that is to be classified.
For the case of non-linear separable data, Cortes and Vapnik ([14]) proposed a modification to the QP formulation (namely soft margin) according to which, examples that fall on the wrong side of the decision boundary are allowed but with a penalty. Boser et al. ([15]) also proposed an extension to the non-linear classifiers. A generalized form of the QP problem having soft margin along with nonlinear classifier is shown below:
min ½ ||w||2 + CᶓT e,
subject to yi(w ・ᶲ(xi) − b) ≥ 1 −ᶓi
andᶓi≥ 0, 1 ≤ i≤ l,
whereᶓ shows the training error and the parameter C is
used to adjust the training error and the regularization term 1/2 ||w||2. The function ᶲ maps ℜn to a higher
H
Authorα:Department of Computer Science and Engineering, College of Technology and Engineering, Udaipur.
e-mail: [email protected]
Authorσ:Assistant Professor, Department of Computer Science and Engineering, College of Technology and Engineering, Udaipur. e-mail: [email protected]
Global Journal of Computer Science and Technology Volume XVII Issue I Version I
25 Year 2017 ( ) C
dimensional space. In practice, kernel functions are used to perform the process of mapping. The kernel functions are represented in the form of dot product as below:
K(xi, xj) = ᶲ(xi) ・ᶲ(xj). Some commonly used kernel functions include Linear:
k(xi, xj) = xi ・xj Polynomial:
k(xi, xj) = (xi・xj)d
Radial Basis Function (RBF):
k(xi, xj) = exp(−ϒ||xi–xj||2),ϒ> 0
III.
P
roposedM
ethodology forC
lassification of HRS using SVMIn this paper, we propose to use Support Vector Machines (SVMs) for the diagnosis of Hepatorenal
Syndrome (HRS) based on clinical data. We have collected data for 100 patients from few hospitals. For each patient data, there are 14 features, including serum albumin, billirubine, creatinine, serum sodium, serum urea, urine output, urine microscopy, USG, ascites, cirrhosis, BP-systolic, diastolic, hemoglobin, urine protein. The data collected in medicine is generally collected because of patient care activity so as to benefit patients; hence data contained in medical databases is redundant, irrelevant, and inconsistent which can affect the results produced with the use of data mining techniques. Thus, data preprocessing and scaling are required so as to removeredundant as well as noisy data and to use normal forms of data. All of the data were transformed to real values with proper definition. For example, “Normal” converted to 1 and “Abnormal” to 0.
Figure 1:Architecture
Final Classification Model Data preprocessing
Training Dataset Test Dataset
k-fold Cross Validation Learning Algorithm Training Hyper Parameter Optimization Results Final Model Evaluati on HRS raw data
Scaling and conversion Feature Classifier Support Vector Machine (SVM)
Phase I
Phase II Phase
III
Global Journal of Computer Science and Technology Volume XVII Issue I Version I
26 Year 2017 ( ) C
The results obtained provide good classification accuracy. Figure 1shows the architecture of our proposed work. Flowchart for proposed methodology can be described as the following phases:
Phase I:
a) HRS clinical data is collected and preprocessed. Preprocessing of proposed work includes:
• Conversion of string data to numeric form:
1. Data value “Normal” is converted to 1 and “Abnormal” to 0.
2. Data value “Yes” is converted to 1 and “No” to 0. • Scaling: Conversion of urine output in milliliter to
liter.
Phase II: SVM is used as the classification technique.
a) The preprocessed dataset is divided into training set(contains 80% of data) and testing set(contains 20% of data).
b) Cross-Validation or CV is applied on training dataset. In the proposed work, k-fold cross validation is used where k=5, hence it is known as five-fold cross validation.
c) In the proposed work, grid search method is employed to find the best parameters. Mesh grid is used to employ grid search.
d) A final model is obtained which is ready to test for new or unseen data.
Phase III.
The final model obtained is tested on new or unseen data. This is known as final model evaluation. The accuracy hence obtained is considered as the accuracy of the model generated and it shows how much accurate and efficient model has been generated.
IV.
E
xperimentalR
esults andP
erformanceA
nalysisWe used Support Vector Machine as the classification technique using LIBSVM –Matlabinterface for our experiment. LIBSVM is an SVM package provided by Matlab. The computations involved were
implemented on intel core i5 processor. The kernel function used here is Radial Basis Function (RBF) kernel, also known as sigmoid kernel.
Accuracy is evaluated using k-fold cross validation test. K-fold Cross-validation process includes dividing a dataset into k pieces, and on each piece, testing the performance of a predictor build from the
remaining 90% of the data. In our work, k=5. The performance of the classification is evaluated for six parameters, namely, accuracy, sensitivity, specificity, precision, recall, f-measure. The definitions are as follows: 𝐴𝐴𝐴𝐴𝐴𝐴𝐴𝐴𝐴𝐴𝐴𝐴𝐴𝐴𝐴𝐴=𝑇𝑇𝑇𝑇+𝑇𝑇𝑇𝑇𝑇𝑇𝑇𝑇++𝑇𝑇𝑇𝑇𝐹𝐹𝑇𝑇+𝐹𝐹𝑇𝑇 (1) 𝑆𝑆𝑆𝑆𝑆𝑆𝑆𝑆𝑥𝑥𝑆𝑆𝑥𝑥𝑆𝑆𝑥𝑥𝑆𝑆𝐴𝐴=TP+FNTP (2) 𝑆𝑆𝑆𝑆𝑆𝑆𝐴𝐴𝑥𝑥𝑆𝑆𝑥𝑥𝐴𝐴𝑥𝑥𝑆𝑆𝐴𝐴=TN+FPTN (3) 𝑇𝑇𝐴𝐴𝑆𝑆𝐴𝐴𝑥𝑥𝑆𝑆𝑥𝑥𝑃𝑃𝑆𝑆=TP+FPTP (4) 𝑅𝑅𝑆𝑆𝐴𝐴𝐴𝐴𝑙𝑙𝑙𝑙=TP+FNTP (5) 𝐹𝐹 − 𝑀𝑀𝑆𝑆𝐴𝐴𝑆𝑆𝐴𝐴𝐴𝐴𝑆𝑆=2TP+FP+FN2TP (6) where TP represents number of true positives (If the instance is positive and it is classified as positive), TN represents number of True negatives (If the instance is negative and it is classified as negative), FP represents number ofFalse positives (If the instance is negative but it is classified as positive) and FN represents number of False negatives (If the instance is positive but it is classified as negative).
Figure 2 shows cross-validation accuracy of 95%.This is a curve between logarithm of two important parameters, cost function C and rbf sigma, also known as gamma, represented by ϒ. The best value of both these factors gives the best cross validation accuracy of 95%.
Global Journal of Computer Science and Technology Volume XVII Issue I Version I
27 Year 2017 ( ) C
Figure 2:Accuracy Curve The performance of the classifier can be
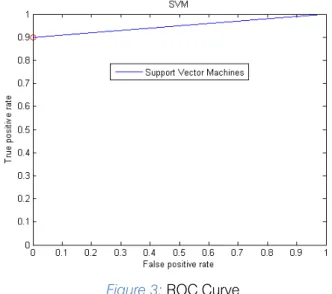
visualized using Receiver Operating Characteristic (ROC) curve. The 2-D ROC curve is defined by the false
positive rate (FPR) on x-axis and true positive rate (TPR) on y-axis, where TPR determines a classifier performance on classifying positive instances correctly
among all positivesamples and FPR, on the other hand, defines how many incorrect positive results occur amongall negative samples. It is also known as graph between sensitivity and 1-specificity. Figure 3 shows
ROC curve obtained for proposed work. The area under the ROC curve (AUC) obtained is 0.95. This value of AUC proves that the performance of classifier is good.
Figure 3:ROC Curve
Global Journal of Computer Science and Technology Volume XVII Issue I Version I
28 Year 2017 ( ) C
Figure 4:Performance parameters 84% 86% 88% 90% 92% 94% 96% 98% 100% 95% 90% 100% 90% 100% 94.7% V.
C
onclusionIn this research work, we propose to use SVM as the classification technique to diagnose HRS in patients of Cirrhosis. The performance is analyzed by comparing the predicted results with the manual results received along with data sets from hospitals. Our approach provides 95% classification accuracy and precision is recorded as 100%. It helps physician to diagnose the disease with more precision and accuracy. Sensitivity and Specificity are computed as 90% and 100% respectively. Recall and F-Measure are measured
as 90% and 94.74% respectively. Thus, SVM is proven as a good classifier for the prediction of HRS.
The proposed work can be further extended using feature selection or optimization techniques. Another extension can be application of SVM for diagnosis of similar diseases.
R
eferencesR
éférencesR
eferencias1. Chen, X., Ching, W. K., Aoki-Kinoshita, K. F., & Furuta, K. (2010, May). Support Vector Machine Methods for the Prediction of Cancer Growth. In
Classification of HRS using SVM
Figure 4 shows various performance parameters in the form of a bar chart with their experimental values.
2010 Third International Joint Conference on(Vol. 1, pp. 229-232).IEEE.
Computational Science and Optimization (CSO),
2. Balakrishnan, S., Narayanaswamy, R., Savarimuthu, N., & Samikannu, R. (2008, October). SVM ranking
with backward search for feature selection in type II diabetes databases. In Systems, Man and Cybernetics, 2008.SMC 2008. IEEE International Conference on(pp. 2628-2633). IEEE.
3. Liu, J., Yuan, X., & Buckles, B. P. (2008, August). Breast cancer diagnosis using level-set statistics and support vector machines. In Engineering in Medicine and Biology Society, 2008.EMBS 2008. 30th Annual International Conference of the IEEE
(pp. 3044-3047). IEEE.
4. Ghumbre, S., Patil, C., & Ghatol, A. (2011, December). Heart disease diagnosis using support vector machine. In International conference on computer science and information technology (ICCSIT’) Pattaya.
5. Kousarrizi, M. N., Seiti, F., & Teshnehlab M., 2012. An experimental comparative study on thyroid disease diagnosis based on feature subset selection and classification, International Journal of Electrical & Computer Sciences IJECS- IJENS, 12: 01.
6. Hiesh, M. H., Andy, Y. Y. L., Shen, C. P., Chen, W., Lin, F. S., Sung, H. Y., Lin J.W., Chiu M.J.and Lai, F. (2013, July). Classification of schizophrenia using genetic algorithm - support vector machine (ga-svm).In 2013 35th Annual International Conference of the IEEE Engineering in Medicine and Biology Society EMBC pp. 6047-6050.IJENS, 12: 01.
7. Jiang H., Tang F., Zhang X., 2010. Liver cancer Identification based on PSO-SVM Model. 11th Int. Conf. Control, Automation, Robotics and Vision Singapore.
8. Harb H.M., Desuky A.S., 2014, Feature Selection on Classification of Medical Datasets based on Particle Swarm Optimization, International Journal of Computer Applications (0975-8887),104.
9. Tomar D. and Agarwal S., 2013.A survey on Data Mining approaches for Healthcare. International Journal of Bio-Science and Bio-Technology, 5, 241-266.
10. Kohli N., &Verma N.K., 2011.Arrhythmia classifyca-tion using SVM with selected features, International Journal of Engineering, Science and Technology, 3: 122-131.
Global Journal of Computer Science and Technology Volume XVII Issue I Version I
29 Year 2017 ( ) C
11. Han J. And Kamber M.,2000. data mining Concepts and Techniques, Morgan Kaufmann Publishers, pp. 337-342.
12. D. Delen, G. Walker, A. Kadam, “Predicting breast cancer survivability: A comparison of three data mining methods,” Artificial Intelligence in Medicine,
vol. 34, 2005, pp. 113-127.
13. C. Cortes and V. Vapnik, “Support Vector Networks,” Machine Learning, 20, pp. 273-297, 1995.
14. B. E. Boser, I.M. Guyon, and V. Vapnik, “A Training Algorithm for Optimal Margin Classifiers,” Fifth Annual Workshop on Computational Learning Theory, ACM, 1992.
Global Journal of Computer Science and Technology Volume XVII Issue I Version I 30 Year 2017 ( )
© 2017 Global Journals Inc. (US)1
C
Classification of HRS using SVM