ORIGINAL ARTICLE
Multi-parametric MRI and PI-RADS (V1) scoring
system: New inception in cancer prostate diagnosis
to evaluate diagnostic performance of different
score combinations
Ahmad Hafez Afifi
a,*, Adel Ali Ramadan
a, Ahmad Alabbady
b,
Mohamad Hossam Aldin Khalifa
aa
Radiology Department, Alexandria University, Egypt
b
Urology Department, Alexandria University, Egypt
Received 24 January 2016; accepted 16 April 2016 Available online 17 May 2016
KEYWORDS
Multi-parametric MRI; Prostate cancer; PI-RADS;
Diffusion weighted imaging; Dynamic contrast MR
Abstract Objectives: Evaluating ESUR-proposed PI-RADS scoring system for prostate cancer detection using multi-parametric MRI and comparing diagnostic performances of single and com-bined scores.
Methods: 76 prostatic lesions in 54 patients prospectively assessed using mpMRI. T2, DWI, DCE, MRS single, combined PI-RADS scores as well as PIRADS summed score for all four sequences were recorded and histopathologically correlated.
Results: 61 out of 76 lesions were positive for cancer prostate. Peripheral zone lesions showed PI-RADS sum score was highest AUC for Pca detection (Az= 0.923) while highest AUC for single
score was for DCE score (0.921). Best combined score was for T2 + DCE scores. Central gland lesions showed highest AUC of 0.953 for PI-RADS sum score, and combined T2 + DWI score showed highest AUC of 0.969. Single score with statistically significant AUC was T2 score (Az= 0.875). Sum score in both PZ lesions and CG lesions showed no false positive results with
100% specificity for scores above 12.
Conclusions: PI-RADS scoring system and mpMRI have a promising role in Pca detection still using single score resulted in lower diagnostic accuracy which improved for combined scores. mpMRI results in CG showed controversies and need more evaluation in the future.
Ó2016 The Egyptian Society of Radiology and Nuclear Medicine. Production and hosting by Elsevier. This is an open access article under the CC BY-NC-ND license ( http://creativecommons.org/licenses/by-nc-nd/4.0/).
* Corresponding author. Tel.: +20 1227309545, +20 35449009.
E-mail addresses: [email protected] (A.H. Afifi), [email protected] (A.A. Ramadan), [email protected] (A. Alabbady),
[email protected](M.H.A. Khalifa).
Peer review under responsibility of The Egyptian Society of Radiology and Nuclear Medicine.
Egyptian Society of Radiology and Nuclear Medicine
The Egyptian Journal of Radiology and Nuclear Medicine
www.elsevier.com/locate/ejrnm
www.sciencedirect.com
http://dx.doi.org/10.1016/j.ejrnm.2016.04.015
0378-603XÓ2016 The Egyptian Society of Radiology and Nuclear Medicine. Production and hosting by Elsevier. This is an open access article under the CC BY-NC-ND license (http://creativecommons.org/licenses/by-nc-nd/4.0/).
1. Introduction
In the last decade, there has been a shift of interest in the use of MRI from local staging to the detection and charac-terization of primary foci of prostatic cancer (Pca) and with more advances in the technology of MR imaging it becomes able to provide functional tissue information combined with anatomic information. To increase the accuracy, conven-tional anatomic T2-weighted MR imaging was combined with functional MR imaging techniques such as dynamic contrast agent-enhanced MR imaging (DCE), diffusion-weighted imaging (DWI), and MR spectroscopic imaging (MRS) in an integrated multi-parametric MR imaging (mpMRI) (1).
Each of which provides unique information on tissue characteristics as DCE provides data on tissue perfusion characteristics as well as tumor wash-in and wash-out con-trast dynamics as tumors display increased angiogenesis resulting in early and increased enhancement and rapid washout (2). DWI records the Brownian motion of water molecules within the tissue, based on the theory that neo-plastic tissues show high cellular density and decreased water movement (3,4). MR Spectroscopy examines cellular metabolism, using measuring levels of choline and citrate (5,6).
The rationale for the use of a multi-parametric approach considered that any single sequence by itself has considerable overlap between benign and malignant tissues; however, the combination of sequences proved to have more predictive power for cancer detection(7).
Many studies have evaluated the value of using various functional prostatic MR imaging rather than just using the conventional anatomical MR imaging alone. Several studies had compared T2WI, DWI, DCE and MRS and demonstrated that a combination of these methods can yield better diagnos-tic accuracy for detecting Pca than any one modality alone (3,8–10).
The great variations of the diagnostic role of multi-parametric MRI in cancer prostate could be explained by the complexity and contradictory findings of the different single modalities which may result in a wide scope of possible inter-pretations of findings leading to heterogeneous results. To overcome these problems, the European Society of Urogenital Radiology (ESUR) recently had called a panel of experts and published a guideline providing recommendations for the per-formance of mpMRI investigations and a structured reporting scheme named Prostate Imaging Reporting and Data System (PI-RADS)(13), inspired by the BI-RADS system for breast cancer detection(11–14).
However, there is still debate regarding which functional MR sequence has more diagnostic accuracy for prostate detection after the implementation of the PIRADS scoring system. So our purpose of this study was to evaluate the use of the ESUR-proposed PI-RADS scoring system for prostate cancer (Pca) detection using multi-parametric MRI (mpMRI) in our clinical practice and to compare the diagnostic performances of the single and combined PI-RADS scores, and furthermore, to highlight the differences of the diagnostic accuracy of each sequence in relation to peripheral and transitional zones prostatic cancer.
2. Methods
2.1. Patients
Seventy-six prostatic lesions in 54 consecutive patients who had clinical suspicion of cancer prostate (based on high PSA level or suspicious digital rectal examination) were prospec-tively assessed using 1.5T mpMRI including T2, DWI, DCE, MRS sequences from time interval between 3-2013 and 9-2015. Confirmation of findings by laboratory and histopathological data was obtained from either TRUS biopsy or radical prostatectomy.
2.2. MR image acquisition protocol
The MR images were obtained with a 1.5-T closed magnet sys-tem (Avanto; Siemens Medical Syssys-tems, Erlangen, Germany) using phased array surface body coil (TORSO)-16 channels. The imaging protocol was as follows:
1. T2-WI (SE images in-plane spatial resolution of 0.550.55 mm, 3500–4400/132 [repetition time msec/echo time msec], 180° flip angle, 11–15 sections, 4-mm section thickness, echo train length of 15, 220 field of view, 240512 matrix) in three orthogonal planes covering the prostate and the seminal vesicles.
2. DWI: (echo planar sequence) TR 2100/TE 80, Matrix 128128, field of view 220 (±20), slice thickness 3 mm without gap in between and 3 differentb values (0, 800, 1000) . ADC maps were reconstructed on workstation for qualitative and quantitative assessment.
3. 3D MR spectroscopy of entire prostate using a section-selected box drawn all around the prostate. The matrix size was 666 mm, the repetition time was 650 ms, and the echo time was 120 ms. volume of interest (VOI) aligned to axial T2WI; coverage of the whole prostate in the VOI; field of view at least 1.5 voxels larger than VOI in all directions to avoid wrap-around or back folding; spectral selective suppression of water and lipid signals; positioning of at least six fat saturation bands close to prostatic margin. 4.DCE MRI were obtained using fast 3D T1-weighted
gradient-echo images (T1-VIBE) (34/1.6, 14°flip angle, 10 transverse partitions on a 3D slab, 4-mm section thickness, 280-mm field of view, 77256 matrix) acquired during an intravenous bolus injection of a paramagnetic gadolinium chelate – 0.1 mmol of gadopentetate dimeglumine (Mag-nevist; Schering, Berlin, Germany) per kilogram of body weight, that was administered using power injector at 2.5 mL/s, followed by a 20-mL saline flush. 3D volume was acquired every 15 s for 10 min. Post processing includes regions of interest (ROI), placement upon the suspected lesions as well as the normal gland.
2.3. Image analysis
For reporting and localization of findings, the prostate was divided into the apex, middle, and base of the gland compris-ing 27 ROIs as recommended by the ESUR guidelines accord-ing to a scheme presented by Roethke et al.(15)
All T2-WI, DWI, MRS and DCE MR data sets were prospectively evaluated and scored. In a first step single-scores from (1–5) for T2, DWI, DCE and MRS for each lesion were defined according to the ESUR guidelines(13). Since the diagnostic significance of the T2 sequences differs for the peripheral and central glandular zone, 2 separate schemes were recommended for each region that were used at current study. For MRS the consensus described two methods a qualita-tive (that was employed at the current study) and a quantita-tive one. For DCE a qualitaquantita-tive method was used for analysis depending on the shape of the signal intensity–time curve (SI–t curve); In a type I curve, the SI gradually continues to increase. Type II curves are characterized by SI stabilization with a slight and late decrease. Type III curves show immedi-ate washout after reaching peak enhancement. Then a PI-RADS sum (PSsum) score (scale from 4 to 20) was calculated
by summation of the four previous single-scores.
2.4. Statistical analysis
Data were fed to the computer and analyzed using IBM SPSS software package version 20.0. Agreement of the different pre-dictives with the outcome was used and was expressed in sen-sitivity, specificity, positive predictive value, negative predictive value and accuracy. Receiver operating characteris-tic (ROC) curve was plotted to analyze a recommended cutoff based on Youden selected thresholds, and the area under the ROC curve denotes the diagnostic performance of the test. A
pvalue ofp< 0.05 was considered as statistically significant.
3. Results
In the current study 76 lesions were identified, 15 lesions were confirmed to be non cancerous and 61 lesions were confirmed to be foci of prostate cancer. Gleason score was histopatholog-ically assigned for each malignant focus after either TRUS biopsy (for 49 lesions) or radical prostatectomy (for 12 lesions
in 7 patients). Twenty lesions showed Gleason score of <7 while 41 lesions showed Gleason P7. A whole amount of pathology reports were obtained for the seven patients who underwent robotic radical prostatectomy at Hospital Henri Mondor in France.
3.1. Diagnostic performance of multiparametric-MRI for prostate cancer detection in peripheral zone lesions and central gland lesions
Peripheral zone lesions (n= 54) as well as central gland lesions (n= 12) were assessed separately on T2, DWI, DCE and MRS with excluding lesions involving both zones.
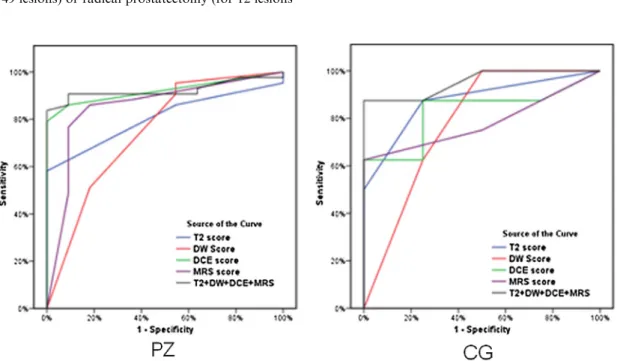
Analysis of receiver operator curve for the single PI-RADS score of each sequence as well as the summed PI-RADS score (PSsum) for detection of prostate cancer in peripheral zone lesions (Fig. 1andTable 1) showed the following:
Summed PIRADS score of all the four sequences showed the highest AUC for cancer detection (Az= 0.923). And
on using recommended Youden threshold of >12 for the summed score, it showed the highest sensitivity of 83.72% and highest specificity of 100%.
Fig. 1 ROC curve of single PI-RADS scores for T2, DW, DCE, MRS and for summed PIRADS score for cancer detection in peripheral zone (on left) and in central gland (on right).
Table 1 ROC curve of single PI-RADS scores for T2, DW, DCE, MRS and for summed PIRADS score for cancer detection in peripheral zone (on left) and in central gland (on right). PZ CG AUC p AUC P T2 score 0.805 0.002 0.875 0.042 DW score 0.748 0.012 0.781 0.126 DCE score 0.921 <0.001 0.828 0.075 MRS score 0.854 <0.001 0.781 0.126 T2 + DW + DCE + MRS 0.923 <0.001 0.953 0.014
The use of single MR sequences in detection of cancer in the peripheral zone also led to lower AUC for prostate cancer detection.
Regarding single PI-RADS scores the AUC was also high-est for DCE (0.921) followed by MRS, T2 and then DWI. On using a selected threshold of >3 for each of the single scores, the DWI showed highest sensitivity of 90.70% and lowest specificity of 45.45%, while each of T2, DCE, MRS showed lower sensitivity with significant higher speci-ficity than DWI.
Detailed ROC evaluations of each score for all lesions are shown inFig. 1andTables 1 and 2.
Analysis of receiver operator curve for the single PI-RADS score of each sequence as well as the summed PI-RADS score (PSsum) for detection of prostate cancer in central gland lesions (Fig. 1andTable 1) showed the following:
The only single PIRADS score that showed statistically sig-nificant AUC value was for the T2 score withAz= 0.875 so
it was performed as the best single score in the central gland lesions.
However the summed PIRADS (PSsum) score of all the four sequences combined still showed the highest AUC for can-cer detection (Az= 0.923) compared to the T2 score.
While Single PIRADS scores for DW, DCE and MRS each alone was statistically insignificant in detection of central gland lesions.
Sensitivity and specificity were detected according to selected thresholds and are shown inTable 3.
Analysis of receiver operator curve for T2 score with com-binations of single RADS scores as well as the summed PI-RADS score (PSsum) for detection of prostate cancer in periph-eral zone lesions (Fig. 2andTable 4) showed the following:
AUC for peripheral zone lesions only showed higher values for combined T2 + DWI scores (Az= 0.855) when
com-pared to single T2 score (Az= 0.805).
Also on adding DCE score, the combined score for T2 + DWI + DCE showed higher AUC values (Az= 0.918)
than of the T2 + DWI scores only (Az= 0.923) denoting
better diagnostic accuracy.
Still the summed PI-RADS score (PSsum) of all (T2
+ DWI + DCE + MRS) sequences showed the highest AUC (Az= 0.923) for detection of prostate cancer in
peripheral zone lesions.
When using the recommended Youden threshold of >3, >7, >10 as well as >12 for the single T2 score, combined T2 + DWI, combined T2 + DWI + DCE and for the
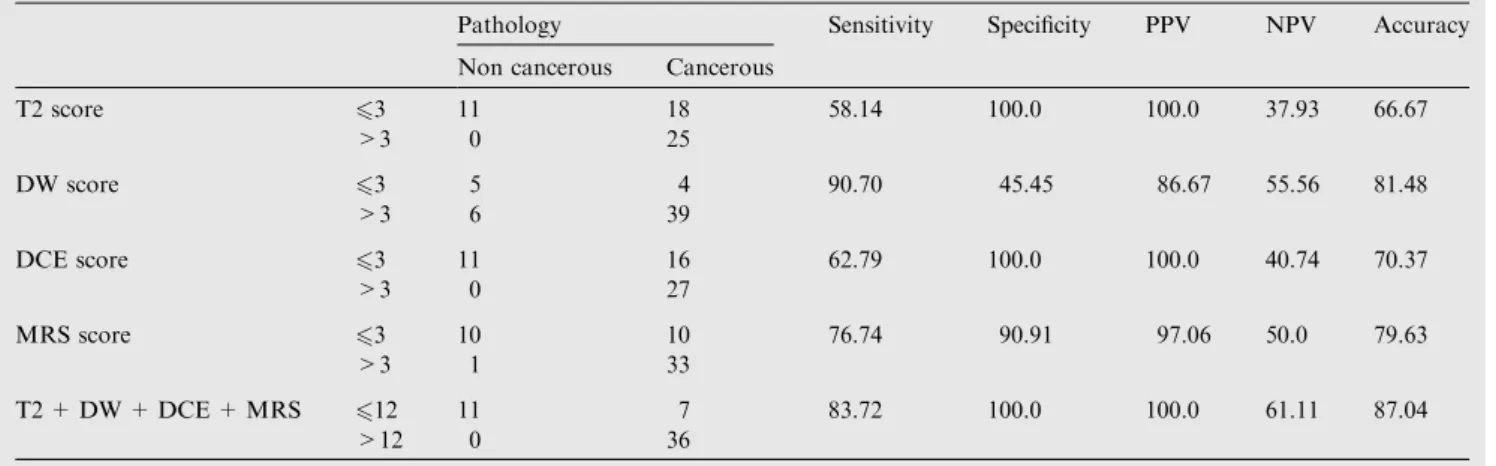
Table 2 Agreement (sensitivity, specificity and accuracy) in peripheral zone.
Pathology Sensitivity Specificity PPV NPV Accuracy
Non cancerous Cancerous
T2 score 63 11 18 58.14 100.0 100.0 37.93 66.67 >3 0 25 DW score 63 5 4 90.70 45.45 86.67 55.56 81.48 >3 6 39 DCE score 63 11 16 62.79 100.0 100.0 40.74 70.37 >3 0 27 MRS score 63 10 10 76.74 90.91 97.06 50.0 79.63 >3 1 33 T2 + DW + DCE + MRS 612 11 7 83.72 100.0 100.0 61.11 87.04 >12 0 36
Table 3 Agreement (sensitivity, specificity and accuracy) in transitional zone.
Pathology Sensitivity Specificity PPV NPV Accuracy
Non cancerous Cancerous
T2 score 62 4 4 87.5 75.0 87.5 75.0 66.67 >2 0 4 DW score 63 2 0 100.0 50.0 80.0 100.0 83.33 >3 2 8 DCE score 63 3 3 62.50 75.0 83.33 50.0 66.67 >3 1 5 MRS score 63 4 3 62.50 100.0 100.0 57.14 75.0 >3 0 5 T2 + DW + DCE + MRS 612 4 1 87.50 100.0 100.0 80.0 91.67 >12 0 7
PSsum respectively, it showed increased sensitivity and ascending trend toward better diagnostic performance on increasing combinations between scores, where sensitivity was 58% for T2 score, 65% for combined T2 + DWI score, 76% for combined T2 + DWI + DCE score, 83% for PSsum(T2 + DWI + DCE + MRS) and showed a speci-ficity of 100% for all. This indicates increased diagnostic performance and accuracy on using more score combina-tions reaching the highest when using the summed
PI-RADS score for all the sequences together. Detailed ROC evaluations of each score for detection of peripheral zone lesions are shown inFig. 2andTables 4 and 5. Analysis of receiver operator curve for T2 score with com-binations of single RADS scores as well as the summed PI-RADS score (PSsum) for detection of prostate cancer in central gland lesions (Fig. 2andTable 4) showed the following:
Adding DW score to T2 score had improved diagnostic accuracy and performed as the best combination score in detection of central gland lesions where it showed the high-est AUC (Az= 0.969) which is significantly higher than
that of T2 score alone (Az= 0.875) which was performed
as the best single score.
On adding DCE score to T2 + DW, it showed decrease in the AUC to (Az= 0.938).
On calculating the summed PIRADS (PSsum) score of the four sequences combined the AUC (Az= 0.953) was also
less than that of T2 + DW scores but higher than T2 + DW + DCE scores.
Fig. 2 ROC curves for T2, T2 + DW, T2 + DW + DCE and PSsumscores in cancer detection in peripheral zone (on left) and in central gland (on right).
Table 4 ROC curves for T2, T2 + DW, T2 + DW + DCE and PSsumscores in cancer detection in peripheral zone (on left) and in central gland (on right).
PZ CG AUC p AUC P T2 score 0.805 0.002 0.875 0.42 T2 + DW 0.855 <0.001 0.969 0.011 T2 + DW + DCE 0.918 <0.001 0.938 0.017 T2 + DW + DCE + MRS 0.923 <0.001 0.953 0.014
Table 5 Agreement (sensitivity, specificity and accuracy) in peripheral zone.
Pathology Sensitivity Specificity PPV NPV Accuracy
Non cancerous Cancerous
T2 score 63 11 18 58.14 100.0 100.0 37.93 66.67 >3 0 25 T2 + DW 67 11 15 65.12 100.0 100.0 42.31 72.22 >7 0 28 T2 + DW + DCE 610 11 10 76.74 100.0 100.0 52.38 84.48 >10 0 33 T2 + DW + DCE + MRS 612 11 7 83.72 100.0 100.0 61.11 87.04 >12 0 36
Sensitivity and specificity were detected according to selected thresholds and are shown inTable 6.
Thus the PI-RADS sum score in both PZ lesions and CG lesions showed no false positive results with 100% specificity for scores above 12.
More of the PI-RADS score combinations were analyzed in order to identify the best single score that should be added to the T2 score as a first priority when there is no availability for all sequences to improve the diagnostic performance of T2 in both peripheral zone and central gland lesions (Figs. 3–7).
The DCE score was the best combination for the T2 score regarding the peripheral zone lesions with anAz= 0.921 for
T2 + DCE combination, while regarding the central gland lesions as expected from the above results the DWI was the best combination for the T2 score withAz= 0.969.
At the selected Threshold of >6, the T2 + DCE combina-tion at PZ showed sensitivity of 74.42% and specificity of 100% while the T2 + DW combination at CG showed sensi-tivity of 75% and specificity of 100%. Detailed AUC values for different combinations are shown inTable 7.
The frequency of the curve types used within the DCE score for cancerous and non cancerous lesions was also studied and there was a statistically significant difference between the two groups with about 50% of the cancerous lesions which showed type 3 curves and about 70% of the non cancerous lesions which showed type 1 curves.
4. Discussion
Prostate Imaging Reporting and Data scoring system and mpMRI have a promising role in Pca detection, and so the
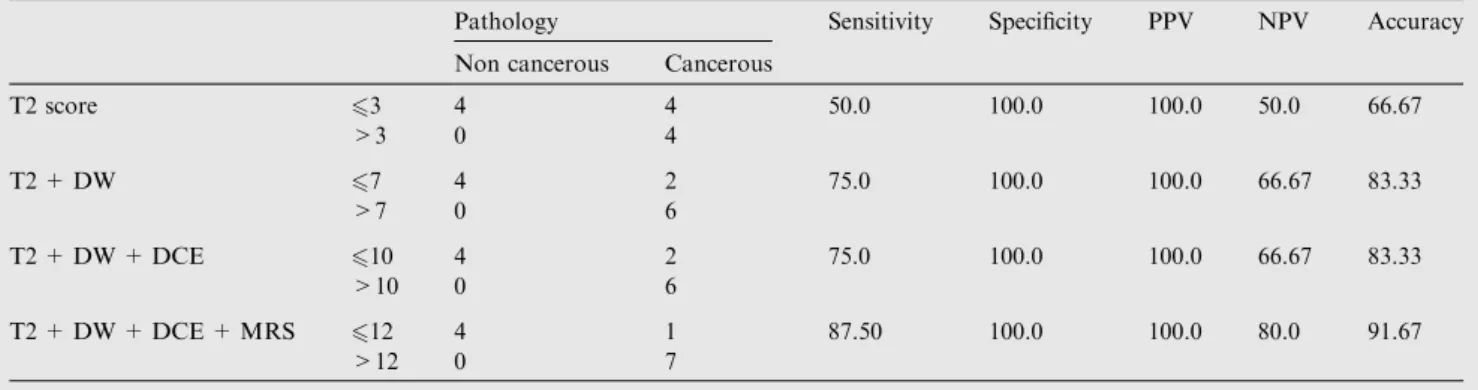
Table 6 Agreement (sensitivity, specificity and accuracy) in transitional zone.
Pathology Sensitivity Specificity PPV NPV Accuracy
Non cancerous Cancerous
T2 score 63 4 4 50.0 100.0 100.0 50.0 66.67 >3 0 4 T2 + DW 67 4 2 75.0 100.0 100.0 66.67 83.33 >7 0 6 T2 + DW + DCE 610 4 2 75.0 100.0 100.0 66.67 83.33 >10 0 6 T2 + DW + DCE + MRS 612 4 1 87.50 100.0 100.0 80.0 91.67 >12 0 7
Fig. 3 Case (1): A 74-years male patient presented with LUTS and high PSA (28 ng/ml), inconclusive DRE. mpMRI (a) T2 axial image shows ill-defined hypointense lesion at the inferior aspect of the left central zone (Segments 11a, 11p) with T2 score considered = 3. (b) DWII shows hyperintense signals at high b value (800 s/mm2). (c) ADC map showing very low ADC value of the lesion around
0.510 3cm s2. (DW score = 5) (d) DCE-MRI showing focal early enhancement of contrast (e) DCE-MRI showing delayed washout of contrast of the described lesion. (f) DCE-MRI regenerated curves with type 3 curve (in solid line) (DCE score = 5 where 3 points for type 3 curve +2 points for focal asymmetrical enhancement) (g) MRSI showing very high Cho relative to Ci and Cr levels (ChoCi) (MRS score = 5). Conclusion: PI-RADS sum score of 18 consistent with a neoplastic focus of prostatic carcinoma. Histopathology: TRUS biopsy showed Left prostatic adenocarcinoma with Gleason score 6(3 + 3).
current study investigated different MR parameters recom-mended by the ESUR regarding their individual as well as their combined diagnostic performances. Current data showed that the PI-RADS scoring system is a good tool to differentiate Pca from non cancerous lesions showing higher probability of Pca with higher PI-RADS scores. The use of single different scores resulted in lower diagnostic accuracy with improved accuracy for combined scores.
Regarding peripheral zone lesions, results of the current study revealed that PI-RADS sum score for T2, DWI, DCE and MRS showed the highest AUC for cancer detection (Az= 0.923) and using a cut-off value 12, showed highest
sen-sitivity of 83.72% and highest specificity of 100%. Applying single PI-RADS score in the peripheral zone led to lower AUC for cancer detection. The highest AUC for single score was for DCE score (0.921) followed by MRS. However, DWI showed highest sensitivity of (90.70%) on using a selected threshold of 3 for the single scores.
Our data showed increased sensitivity and diagnostic per-formance on increasing combinations between scores as sensi-tivity was 58% for T2 score, 65% for combined T2 + DWI score, 76% for combined T2 + DWI + DCE score, 83% for PSsum(T2 + DWI + DCE + MRS) and showed a specificity of 100% for all and so reaching the highest performance when using the summed PI-RADS score for all the sequences
together. Analyzing different combinations showed best com-bined score for cancer detection in PZ score was for comcom-bined T2 + DCE scores.
This was concordant with results of previous studies who evaluated PI-RADS scoring system using results of MRI TRUS fusion biopsy (16), direct MRI-guided biopsy (17), and radical prostatectomy as a reference standard (18), and all stated that PI-RADS scoring system has a good diagnostic performance with high sensitivities, and accuracies with high inter-observer agreement. In all these studies, a sum score has been used to integrate the individual scores for each sequence in an overall score for a lesion. However, the optimal cutoff values for a sum score ranged from 8 to 10 as they only included T2, DW and DCE scores without using MRS score. On the other hand, mpMRI results in the central gland (CG) still show some controversy and need more evaluation in the future. For CG lesions, PI-RADS sum score showed high AUC of 0.953; however, the combination of T2 + DWI score showed numerically the highest AUC of 0.969. The only single score that showed statistically significant AUC was T2 score (Az= 0.875).
Chesnais et al.(19)showed that excellent characterization of CG nodules could be achieved by combining T2 morpho-logical features including homogeneous low signal intensity at T2WI, lack of capsule, ill-defined margins with erased
char-Fig. 4 Case (2): 68-years male patient had LUTS and anal pain with right basal hard gland on DRE and PSA of 8.5 ng/ml. mpMRI (a) Axial T2 FSE sequence showing well-defined hypointense focus (T2 score = 4), (b) The lesion exhibited hyperintensity in DWI at highb value (800 s/mm2), (c) ADC map revealed low ADC value measuring around 0.610 3cm s2. (DW score = 5) and (d) MRS revealed high Cho relative to Ci and Cr levels (Cho > Ci). (MRS score (4) (e and f) DCE-MRI showing early focal enhancement and delayed washout of contrast of the described lesion. (g) DCE-MRI regenerated curves with type 3 curve (in solid line) of the suspicious focus. (DCE score = 5 where 3 points for type 3 curve +2 points for focal asymmetrical enhancement). Conclusion: mpMRI showed a PI-RADS sum score of 18 reflecting focal nodule of prostatic carcinoma located in the right lobe, at its mid and basal segments (segments 4p and 6p). Histopathology TRUS biopsy proved to be adenocarcinoma Gleason score 7 (4 + 3).
coal appearance, lenticular or amorphous shape and they sug-gested these features are significant predictors of malignancy among TZ nodules. At the same study, as in other studies (20,21), ADC value was significantly lower in transitional can-cers than in BPH nodules. Nevertheless, a large overlap of ADC values was observed between benign and malignant nod-ules. Furthermore, ADC value is known to be highly depen-dent on the sequence parameters. This resulted in difficulty in defining meaningful threshold to discriminate cancers among TZ nodules, and so DWI might be of little help alone in detecting and characterizing TZ tumors.
Our results were also matching with previous study by Baur et al.(22), where they found that T2WI had the highest AUC compared to other single scores and that addition of DWI to T2WI had yielded a better diagnostic performance for cancer detection in the TZ. This also was concordant with the findings by Schimmoller et al.(23), where they analyzed Pca detection in CG and stated that the combination of T2WI and DWI Scores achieved the highest test accuracy.
In controversy with the results in the PZ, our results in the central gland lesions showed that adding DCE score resulted in reduction of AUC score with no improvement of diagnostic performance for Pca detection. However, still statistical analy-sis of our data regarding CG cancer is limited and lacking sta-tistical power due to the small number of patients with pure CG lesions.
Schimmo¨ller et al.(23), stated that the DCE has a different appearance regarding its localization and neglecting DCE in TZ lesions could possibly be a key to better cancer detection. However, for clinical routine, mpMRI excluding DCE cannot be recommended due to the fact that additional benefit in read-ing accuracy is dependread-ing on tumor location and grade.
In line with our results, studies by Baur et al.(22)and Kuru et al.(24)had showed that the addition of DCE-MRI to a sum score of T2WI and DWI did not substantially improve the diagnostic performance. It is attributed to overlap with highly vascularized BPH nodules in CG that showed enhancement patterns similar to that of cancer and therefore limit the accu-racy of DCE-MRI.
Conflicting results have been published regarding the value of DCE imaging in detecting and characterizing TZ tumors. Delongchamps et al.(25)found DCE-MRI decreases the accu-racy of T2WI and DWI in the central gland without signifi-cantly improving it in the peripheral zone. Kuru et al. (24) stated that DCE did not add significant value to diagnosis of Pca. However, other studies showed high sensitivity and speci-ficity for DCE in detection and staging of Pca(26).
Junker et al.(27) stated that, it is doubtful whether DCE has a diagnostic value for Pca detection in the TZ at all. In line with the previous data, a degree of overlap for DCE in differ-entiating Pca from benign prostatic hyperplasia has been described(20). They also suggested that the PI-RADS has to
Fig. 5 Case (3):66-years male patient had LURTS and right hard nodule on DRE (PSA was 24 ng/ml). mpMRI: (a and b) Axial and Sagittal T2 FSE showed focal lesion at the basal and midzonal regions of right central zone displaying hypointensity typical for ‘‘erased charcoal appearance”(T2 score = 4). (c) The lesion exhibited hyperintensity on DWI at highbvalue (800 s/mm2) and (d) Low ADC value
around 0.610 3cm s2. (DW score = 5) (e and f) DCE-MRI showing focal early enhancement and delayed washout of contrast of the suspicious focus. (g) DCE-MRI regenerated curves with type 3 curve (in solid line) of the suspicious focus. (DCE score = 5 where 3 points for type 3 curve +2 points for focal asymmetrical enhancement). (h) MRS showing abnormal spectroscopic pattern with high Cho relative to Ci and Cr levels (Cho > Ci). (MRS score = 4). Conclusion: mpMRI showed a PI-RADS sum score of 18 favoring prostatic carcinoma along the right central zone of mid and basal gland (segments 3a–1a). Histopathology TRUS biopsy revealed adenocarcinoma Gleason score 3 + 1, then Robotic radical prostatectomy was performed and confirmed the histopathology.
be improved regarding the DCE in TZ, possibly by using a dif-ferent description for scores in PZ and in TZ, as has been done for T2-weighted imaging.
Our results showed that PI-RADS overall for PZ lesions as well as PI-RADS overall for CG lesions showed no false pos-itive results with 100% specificity for the scores 4 and 5. These go in line with the study by Boesen et al.(28), who stated that there is highly significant correlation between positive biopsies and lesion suspicion on mpMRI using PI-RADS classification. If mpMRI showed a high suspicion of Pca on PI-RADS scor-ing, then 89% (32 out of 36) were positive at biopsy. On the other hand, only 6% (five out of 86) with PI-RADS low suspi-cion on mpMRI were positive for Pca.
This goes well with the results by Junker et al. (27), who showed that only 3 % of benign lesions have been scored with PI-RADS 4 or 5, whereas 83 % of malignant lesions had such high score levels. 100 % of high-grade Pca lesions were found at score level of 4 or 5, concluding that an overall PI-RADS score of 1 and 2 primarily revealed benign changes, and in score 3, there was a certain amount of low-grade Pca, while only high-grade cancer scored 4 or 5.
Current study limitations included the following. first we only used whole gland pathology in 7 cases while the histopathological data of the rest of lesions were depending
on the TRUS biopsy. Second, there was limited number of pure central gland lesions which caused lack of significant power regarding this group and that is attributed to that cen-tral gland cancers are only representing 25–30% of prostate cancer(29). Third, we have evaluated all sequences in the same reading session. The appearance of a lesion in one sequence might have affected its identification in another sequence where bias resulting from the radiologist being aware of a lesion depicted in other sequences would presumably lead to an underestimation of differences in the diagnostic perfor-mance of different sequences. However, in clinical routine, the sequences of mpMRI data set are also evaluated together. Finally we did not use endo-rectal coil due to high cost and patient discomfort; meanwhile, it is recommended at 1.5T only for MRS sequence which is still considered optional by ESUR (13).
Using of PI-RADS scoring system and its new developing experience is currently expanding where recent meta-analysis by Hamoen et al. showed that there was one study from 2012 after the ESUR proposed the PI-RADS scoring system, and there were eight studies from 2013 and five from the first 3 months of 2014 and ongoing(30).
So mpMRI is increasingly being recognized as a valuable tool to assess prostate cancer and its role in clinical practice
Fig. 6 Case (4): 56-years male patient had LUTS with PSA of 5.8 ng/ml and enlarged prostate on DRE. mpMRI: (a) Axial T2 FSE revealed small nodule at the right PZ segments 3 and 4p. (T2 score = 3) and (b) The lesion showed isointense signals on DWI at highb value. (c) ADC map showing low ADC value 0.810 3cm s2. (DW score = 4) (d) MRS revealed normal spectroscopic pattern with high
Ci and low Cho levels (CiCho). (MRS score = 1) (e) DCE-MRI regenerated curves show type 1 curve (in solid line). (DCE score = 1). Conclusion: mpMRI showed a PI-RADS sum score of 9 which lowers the risk of being prostatic neoplastic lesion. Histopathology TRUS guided biopsy was performed and revealed chronic prostatitis with no malignant cells.
and guidelines is expanding not just for cancer staging but for risk stratification and active surveillance. And in view of the results of the current study we recommend extending the role of mpMRI into the guidelines of early cancer detection.
Conclusions of the current study showed that the PI-RADS scoring system is a good tool to differentiate Pca from non cancerous lesions showing higher probability of Pca with higher PI-RADS scores. The use of single different scores
Fig. 7 Case (5): A 76-years male patient presented with LUTS and high PSA (84 ng/ml), DRE showed firm left lobe with enlarged seminal vesicle. mpMRI: Post TURP central prostatic defect with bilateral hypointense lesions involves the peripheral zones: (a) T2 axial sequence revealed an ill-defined hypointense lesion at the right PZ (segment 3p) with intact prostatic capsule. (T2 score = 3) (b and c) T2 axial sequence shows another larger hypointense lesion at the left PZ (segment 7 and 9p) invading prostatic capsule, ipsilateral NVB and SV. (T2 score = 5) (d) T2 coronal sequence shows the left sided lesion with SVI as well as pelvic bone deposits. (e and f) The left sided lesion exhibited DWI hyperintensity with low ADC signals, measuring (0.610 3mm2/s). (DW score = 5) (g and h) The right sided
lesion showed isointense signals on DWI and low ADC measuring (0.910 3mm2/s). (DW score = 4) (i) DCE-MRI regenerated curves show type 2 curve (in solid line) for the left sided lesion, (DCE score = 4 where 2 points for type 2 curve and +2 points for focal asymmetrical enhancement), while it shows type 1 curve (dashed line) for the right sided lesion with no focal enhancement (DCE score = 1) (j and k) MRS showing abnormal spectroscopic pattern of the left sided lesion with very high Cho relative to Ci and Cr levels (ChoCi) (MRS score = 5), while it shows preserved spectroscopic pattern of the right sided lesion with normal Ci levels (CiCho) (MRS score = 1). Conclusion: mpMRI showed a PI-RADS sum score of 19 for the left sided lesion consistent with a neoplastic focus of prostatic carcinoma, while it showed a PIRADS sum score of 9 for the left sided lesion which lowers the risk of prostatic cancerous lesion on this side. Histopathology: TRUS biopsy showed left prostatic adenocarcinoma with Gleason score 7(4 + 3) and left seminal vesicle involvement while it shows no cancerous lesions on the right side.
resulted in lower diagnostic accuracy with improved accuracy for combined scores.
Conflict of interest
Author states that there is no conflict of interest. References
(1)Hoeks CM, Barentsz JO, Hambrock T, Yakar D, Somford DM, Heijmink SW, et al. Prostate cancer: multiparametric MR imaging for detection, localization, and staging. Radiology 2011;261(1):46–66.
(2)McMahon CJ, Bloch BN, Lenkinski RE, Rofsky NM. Dynamic contrast-enhanced MR imaging in the evaluation of patients with prostate cancer. Magn Reson Imag Clin N Am 2009;17 (2):363–83.
(3)Shimofusa R, Fujimoto H, Akamata H, Motoori K, Yamamoto S, Ueda T, et al. Diffusion-weighted imaging of prostate cancer. J Comput Assist Tomogr 2005;29(2):149–53.
(4)Rosenkrantz AB, Kong X, Niver BE, Berkman DS, Melamed J, Babb JS, et al. Prostate cancer: comparison of tumor visibility on trace diffusion-weighted images and the apparent diffusion coefficient map. AJR Am J Roentgenol 2011;196(1):123–9. (5)Afnan J, Tempany CM. Update on prostate imaging. Urol Clin N
Am 2010;37(1):23–5.
(6)Villeirs GM, Oosterlinck W, Vanherreweghe E, De Meerleer GO. A qualitative approach to combined magnetic resonance imaging and spectroscopy in the diagnosis of prostate cancer. Eur J Radiol 2010;73(2):352–6.
(7)Rais-Bahrami S, Turkbey B, Grant KB, Pinto PA, Choyke PL. Role of multiparametric magnetic resonance imaging in the diagnosis of prostate cancer. Curr Urol Rep 2014;15(3):387. (8)Haider MA, van der Kwast TH, Tanguay J, Evans AJ, Hashmi
AT, Lockwood G, et al. Combined T2-weighted and diffusion-weighted MRI for localization of prostate cancer. AJR Am J Roentgenol 2007;189(2):323–8.
(9)Kim CK, Park BK, Lee HM, Kwon GY. Value of diffusion-weighted imaging for the prediction of prostate cancer location at 3T using a phased-array coil: preliminary results. Invest Radiol 2007;42(12):842–7.
(10)De Rooij M, Hamoen EH, Futterer JJ, Barentsz JO, Rovers MM. Accuracy of multiparametric MRI for prostate cancer detection: a meta-analysis. AJR Am J Roentgenol 2014;202(2):343–51. (11)Haghighi M, Shah S, Taneja SS, Rosenkrantz AB. Prostate
cancer: diffusion-weighted imaging versus dynamic-contrast enhanced imaging for tumor localization – a meta-analysis. J Comput Assist Tomogr 2013;37(6):980–8.
(12)Wu LM, Xu JR, Ye YQ, Lu Q, Hu JN. The clinical value of diffusion-weighted imaging in combination with T2-weighted
imaging in diagnosing prostate carcinoma: a systematic review and meta-analysis. AJR Am J Roentgenol 2012;199(1):103–10. (13)Barentsz JO, Richenberg J, Clements R, Choyke P, Verma S,
Villeirs G, et al. ESUR prostate MR guidelines 2012. Eur Radiol 2012;22(4):746–57.
(14)Obenauer S, Hermann KP, Grabbe E. Applications and literature review of the BI-RADS classification. Eur Radiol 2005;15 (5):1027–36.
(15)Roethke M, Blondin D, Schlemmer HP, Franiel T. PI-RADS classification: structured reporting for MRI of the prostate. Rofo 2013;185(3):253–61.
(16)Portalez D, Mozer P, Cornud F, Renard-Penna R, Misrai V, Thoulouzan M, et al. Validation of the European Society of Urogenital Radiology scoring system for prostate cancer diagno-sis on multiparametric magnetic resonance imaging in a cohort of repeat biopsy patients. Eur Urol 2012;62(6):986–96.
(17)Schimmoller L, Quentin M, Arsov C, Lanzman RS, Hiester A, Rabenalt R, et al. Inter-reader agreement of the ESUR score for prostate MRI using in-bore MRI-guided biopsies as the reference standard. Eur Radiol 2013;23(11):3185–90.
(18)Rosenkrantz AB, Kim S, Lim RP, Hindman N, Deng FM, Babb JS, et al. Prostate cancer localization using multiparametric MR imaging: comparison of Prostate Imaging Reporting and Data System (PI-RADS) and Likert scales. Radiology 2013;269 (2):482–92.
(19)Chesnais AL, Niaf E, Bratan F, Mege-Lechevallier F, Roche S, Rabilloud M, et al. Differentiation of transitional zone prostate cancer from benign hyperplasia nodules: evaluation of discrim-inant criteria at multiparametric MRI. Clin Radiol 2013;68 (6):323–30.
(20)Oto A, Kayhan A, Jiang Y, Tretiakova M, Yang C, Antic T, et al. Prostate cancer: differentiation of central gland cancer from benign prostatic hyperplasia by using diffusion-weighted and dynamic contrast-enhanced MR imaging. Radiology 2010;257 (3):715–23.
(21)Kim JH, Kim JK, Park BW, Kim N, Cho KS. Apparent diffusion coefficient: prostate cancer versus noncancerous tissue according to anatomical region. J Magn Reson Imag 2008;28(5):1173–9. (22)Baur AD, Maxeiner A, Franiel T, Kilic E, Huppertz A, Schwenke
C, et al. Evaluation of the prostate imaging reporting and data system for the detection of prostate cancer by the results of targeted biopsy of the prostate. Invest Radiol 2014;49(6):411–20. (23)Schimmo¨ller L, Quentin M, Arsov C, Hiester A, Buchbender C, Rabenalt R, et al. MR-sequences for prostate cancer diagnostics: validation based on the PI-RADS scoring system and targeted MR-guided in-bore biopsy. Eur Radiol 2014;24(10):2582–9. (24)Kuru TH, Roethke MC, Rieker P, Roth W, Fenchel M,
Hohenfellner M, et al. Histology core-specific evaluation of the European Society of Urogenital Radiology (ESUR) standardised scoring system of multiparametric magnetic resonance imaging (mpMRI) of the prostate. BJU Int 2013;112(8):1080–7. (25)Delongchamps NB, Rouanne M, Flam T, Beuvon F, Liberatore
M, Zerbib M, et al. Multiparametric magnetic resonance imaging for the detection and localization of prostate cancer: combination of T2-weighted, dynamic contrast-enhanced and diffusion-weighted imaging. BJU Int 2011;107(9):1411–8.
(26)Kozlowski P, Chang SD, Jones EC, Berean KW, Chen H, Goldenberg SL. Combined diffusion-weighted and dynamic contrast-enhanced MRI for prostate cancer diagnosis: correlation with biopsy and histopathology. J Magn Reson Imag 2006;24 (1):108–13.
(27)Junker D, Quentin M, Nagele U, Edlinger M, Richenberg J, Schaefer G, et al. Evaluation of the PI-RADS scoring system for mpMRI of the prostate: a whole-mount step-section analysis. World J Urol 2014 [Epub ahead of print].
(28)Boesen L, Noergaard N, Chabanova E, Logager V, Balslev I, Mikines K, et al. Early experience with multiparametric magnetic resonance imaging-targeted biopsies under visual transrectal
Table 7 AUC values for T2 PIRADS score and its combi-nations for cancer detection in the peripheral zone and central gland. PZ CG AUC p AUC P T2 score 0.805 0.002 0.875 0.042 T2 + DW 0.855 <0.001 0.969 0.011 T2 + DCE 0.921 <0.001 0.891 0.034 T2 + MRS 0.887 <0.001 0.813 0.089
ultrasound guidance in patients suspicious for prostate cancer undergoing repeated biopsy. Scand J Urol 2014;49(1):1–10. (29)Hoeks CM, Hambrock T, Yakar D, Hulsbergen-van de Kaa CA,
Feuth T, Witjes JA, et al. Transition zone prostate cancer: detection and localization with 3-T multiparametric MR imaging. Radiology 2013;266(1):207–17.
(30)Hamoen EH, de Rooij M, Witjes JA, Barentsz JO, Rovers MM. Use of the Prostate Imaging Reporting and Data System (PI-RADS) for prostate cancer detection with multiparametric magnetic resonance imaging: a diagnostic meta-analysis. Eur Urol 2015;67(6):1112–21.