Feng Zhou
1Mem. ASME Department of Industrial and Manufacturing Systems Engineering, University of Michigan, Dearborn, 4901 Evergreen Road, Dearborn, MI 48128-1491 e-mails: [email protected]; [email protected]
Jackie Ayoub
Department of Industrial and Manufacturing Systems Engineering, University of Michigan, Dearborn, 4901 Evergreen Road, Dearborn, MI 48128-1491 e-mail: [email protected]
Qianli Xu
Department of Image and Video Analytics, Institute for Infocomm Research, 1 Fusionopolis Way, #21-01 Connexis, Singapore 138632 e-mail: [email protected]
X. Jessie Yang
Department of Industrial and Operations Engineering, University of Michigan, Ann Arbor, 1205 Beal Avenue, Ann Arbor, MI 48109 e-mail: [email protected]
A Machine Learning Approach
to Customer Needs Analysis
for Product Ecosystems
Creating product ecosystems has been one of the strategic ways to enhance user experience and business advantages. Among many, customer needs analysis for product ecosystems is one of the most challenging tasks in creating a successful product ecosystem from both the perspectives of marketing research and product development. In this paper, we propose a machine-learning approach to customer needs analysis for product ecosystems by examin-ing a large amount of online user-generated product reviews within a product ecosystem. First, wefiltered out uninformative reviews from the informative reviews using a fastText technique. Then, we extract a variety of topics with regard to customer needs using a topic modeling technique named latent Dirichlet allocation. In addition, we applied a rule-based sentiment analysis method to predict not only the sentiment of the reviews but also their sentiment intensity values. Finally, we categorized customer needs related to dif-ferent topics extracted using an analytic Kano model based on the dissatisfaction-satisfac-tion pair from the sentiment analysis. A case example of the Amazon product ecosystem was used to illustrate the potential and feasibility of the proposed method.
[DOI: 10.1115/1.4044435]
Keywords: machine learning, customer needs analysis, product ecosystems, kano model, design automation, design for X, design theory and methodology, product design
Introduction
With the development of the economy, the success of a business depends more on the overall experience embedded in a product eco-system than on the power of individual products. A product ecosys-tem incorporates a focal product at the center with numerous other supporting products and services to deliver an entire experience so that other more disjointed offerings cannot compete [1]. Good examples include Apple and Amazon product ecosystems. A cus-tomer usually enters the product ecosystem by buying the hardware (e.g., iPhone from Apple or Kindle tablet from Amazon). Then s/he is able to access to unlimited resources and content within the product ecosystem and to take advantage of opportunities, which could have been unavailable otherwise. Once the customer enters such an ecosystem, it is significantly difficult to exit due to the fact that the cost involved to transfer the applications and content to other devices can be huge [2]. Therefore, companies, built on product ecosystems, are not only selling their products and services but also selling, more importantly, the best possible user experience when all levels of experience are delivered from a single source.
Although the concept of the product ecosystem looks promising for strategic business advantages, it is challenging to support product ecosystem design for user experience. Jiao et al. [3] sug-gested that product ecosystem design should incorporate the notion of ambiance or context where human-product interactions were operating to improve user experience. Zhou et al. [1] examined the fundamentals of product ecosystem design for user experience
and pointed out that high-level needs, including affective and cog-nitive needs, should be considered to improve user experience. Fur-thermore, they proposed a product ecosystem design framework with three consecutive and iterative stages, i.e., affective-cognitive need acquisition, cognitive analysis, and affective-cognitive fulfillment. In this paper, we attempt to examine customer needs acquisition and analysis for a whole product ecosystem. While it is relatively easy to focus on one product at a time, it is time-consuming and challenging to reveal and analyze customer needs underlying a complete product ecosystem.
Technical Challenges
Collecting Voice of Customer Data for Product Ecosystems. Unlike a single product, a product ecosystem often involves multi-ple interdependent products and services, which makes it difficult to collect data about customer needs from a small number of users. First, the designers of various products and services of the product ecosystem are required to systematically understand the needs of a whole product ecosystem. Second, data of customer needs connecting the interrelations of various products within the product ecosystem are also essential to deliver an optimal level of user experience. Traditional methods, such as interviews, focus groups, and ethnographic approaches [4], maybe too time-consuming for short product development lead time in today’s com-petitive market [5].
Tackling Ambiguities and Scales of the Voice of Customer Data. Customer needs are often expressed in the form of natural language, and thus tend to be ambiguous [6], especially for high-level cus-tomer needs. Traditional methods often make use of qualita-tive methods, such as ethnographic research, to create a deeper 1
Corresponding author.
Contributed by the Design Theory and Methodology Committee of ASME for publication in the JOURNAL OFMECHANICALDESIGN. Manuscript received April 14, 2019;final manuscript received July 18, 2019; published online August 2, 2019. Assoc. Editor: Conrad Tucker.
understanding of customers [7]. However, such methods demand a large number of resources from subject matter experts and thus are costly and time-consuming. Another challenge is how to effectively and efficiently analyze text data [8]. Whether the voice of customer (VoC) data are collected through traditional subjective methods or recent online product reviews, the large scale and unstructuredness of text data often make it costly to deal with.
Categorizing Customer Needs for Product Ecosystems. After we obtain customer needs, it is important to classify customer needs in terms of their priority and importance in satisfying customer needs and creating an optimal level of user experience. This task is com-plicated by the fact that there are numerous interdependent products and services within the product ecosystem. Among many, the Kano model [9] was widely applied to understand different types of cus-tomer needs. However, the Kano categories are usually qualitative in nature and they cannot precisely measure the degree to which customers are satisfied [10].
Strategy for Solutions
Online User-Generated Data. Online user-generated data have proved to be a promising source to identify customer needs more efficiently and effectively than other data sources collected by tra-ditional subjective methods [8]. First, such data are often large-scale and easy to obtain at a low cost. For example, Amazon Echo Dot 2 has more than 120,000 product reviews on Amazon.com, and such reviews often describe the product user experience in different use cases from various perspectives [11]. Second, customer needs can be extracted from these online user-generated data. For example, Archak et al. [12] capitalized on such data to understand customer preferences and predict product choices and demands. Zhou et al. [13] analyzed online product reviews using sentiment analysis and case-based reasoning to extract both customers’ explicit and latent customer needs. Hence, in this research, we will collect a large amount of online user-generated reviews of a product ecosys-tem to extract customer needs.
Text Data Analysis Using Machine Learning Methods. Due to the huge amount of online user-generated data and the ambiguity involved in natural language, it is often too time-consuming to man-ually code the data for customer needs analysis. In this research, we will make use of state-of-the-art machine learning methods to analyze online user-generated reviews. First, we need to sift through the data tofilter out noise from a large amount of raw data with high efficiency and accuracy at the same time. We propose to employ a supervised machine learning technique, i.e., fastText [14]. It is significantly more efficient than deep learning models in training and testing but is often as accurate as deep learn-ing classifiers. Such a step greatly improves the quality of data and reduces the ambiguity of customer needs embedded in the noisy text data. Second, we will apply a topic modeling technique, named LDA (latent Dirichlet allocation) [15], to extract different topics of the product reviews, indicating different groups of customer needs. LDA is an unsupervised machine learning technique with high efficiency and is able to generate different topics related to cus-tomer needs automatically at the product ecosystem level, which is then combined with the quantitative customer preferences as input to categorize customer needs for the product ecosystem. Third, we use a rule-based (i.e., unsupervised) sentiment analysis tool, i.e., VADER (Valence Aware Dictionary and sEntiment Reasoner) [16] to understand customer preferences quantitatively within the product ecosystem. VADER not only recognizes the sentiment of product reviews but also produces intensity scores with extremely good accuracy, which is critical to analyze the degree of customer satisfaction and dissatisfaction in the following step.
Analytical Kano Model. In order to categorize customer needs quantitatively for a product ecosystem, we will apply an analytical Kano model [10] with tangible criteria based on the output of the
quantitative customer preferences and topics from the previous steps. The tangible criteria are based on satisfaction and dissatisfac-tion scores derived from the sentiment tool, i.e., VADER, automat-ically for the whole product ecosystem.
In summary, the contributions of this research in understanding customer needs of product ecosystems are twofold. First, we examine the customer needs of a whole product ecosystem and their interdependencies across multiple products and services, as shown in Figs.6and9. In addition, the proposed method is able to show the evolution of various customer needs within the product eco-system along the temporal dimension, as evidenced in Figs.7and9. Second, we integrate machine learning techniques with the analytical Kano model seamlessly to understand different categories of cus-tomer needs within the product ecosystems. The original Kano model has been well established in supporting product specification by providing insights into different types of product attributes that are perceived to be of different levels of importance to customers quali-tatively. However, the original Kano model was constructed through customer surveys, which can be very cumbersome and costly for each and every product attribute within the whole product ecosystem [10]. By integrating the analytical Kano model with the proposed machine learning methods, it facilitates the process of customer needs analysis for product ecosystems more efficiently by speeding up data collection and analysis and more effectively by providing quantitative measures. Furthermore, the proposed method balances the tradeoffs between supervised and unsupervised machine learn-ing techniques. We use a supervised machine learnlearn-ing technique, fastText, to make sure that the noise within the online product review data isfiltered out. Then, we use unsupervised sentiment anal-ysis (i.e., VADER) and topic mining (i.e., LDA) techniques to under-stand customer satisfaction quantitatively and efficiently under the paradigm of the analytical Kano model.
Related Work
Product Ecosystem Design. The concept of the product ecosys-tem emphasizes the interrelated connections between different products and services within a coherent process. Levin [17] exam-ined multiple devices, including smartphones, tablets, TVs, com-puters, and beyond, to create user experience from an ecosystem’s perspective. Zhou et al. [18] proposed a simulation method to capture causal relationships between user experience and design elements to support product ecosystem design. Gawer and Cusumano [19] identified two types of platforms, i.e., company-specific platforms and industry-wide platforms. For company-specific platforms, a number of derivative products and services can be developed under one common ecosystem to promote innovation and user experience, whereas, for industry-wide platforms, complementary products, services, and technolo-gies can be developed within an innovative business ecosystem.
Although industrial standards of interfaces and design processes govern the evolution of product ecosystems to a large extent (e.g., the universal serial bus standards), product ecosystems are able to create a great user experience and strategic business advantages. Oh et al. [20] presented a product-service system design framework within a business ecosystem, including manufacturers, suppliers, and content providers, to identify design factors for products and ser-vices. Lee and AbuAli [21] proposed an operating system to support systematic innovative thinking for product ecosystems. Berkovich et al. [22] examined various methods in requirements engineering of the product, software, and service engineering in order to connect concepts across different domains and enable integrated requirements engineering for product ecosystems. Santos [23] dis-cussed various tools to analyze sustainable product-service system design. Zhou et al. [1] investigated the fundamental issues of product ecosystem design and proposed a conceptual model to elab-orate on the critical factors and the operational mechanism of product ecosystem design for user experience. They also proposed a three-stage framework of product ecosystem design, including affective-cognitive need acquisition, affective-cognitive analysis, and
affective-cognitive fulfillment. However, the framework is mainly conceptual, and no concrete guidelines were provided for each step.
Customer Preferences and Needs Analysis. Customer prefer-ences and needs are the keys to product success, and it is imperative to analyze customer preferences and needs at the early stages of product design. Many researchers examined customer preferences and needs from choice modeling and optimization point of views. For example, Wang and Chen [24] proposed a network-based approach to predict customer preferences for choice modeling. Burnap et al. [25] made use of feature learning methods to improve design preference prediction and found that interpretation and visualization of these features augmented data-driven design decisions. MacDonald et al. [26] examined customer preferences for sustainable products with a multi-objective optimization study. Long et al. [27] presented a framework to link the must-be require-ments with design in order to create more consumer-representative products.
Recently, many researchers examine customer preferences and needs from online product reviews because they describe customer preferences and complaints about a specific product from the users’ point of view and thus provide a good channel for informing pur-chase decisions, customer needs analysis, and product redesign and improvement. For example, Singh and Tucker [28] proposed a machine learning algorithm to predict product function, form, and behavior from online product review data, and they also found that the form of a product was highly correlated with its star rating. In order to mitigate online product rating biases, Lim and Tucker [29] examined reviewers’rating histories and tenden-cies with an unsupervised model. Ferguson et al. [30] proposed to combine ergonomically centered cue-phrases to extract useful infor-mation from online product reviews to inform the specifications of a product. Suryadi and Kim [31] correlated online product reviews with sales rank to identify the customers’ motivation behind product purchase decisions.
Unlike these methods, in this paper, we mainly focused on methods using sentiment analysis, which is widely used to analyze customer preferences and needs. Sentiment analysis is a computa-tional method to predict opinions, sentiments, and emotions expressed in online texts in terms of whether they are positive, neutral, or negative [32]. Both supervised and unsupervised methods have been proposed. Supervised methods involve a manual labeling process. For example, Kim [33] proposed a senti-ment analysis model based on word embeddings and convolutional neural networks, and this method was able to obtain accuracy between 81.5% and 93.4% across various datasets. Li et al. [34] trained an adversarial memory network for sentiment analysis across different domains (e.g., product reviews versus movie reviews) and visualized the pivotal words in the review to improve the interpretability of their deep model. However, the majority of sentiment analysis methods fails to filter uninformative review data. For example,“I love Amazon Echo Dot.”Although it expresses a positive review, it does not show what specific customer need is
satisfied, which is not informative for customer needs analysis. Therefore, in this research, we incorporate a supervisedfiltering process to remove those uninformative reviews using fastText.
Unsupervised methods make use of a list of affective lexicons semantically. For example, Ding et al. [35] created a holistic lexicon list by exploiting external evidence and linguistic rules in the language expressions. Zhou et al. [13] combined a list of affec-tive lexicons and a supervised learning method (i.e., fuzzy support vector machine) to improve sentiment prediction performance. However, the majority of the work using sentiment analysis mostly predicts online texts into positive, negative, and neutral cat-egories without an intensity score, which might not be sufficient to understand to what degree customers are satisfied or dissatisfied. In this aspect, we propose to use VADER as an unsupervised method to predict customer satisfaction quantitatively. Hutto and Gilbert [16] have shown that this method was able to outperform human raters in terms ofF1score, especially for social media text data.
Sentiment analysis methods are also able to extract product attri-butes to understand users’opinions on them. For instance, Brooke et al. [36] proposed a technique, i.e., bootstrapped named entity rec-ognition, to identify product attributes. Özdağoğlu et al. [37] inte-grated quality function deployment and topic modeling to analyze different topics related to the VoC data. Wang et al. [38] investigated unique customer preferences of two competitive products using an LDA-based topic modeling technique. Due to the success of the LDA in topic modeling, we propose to apply LDA to understand dif-ferent topics of customer needs within a product ecosystem. By using topic modeling techniques rather than specific product attributes, it allows us to examine the interrelations across different products using groups of customer needs within a specific type.
System Architecture
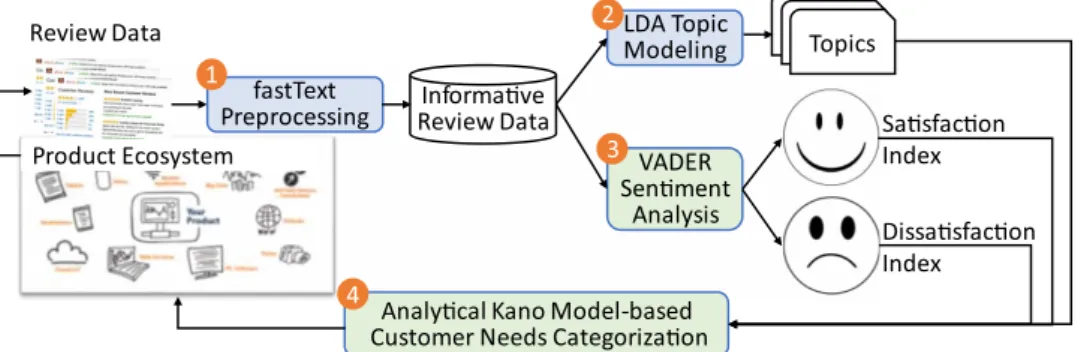
The proposed system architecture is illustrated in Fig. 1. The input of the system is the raw review data and the output is different categories of customer needs based on the analytical Kano model, indicating to what degree the current products and services involved in the ecosystem satisfy their customers. Between the input and the output, there are four important steps, including preprocessing, topic modeling, sentiment analysis, and customer needs categoriza-tion as explained below. Note that step 1 and step 2 involve the human in the loop while step 3 and step 4 are automated.
(1) fastText Preprocessing: In order to effectively remove the noise involved in the raw review data, we propose to apply fastText to remove the uninformative review data. fastText is a supervised machine learning technique and, in this research, we randomly selected a portion of the data for manual labeling to train the model. Although such manual labeling can be laborious and time-consuming, it can increase the data quality and efficiency of the following steps. (2) LDA Topic Modeling: After we obtain the informative
review data, we apply an unsupervised machine learning technique, LDA, to extract the topics involved in the
fastText
Preprocessing Review DataInformave
VADER Senment
Analysis LDA Topic Modeling
Analycal Kano Model-based Customer Needs Categorizaon
TopicsTopics Topics Sasfacon Index Dissasfacon Index Review Data Product Ecosystem 1 2 3 4
Fig. 1 The proposed system architecture. Both step 1 and step 2 involves human in the algo-rithms while step 3 and step 4 are automated.
review data. In this step, domain experts need to scrutinize and interpret the topics identified from the LDA model in terms of different types of customer needs of the product eco-system to understand the interdependence across different products and services within the product ecosystem. (3) VADER Sentiment Analysis: We use a rule-based
unsuper-vised machine learning technique, VADER, to perform sen-timent analysis on informative review data. The output of this step not only tells the polarity of the review but also calcu-lates the intensity of the review, indicating the degree of cus-tomer satisfaction or dissatisfaction.
(4) Analytical Kano Model-based Customer Needs Categoriza-tion: Based on the output from the second (i.e., topics) and third steps (satisfaction index and dissatisfaction index), we make use of the analytical Kano model to understand differ-ent categories of customer needs for the product ecosystem.
Case Study
—
Amazon Product Ecosystem
We use an Amazon product ecosystem (see Fig.2) to demonstrate the proposed method because it is relatively easy to collect data from Amazon.com while review data of other product ecosystems (e.g., Apple ecosystem) often span across different websites. The Amazon product ecosystem consists of products and services in retail, payments, entertainment, cloud computing, and others [39]. The review data are collected between 2011 and 2018 from Amazon.com and the major products include Amazon Kindle Fire tablets (7 in., 8 in., 10 in.), Kindle E-readers (Kindle Voyage, Paper White), Fire TV (Fire TV, Fire TV Stick), Echo and Alexa devices (Echo Dot), and other accessories (e.g., Kindle keyboards, Kindle leather covers, Fire TV power adapters, USB chargers). Since these products are closely related to other services provided by Amazon, such as Amazon Prime, streaming services, apps, games, music, and retail, the review data go beyond evaluating prod-ucts to include the related services. However, in this research, we are only interested in the services themselves rather than the content pro-vided by the services. There are a total number of 41,421 comments, and they are further segmented into 91,738 review sentences. Fur-thermore, in order to illustrate the proposed method, we also include the followingfive review (short for R) examples.
R1:“The build on thisfire is INSANELY AWESOME running at only 7.7 mm thick and the smooth glossy feel on the back it is really amazing to hold its like the futuristic tab in ur hands.”
R2:“This amazonfire 8 inch tablet is the perfect size.” R3:“The battery life last a long time.”
R4:“Ads are annoying.”
R5:“I recommend it to other people.”
Data Preprocessing Using fastText
The fastText Algorithm. The fastText algorithm is used tofilter out noise from the raw review data. It is a library created by Face-book for text classification and word vector representation [14], and only text classification will be discussed in this paper. The structure of fastText classification procedure is shown in Fig.3. First, each word in a review is converted into a vector using word embeddings withddimensions. Second, by averaging the word vectors, a review vector is obtained, which will be used as the input for the hidden layer. Third, a prediction is made from the class probabilities gen-erated from the softmax function.
Filtering Out Noise. Online product reviews can have a large amount of irrelevant content that is usually uninformative for cus-tomer needs elicitation and analysis. The main criteria for an unin-formative review were (1) it does not describe a product attribute or a function that satisfies a customer need (e.g.,“I have 4 other kinds of tablets” and “I recommend it to other people”), (2) it only describes a general opinion about the product (e.g., “Love it!” and“Great product”), and (3) it describes some other product, not in the Amazon product ecosystem (e.g., “We have Google home,” “iPad is too expensive”). Based on these three criteria, two of the authors manually labeled a random sample of 10,000 reviews as informative or not to train and test the fastText model. After removing four non-English and blank reviews from randomly selected 10,000 reviews, 9996 reviews were manually labeled into two categories about customer needs: informative (7453 reviews labeled as (1) and uninformative (2543 reviews labeled as 0) reviews. Between the two coders, the inter-rater agreement (Cohen’s kappa=0.86) showed excellent reliability of the coding process and those not consistent were resolved by discussions. Then, we preprocessed the text data, including removing punctua-tions, converting all letters into lowercase, and stemming. Then, thefive preprocessed reviews (short for PR) were shown as follows: PR1:“buildfire insan awesom run 77 mm thick smooth glossi
feel back realli amaz hold like futurist tab hand” PR2:“amazonfire inch tablet perfect size”
PR3:“batteri life last long time” PR4:“ad annoi”
PR5:“recommend peopl”
In order to validate the fastText algorithm, we used afivefold cross-validation technique. By selecting the parameters involved in fastText, including the number of epochs=30, the learning rate =0.3, the dimension of word embeddings (i.e.,din Fig.3)=100,
Fig. 2 Typical products and services involved in the Amazon product ecosystem
t
a
er
G
gi
fo
r
kids
Word Embeddings Review Vector Hidden Layer So Max…
0
1
…
…
…
…
…
1 2…
n-1 n OutputFig. 3 The structure of fastText classification procedure
and the number of wordn-grams=2, we produced the following results, i.e., Precision=0.91, Recall=0.93, and F1 score=0.92. Finally, we trained all the labeled data with fastText to classify the rest of the review data. For this process, we removed 19,800 (21.58%) uninformative reviews out of the 91,738 reviews and the rest 71,938 reviews were used for the following analysis. Among the five PRs, PR5 was predicted as uninformative and thus was removed while others were kept.
Topic Modeling Using Latent Dirichlet Allocation
The Latent Dirichlet Allocation Algorithm. LDA is an unsu-pervised machine learning model to discover latent topics in text data [15]. Each review document is considered as a mixture of latent topics with a sparse Dirichlet distribution. The Dirichlet dis-tribution samples over a probability simplex. Assume that LDA pre-dicts that a review document is associated with topic 1 with 60%, topic 2 with 20%, and topic 3 with 20%, and topic 1 is associated with three words with probabilities 30%, 30%, and 40%, respec-tively. Then, the three-dimensional vector [60%, 20%, 20%] is a probability simplex as the topic distribution for this document (see θm below), and [30%, 30%, 40%] is another probability simplex as the word distribution for topic 1 (seeφkbelow). LDA is able to identifyKtopics amongMinformative review documents of the Amazon product ecosystem. Assume that the total number of words involved in all the review data isVso that each word is rep-resented by aVdimensional one-hot vector,wv=(0, …, 1, …0), i.e., only the vth element is 1 and others are all zeros. Each review document can be represented by a sequence ofNwords, i.e.,w=[w1, w2, …, wN]. Following Ref. [15], we can represent the LDA model in Fig.4, where boxes indicate repeated entities. For example, the outer box withM shows that there are a total number ofMreview documents. Those in white circles represent latent variables, and only a sequence of Nwords in the shaded circle is the observed variables.The definitions of other symbols involved in the model are defined as follows:
z=[z1,…,zm,…,zM], wherezmis a topic, which is a multino-mial distribution over words;
w=[w1,w2,…,wN] is a review document with a sequence ofN words;
D=[w1,…,wm,…,wM] is a collection ofMreview documents;
θ=[θ1,…,θm,…,θM], whereθmis aK-dimensional vector of probabilities, which must sum to 1 and it is the topic distribu-tion (i.e., Dirichlet) for themth document;
α=[α1,…,αm,…,αM], whereαmis the parameter of the Dirich-let prior toθm;
φ=[φ1, …, φk, …, φK], whereφk aV-dimensional vector of probabilities, which must sum to 1, and it is the word distri-bution for thekth topic;
β=[β1,…,βk,…,βK], whereβkis the parameter of the Dirichlet prior toφk;
Based on the above notation, we can describe the graphic model of LDA in Fig.4.αdefines the topic distributionθfor all theMreview
documents. For themth document, it has a sequence ofNwords, and each word is generated by the topic zm. Furthermore, each word is also governed by the word distributionφkconditioned on the topic it represents, and the word distribution is further defined by the prior β. That is how a document with a sequence of N words is generated. Mathematically, the generative process [15] is described as follows for each document:
Forthemth document
draw a topic distribution from a Dirichlet prior θm∽Dir(α)
draw a word distribution from a Dirichlet prior φk∽Dir(β)
forthenth word
draw a topic from the topic distribution zmn∽ Multinomial(θm)
draw a word from the word distribution conditioned on the topiczmn, i.e.,wmn∽Multinomial(φzmn)
end for end for
Based on this process, we need to estimate the parameters involved in the LDA model, including θ, z, and φ, given the corpseDand prior parametersαandβ. Mathematically, we need to estimate the parameters by maximizing the posterior distribution P(θ1:M, z1:M, β1:K|D;α1:M, β1:K) with maximum a posterior. However, it is intractable to obtain the analytical solution of the parameter inference of the LDA model. Various estimate methods have been proposed, including Gibbs sampling [40] and variational methods [15]. In this research, we made use of the Text Analytics Toolbox inMATLAB2017b for parameter estimation.
Extracting Topics. The LDA algorithm is essentially a cluster-ing method of unsupervised learncluster-ing. In order to determine the number of topics K and avoid the over-clustering problem, we applied the perplexity measure [15], a frequently used measure to assess the prediction power of the model on the test data. Perplexity is a good measure of LDA performance. First, we randomly identify a training dataset and a test dataset. Second, we train the LDA model using the training dataset and then calculate the perplexity of the test dataset. A lower perplexity value indicates a higher pre-diction power. It is defined as the inverse of the geometric mean per-word likelihood:
Perplexity(Dtest)=exp −
M m=1logp(wm) M m=1Nm (1)
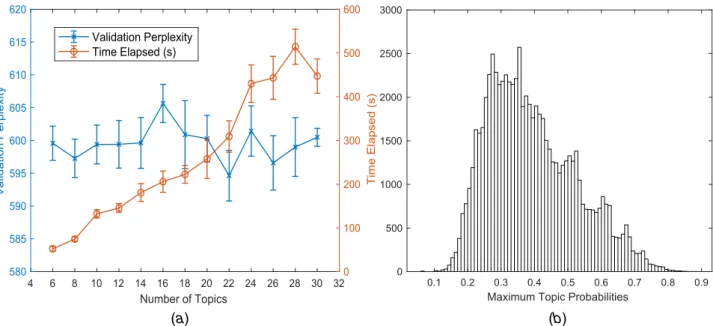
whereNmis the total number of words in themth review document in the test dataDtestwithMreview documents. In this research, we applied a 10-fold cross-validation strategy to identify the minimum perplexity measure, based on which we selected the number of topics. Figure5(a)shows how the perplexity measure changes on the test data with different numbers of topics ranging from 8 to 30 with a step size of 2 for the 10 folds of data. At the same time, it also shows the time needed to train the model with a differ-ent number of topics. We selected the number of the topic to be 22 when the minimum value of the perplexity measure (in mean± standard error) is 594.60±3.86.
We then plotted the histogram of the maximum topic probability in Fig.5(b), and it shows that there are still a large number of them with small probabilities. This indicates that those with small prob-abilities might notfit well to the topic models. We assumed that the maximum topic probabilities follow a normal distribution and set an empirical threshold mean(max(Prob(topic)))−std(max (Prob(topic))) (calculated as 0.26) and excluded those smaller than this threshold. By this assumption, we would exclude about 15.87% of the review data. In reality, this procedure removed 11,373 reviews (15.81%) out of the informative reviews and the Fig. 4 The graphic model of LDA
rest (60,565 comments) were used for the following analysis. Figure6shows the visualization of topics using word clouds. By scrutinizing the examples with probabilities over 0.5 that belongs to their individual topics, three of the authors had a focus group to discuss and interpret the natural language topics qualitatively. The names of the topics are indicated above their respective word clouds. Some topics were easier to interpret without examining the review comments. For example, thefirst topic was named“ Enter-tainment”and its top stemmed words were“game, read, plai, book, watch, and movi.”However, others were harder to interpret and typical review comments were examined to help name the topics. For example, the third topic was named “Interaction,” which would be difficult by only examining the word cloud. The typical review comments included“the issue we had was that it kept drop-ping the wificonnection”and“trying to type an email and the key-board would just stop working.” The extracted topics covered various products and services in the Amazon product ecosystem. For example, the topic, “Music-Related” not only covered Amazon Echo but also covered Amazon Music and other apps that could stream music, such as Pandora.“Usability”mainly focused on the setup of various devices, including tablets, E-readers, Echo and Alexa devices and other usability issues.“Hardware”mainly consisted of speakers, screens, batteries, cameras, and so on, across tablets, e-readers, and Echo and Alexa devices. Furthermore, through the critical words shared with different topics, we can iden-tify their interrelations. For example, interrelations between “Reading”and“Size”can be examined by the word“screen,”as it is both related to them as evidenced in Fig.6.
For the four PRs, we obtained the following results, PR1 was pre-dicted to be the topic“Hardware,”and its probability associated with this topic was 0.36, which is the maximum among the 22 topics, i.e., the maximum topic probability (see Fig. 5(b)). Similarly, PR2, PR3, and PR4 were predicted to be the topics “Size,” “Battery,” and“Interaction”with maximum probabilities, 0.66, 0.73, and 0.47, respectively. Since the maximum topic probability threshold was set at 0.26. All of these reviews were kept.
Sentiment Analysis Using VADER
The VADER Method. VADER is a rule-based machine learn-ing model based on empirically validated affective lexicons and is especially suitable for social media-like text data. According to
Ref. [16], we briefly describe how VADER is used to predict the sentiment and its intensity of the review data. First, a list of affective lexicons was built based on well-established word banks, including Linguistic Inquiry and Word Count [41], Affective norms for English words [42], and General Inquirer [43]. In addition, a full list of emoticons (e.g.,“;-)”and “:-(”), acronyms and initialisms (e.g.,“LOL”and“BRB”), and frequently used slang (e.g.,“sux” and“meh”) on social media was also incorporated. This full list ended up with over 9000 affective lexical features. Second, a high-quality control process was used to generate the intensity of the lexical features through Amazon Mechanical Turk. Each lexicon was rated from −4 (most negative valence) to 0 (neutral) to 4 (most positive valence) by 10 workers. These workers were screened, trained, and their ratings on data were selected based on data quality checking, evaluation, and validation (see Ref. [16] for details). For example,“easy”was rated as 1.9,“happy”as 2.7, while“hard”was rated as−0.4 and“hell”as−3.6. Third,five gen-eralizable heuristics were used to modify the intensity of the review data by examining the punctuation emphasis, capitalization differ-ence, degree intensifiers, contrastive conjunction, and tri-grams before affective lexicons in the data (Note: for sentiment analysis, punctuation was not removed and words were not stemmed or con-verted to lowercase.). Finally, the overall intensity was calculated by averaging all the affective lexicon scores in the data and normal-ized between−1 (extremely negative) and 1 (extremely positive). For example,“great deal”was predicted as 0.6249,“Great deal!” as 0.6588, and“GREAT DEAL!!!”as 0.7163.
Predicting Sentiment. By incorporating various affective lexi-cons with rigorous human labeling and generalizable rules, VADER is not only able to recognize the sentiment of the reviews but also can predict the intensity of the sentiment very accu-rately. Hutto and Gilbert [16] reported that VADER (r=0.881,F1= 0.96) performed similarly on human raters (r=0.888) in terms of the correlation coefficient, but performed better than human raters (F1=0.84) in terms of F1 score when classifying social media data into positive, neutral, and negative. In this research, we applied the VADER technique to the informative reviews and nor-malized the intensity values between 0 and 1.
Of all the usable 60,565 reviews, 13,199 (21.8%) of them were predicted to be neutral, 41,349 (68.3%) positive, and only 6017 (9.9%) negative. Figure7shows the sentiment distribution with intensity values from 2011 to 2018. Note those in [−1, 0) are
(a) (b) 4 6 8 10 12 14 16 18 20 22 24 26 28 30 32 Number of Topics 580 585 590 595 600 605 610 615 620 Va lid a ti o nP e rp le x it y 0 100 200 300 400 500 600 Ti me E lapsed (s) Validation Perplexity Time Elapsed (s) 0.1 0.2 0.3 0.4 0.5 0.6 0.7 0.8 0.9
Maximum Topic Probabilities 0 500 1000 1500 2000 2500 3000
Fig. 5 (a) Validation perplexity and time elapsed (in mean±standard error) changing with the number of topics and (b) histogram of the maximum topic probability of each review
negatively reviewed and those between (0, 1] are positively reviewed. The larger the absolute value, the higher the intensity. The ratio of the cumulative sum between positive reviews and neg-ative reviews showed an interesting trend within the Amazon product ecosystem (see the right vertical axis in Fig.7). Before 2014, it was decreasing and the turning point was 2014, after which the number of positive reviews increased more quickly than the number of negative reviews. Note the ratio was always larger than 1, indicating there were always more positive reviews than negative reviews. However, it should be cautious to interpret such results as the number of reviews collected was relatively small before 2015 and the majority of them were between 2016 and 2018.
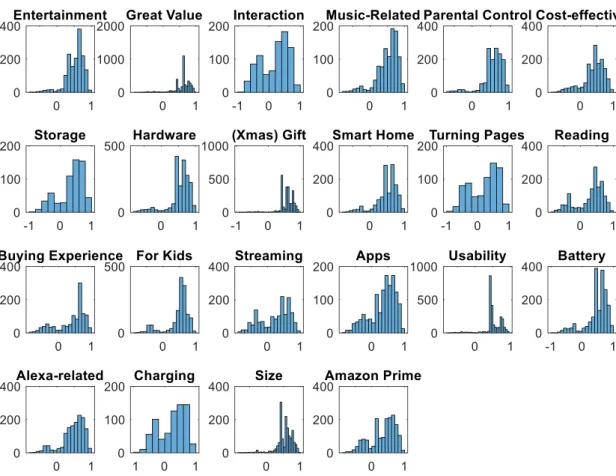
Figure8shows the histograms of sentiment intensity of individ-ual topics of all the usable 60,565 reviews. These individindivid-ual distri-butions help to tell how well each aspect of the Amazon product ecosystem performs. The values in the horizontal axis, i.e., senti-ment intensity, correspond to the left vertical axis in Fig.7. For example,“Great Value”shows that the majority of the reviews was positively evaluated (those larger than 0) while only a small portion of them was negatively evaluated (those smaller than 0). However, the numbers of positive and negative reviews in“ Interac-tion” were pretty much the same. Such distributions indicate the
Fig. 6 Topics extracted from the review comments. Note words were preprocessed (e.g., stemming, removing stop words and punctuation, converting to lowercase) and the word cloud under each topic emphasizes the most probable words with larger font sizes while ignoring other less probable words with smaller font sizes.
Fig. 7 Distribution of positive, neutral, and negative reviews and their sentiment intensity over the years of all the usable 60,565 reviews
degree to which users were satisfied or dissatisfied with different aspects of the products and services involved in the product ecosystem.
For sentiment analysis, we did not apply any text preprocessing techniques (e.g., removing punctuations, converting all letters into lowercase, stemming), and it was only conducted for usable infor-mative reviews. Therefore, only the original R1 to R4 remained. The predicted sentiment scores were as follows, R1: 0.865, R2: 0.4588, R3: 0.4003, and R4:−0.4019.
Categorizing Customer Needs Using Analytical
Kano Model
Categorizing Customer Needs. In order to further understand how each topic was evaluated by users, we proposed to use an ana-lytical Kano model to understand different types of customer needs associated with these topics. According to our previous work [10], the analytical Kano model is able to categorize customer needs associated with different topics quantitatively based on their degree of customer satisfaction and dissatisfaction. Theith value pair of dissatisfaction-satisfaction (Xi, Yi), where 1≤i≤22 is regarded as ith customer need of the Amazon product eco-system normalized between 0 and 1. Thus, as shown in Fig.9, a customer need is represented as a vector,ri=(ri, αi), where 0≤ ri=|ri|=
X2
i +Yi2
≤√2 is the magnitude of ri and 0≤αi= arctan(Yi/Xi)≤π/2 is the angle between the horizontal axis andri. When the value of ri<r0, it is not important to the customers, which is considered as an indifferent customer need, as shown in the areaOFIin Fig.9. Whenri≥r0and 0≤αi≤αL, i.e., those in the area FGDE in Fig.9are must-be customer needs. Whenri≥ r0andαL≤αi≤αH, i.e., those in the area BCDGH in Fig.9are one-dimensional customer needs. Whenri≥r0 andαH≤αi≤π/2, i.e., those in the area ABHI in Fig.9 are attractive customer needs. Within the same category, a configuration index can be defined as
a function ofriandαito indicate the priority in the product confi g-uration process.
According to the analysis of complaints and compliments [44], the value pair of dissatisfaction-satisfaction (Xi,Yi) was calculated based on the sentiment intensity values of each topic, the number of the positive reviews, and the number of the negative reviews as follows: Xi=λ× NRi TRi× INRi (2a) Yi= PRi TRi× INRi (2b)
whereλis a constant larger than 1 for negative reviews, indicating the degree of aversion to dissatisfaction and with larger values expressing more aversion [45]. NRi, PRi, and TRi are the total numbers of negative reviews, positive reviews, and all the reviews of theith topic, respectively, and INRiand IPRiare the mean intensity values of the negative reviews and the posi-tive reviews of the ith topic, respectively. In this research, we chose λ=3, r0=0.4, αL=π/6, and αH=π/3 as an example. Figure9shows the categorizing results of the customer needs in terms of different topics identified using only data before Jan. 1, 2015 (Fig. 9(a)), before Jan. 1, 2016 (Fig. 9(b)), before Jan. 1, 2017 (Fig. 9(c)), and all the collected data. Illustrated in Fig. 9 (a), Topic 10 (i.e., Smart Home) was an indifferent customer need, Topic 16 (i.e., Apps) was a must-be customer need, Topic 6 (i.e., Cost-effective) was a one-dimensional customer need, and Topic 17 (i.e., Usability) was an attractive customer need. As the types of customer needs evolved over time, all the customer needs were one-dimensional and attractive in Figs.9(b)–9(d). For example, Topic 10 (i.e., Smart Home) was changed from an indif-ferent customer need in Fig.9(a)to an attractive one in Fig.9(d) and Topic 20 (i.e., Charging) was changed from a must-be Fig. 8 Histograms of sentiment intensity of individual topics of all the usable 60,565 reviews
customer need to a one-dimensional one in Fig. 9(d). Such a dynamic form of customer needs analysis is helpful to understand the evolution of different customer needs within the Amazon product ecosystem.
For the four PRs, all of them were commented after Jan. 1, 2017, i.e., corresponding to Fig.9(d). For example, R3:“The battery life last a long time.”belongs to topic 18, i.e., “Battery” and X18= λ(NR18/TR18)INR18=3 ×(254/2352) × 0.3780=0.1225 and Y18= (PR18./TR18)IPR18=(2098/2352) × 0.5782=0.5157. Using the parameters involved in the analytical Kano model, we computed that α=arctan (0.5157/0.1225)=1.3377=76.64 deg. Similarly, we can calculate the results of R1, R2, and R4, and they correspond to Topic 8“Hardware”as an attractive customer need, Topic 21 “Size” as an attractive customer need, and Topic 3“Interaction” as a one-dimensional customer need.
Sensitivity Analysis. In the previous section, we assumed thatλ =3,r0=0.4, αL=π/6,andαH=π/3 for illustrating the results in Fig.9. In this section, we want to look into how these parameters influence the results. Figure 10illustrates how the results change
whenλtakes the value of 2, 3, 4, or 5. It shows that the value of λ. only influences dissatisfaction as it is the degree of aversion to dissatisfaction. When it increases, customer dissatisfaction also increases. Using the results from Fig.9(d), it mostly influences whether the customer needs are attractive or one-dimensional due to the fact that positive reviews are dominant in the Amazon product ecosystem. Based on our previous study, the aversion to dissatisfaction is often around 2.5 and 3.5 [45], which would result in a weak influence on the overall results.
Figure11(a)shows how the parameterr0influences the results in Fig.9(d). As shown in Fig.9(d), the minimum value ofr0is 0.4437 for Topic 22. Therefore, as long asr0is smaller than this value, it will not change the results in Fig.9(d). Based on our previous research, a typical value ofr0ranges from 0.3 to 0.5. Ifr0takes the maximum value, i.e., 0.5, the Topics of“Interaction,” “ Cost-effective,” “Storage,” “Reading,” “Streaming,” “Apps,” “ Charg-ing,”and“Amazon Prime”(i.e., 3, 6, 7, 12, 15, 16, 20, and 22) would be indifferent, which do not make sense. In other words, the results in Fig. 9(d) actually are reasonable. Finally, we examine the influence of αL and αH on the results in Fig. 9(d).
(a) (b)
(c) (d)
Fig. 9 Customer needs and their classification based on the analytical Kano model: (a) using data before Jan. 1, 2015; (b) using data before Jan. 1, 2016; (c) using data before Jan. 1, 2017; and (d) using all the collected data
We varied the value ofαLfromπ/12 toπ/4 and the value ofαH. from
π/4 to 5π/12 based on our previous research [10]. As shown in Fig. 11(b), when αL increases from π/12 to π/4, it changes the results of Topic “Turning Page” (i.e., 11) from one-dimensional to must-be. When the value of αH increases from π/4 to 5π/12, it changes the results of Topics “Interaction,” “Cost-effective,” “Storage,” “Reading,” “Buying Experience,” “Charging,” and “Amazon Prime” (i.e., 3, 6, 7,12, 13, 20, 22) from attractive to
one-dimensional, which tends to be sense. Therefore, the value of αHmay need to be increased in the previous section.
Discussions
Previous studies (e.g., Refs. [12,13]) have shown that online product reviews are an important information source for customer needs analysis. These reviews are available publicly, and it is Fig. 10 The influence ofλon the categorization of customer needs (see Fig.9(a)for legend)
(a) (b)
Fig. 11 (a) The influence ofr0on the categorization of customer needs and (b) the influence ofαLandαHon the categorization of
customer needs (see Fig.9(a)for legend)
often easy to obtain at a lower cost compared with traditional inter-views and focus groups. However, in order to make use of such reviews, three challenges must be tackled, includingfiltering out the noise, processing a large amount of review data efficiently and effectively, and identifying and understanding the rich structure of the text data [8].
Machine Learning Techniques. In order tofilter out the noise involved in the reviews, we applied three steps, including (1) remov-ing uninformative reviews, (2) removremov-ing reviews with the maximum topic probabilities below the threshold, and (3) removing neutral reviews. First, we used the fastText algorithm to remove unin-formative reviews. It is a very efficient algorithm with similar perfor-mance to advanced deep learning algorithms [14]. We manually labeled 9996 reviews to train and validate the model. The model trained was validated with good accuracy and was used to remove 19,800 uninformative reviews. Despite the fact that it took us approximately 14 h per expert coder (2 expert coders in total) to label 9996 reviews for training the fastText model, it was much easier to do than to conduct interviews and focus groups for data col-lection and coding for various products and services involved in the product ecosystem. This is because other steps involved in the pro-posed method are rather automated except a 2-h focus group to interpret all the extracted topics from the LDA model. Furthermore, the model trained can also be used for reviews of other types of prod-ucts because the uninformative reviews tend to be similar across dif-ferent products. Second, in the topic modeling process, there were certain reviews with small topic probabilities for the 22 generated topics. This means that the model believes the review was not related to the generated topics with high confidence. Therefore, we considered these reviews as irrelevant to the 22 generated topics and removed them for topic analysis. This process further removed 11,373 reviews (15.81%) from the informative reviews. Third, in order to assess the degree of customer satisfaction and dissatisfaction about the product ecosystem, we only kept the positive and negative reviews, which again removed 13,199 reviews. By combining these three steps, only 47,366 reviews (51.63%) out of 91,738 reviews were kept. Such a cleaning process substantially improved data quality.
In order to analyze a large amount of text data efficiently and effectively, we utilized three different types of machine learning techniques, including fastText (supervised learning), LDA (unsu-pervised learning), and VADER (rule-based unsu(unsu-pervised learn-ing). Supervised machine learning techniques usually involve a manual labeling process, which takes more time than unsupervised machine learning techniques. However, the manual labeling process for training the fastText model paid off in terms of good accuracy in filtering noise in the review data. However, there are still cases that the fastText model wrongly predicted uninformative instances to be informative (i.e., false positive), such as“this one is a lot different from the one i am replacing”and“i bought this and we have had no problems at all with it.”One possible reason is that the input was a single review sentence excerpted from a whole review, which made it difficult to identify the context of the review. This can further affect the results of sentiment analysis and topic modeling. Thus, more research is needed in this respect. In addition, we believe that the cost associated with false positives is higher than that of false negatives as noise can contaminate the customer needs while the missing customer needs may be rediscovered in other informative instances when a large amount of review data is col-lected. Thus, we can increase the cost of false positives in training the model to reduce the instances of false positives for future work. Furthermore, we considered the information of core competitors as noise so that all the topics extracted are only associated with the Amazon product ecosystem. More research is needed (e.g., aspect-based sentiment analysis) to make use of such information for cus-tomer needs analysis.
The LDA topic model effectively extracted the topics within the Amazon product ecosystem, and the generated topics cover a variety of products and services within the product ecosystem.
Although it could be subjective in interpreting the topics, by exam-ining the most representative reviews, it was helpful to understand the topics. In the future, we can label part of the data for topic mod-eling in order to further improve the accuracy of topic generation [46], though such a process can be time-consuming as the labels involved can be large. The VADER technique is effective in senti-ment analysis with good accuracy [16]. It not only produced the sentiment of the review but also calculated the intensity of the senti-ment. By aggregating the numbers of positive reviews and negative reviews and their corresponding intensity values within a topic, we calculated customer satisfaction and dissatisfaction. Compared with self-reported data, such a method tends to produce better results with limited time and resources. The number of reviews is generally much larger than the number of participants in interviews and focus groups. In addition, it is often time-consuming to collect self-reported data across a variety of products and services within a product ecosystem.
Understanding Customer Needs in Product Ecosystems. In order to understand the rich structure of the review data, we exam-ined the customer needs of the product ecosystem from the follow-ing aspects. First, the proposed method tells which aspect of the product ecosystem performs well and which needs further improve-ment. For example, Fig.8clearly shows which types of customer needs did not perform well, such as“Interaction” and “Turning Pages”and possible associated reasons can be identified in Fig.6 with the keywords, including connection, time, and app issues for “Interaction,” and screen, button, touch, and time issues for “Turning pages.”Moreover, Fig.9(d) shows that which types of customer needs are one-dimensional (e.g.,“Interaction,” “ Stream-ing,” “Reading”) and further efforts can be done to improve the per-formance of these needs.
Second, we categorized customer needs and their relative impor-tance using the analytical Kano model to understand them at the eco-system scale. When there are multiple products and services involved in the product ecosystem, how different functions are allocated or shared among them can influence user experience to a great deal. For example,“Amazon Prime”as a subscription service offers cus-tomers free 2-day delivery, streaming video and audio, and other ben-efits. This influences the customer needs involved in the topics of “Buying Experience,” “Alexa-Related (streaming music),” “ Stream-ing,”and“Entertainment.”Furthermore, even within the same cate-gory, we can still distinguish the priority of the customer needs quantitatively. That is, the larger the values of the magnitude and angle inri=(ri, αi), the more important the customer needs are. For instance,“Buying Experience”tends to be more important in sat-isfying customers than“Storage”in Fig.9(d). Hence, the ability to understand the relative importance of various customer needs gives further guidance in terms of the priority of the company strategies.
Third, another important advantage of the proposed method is how to identify the interdependence among different products and services within the product ecosystem. Customer needs within the product ecosystem often span across more than one product or service. For instance, Amazon prime enables users to watch prime videos and read books for free on various Kindle devices, and Alexa is able to facilitate buying experience and interacting with other Amazon products (e.g., turn on Fire TV). This can be evi-denced by the customer reviews, e.g.,“We are Prime Members and that is where this tablet SHINES. I love being able to easily access all of the Prime content as well as movies you can download and watch later…,” “It has the ability to talk to Alexa, surf the web, listen to music and read books/magazines.” Furthermore, Fig. 6 shows the keywords involved in different customer needs and those shared by different customer needs indicate the intuitive inter-dependence among them. Understanding how such directional rela-tionships influence the design of various products and services is the key to better satisfy customer needs in the product ecosystem. However, more research is needed to study the relationships for-mally using directed graph models, for instance.
Fourth, the proposed method is able to examine the customer needs dynamically with regard to their temporal dimension. Figure7shows the distribution of positive, neutral, and negative reviews and their sentiment intensity over the years. By examining the trend, it seems that 2014 is a turning point for the Amazon product ecosystem, in which the increasing rate of positive reviews surpassed the increasing rate of negative reviews. This result is highly correlated (ρ=0.82) with the annual Amazon net income from 2011 to 2018.2 In addition, we used the analytical Kano model for different sets of the data, i.e., data before 2015, before 2016, before 2017, and all the collected data, to categorize the customer needs related to each topic. By comparing them, we can dynamically tell how customer needs related to one specific topic evolve. For example, before 2015, there are indifferent customer needs (e.g., smart home), which seems to make sense, as Alexa was released on November 6, 2014, and not much smart home func-tions or apps were available by then. By the time of 2018, customer needs related to smart home already became attractive.
Finally, our proposed method takes online product reviews as input and customer needs and their categories within the product eco-system as output. In this sense, the proposed method is not able to analyze customer needs of product ecosystems which do not have review data. However, the customer needs identified can be used to identify the gaps in fulfilling customer needs in the product ecosys-tem, which can help develop new products. Although we used the Amazon product ecosystem as a case study, the proposed methods can apply to other types of product ecosystems (e.g., Apple product ecosystem) using data crawling algorithms when increas-ingly more users are reviewing products and services on social media (e.g., Twitter.com), review forums (e.g., Yelp.com), and online shopping websites (e.g., Amazon.com, Walmart.com). Such a method can not only help customers for purchasing decisions but also support companies for strategic planning in product design and offerings within a specific product ecosystem.
Limitations and Future Work. Kano [47] pointed out that suc-cessful product attributes followed a certain life cycle from indiffer-ent to attractive, to one-dimensional, andfinally to must-be. One good example was the remote control of a TV set, and it was an attrac-tive attribute in 1983, a one-dimensional attribute in 1989, and a must-be attribute in 1998. However, the results we obtained tended to be counterintuitive as several customer needs became attractive ones from must-be ones. First, the results we obtained were based on the analysis of complaints and compliments [44], i.e., the number of positive and negative reviews as well as their sentiment intensity. This was slightly different from the conventional definition of the dissatisfaction/satisfaction pairs in the analytical Kano model, making it more appropriate to identify different types of customer needs when different products and services in the ecosystem were reviewed in various use cases [48]. Moreover, the availability of the data was not balanced across time. The number of product reviews was only 493, and fewer types of products and services were involved in the Amazon product ecosystem before 2015. Thus, the results before 2015 might not be as reliable as those after 2015.
Second, we also observed that in Fig.7the increasing rate of pos-itive reviews tended to go up much more quickly than the increasing rate of negative reviews. This seemed to echo the fact that the intro-duction of new products (e.g., Echo and Alexa devices) and upgrades of old products (e.g., Kindle HD Tablets) from 2015 to 2018 continuously kept different types of customer needs in the attractive category at the product ecosystem level. For example, Topic 19 (“Alexa-related”) was one-dimensional before 2016, but it became attractive in 2017 and 2018 (see Fig.9), indicating it was continuously delighting customers with more skills added over time. In addition, consistent with the technology-push model, this could be due to the general technology trend software updates addressing bugs in early versions of hardware/services, which resulted in more positive reviews and moving customer
needs from the must-be category to the attractive one (see Fig.9). Therefore, the results can be very different for a demand-pull product ecosystem (e.g., Ryobi’s 18 V One Ecosystem) and more research is needed for this aspect. Althoughfirst-generation techno-logical products are strongly pushed by the innovations, their later versions often emphasize customer needs to a great extent in order to compete with similar products in the market (e.g., Kindle tablets versus iPad). Another possible reason is that it might take a longer time than the analyzed data in this research for the product ecosys-tem to show its full lifecycle. For example, the remote control took 15 years to become a must-be attribute from an attractive attribute [47]. Alternatively, our model facilitates an awareness of the life cycles of various products and services, which is helpful to deter-mine when to introduce the new products/upgrade and services.
We also need to point out other limitations of the proposed method. We only categorized customer needs related to the topics extracted at the product ecosystem level. Therefore, more detailed analysis with regard to individual products and services should be conducted in order to understand their individual performance in the future. Furthermore, the ultimate goal of customer needs analy-sis is to inform product design for its later stages. Although our current results improve designers’ understanding of customer needs of the product ecosystem by their different levels of impor-tance quantitatively perceived by the customers, it fails to directly validate the proposed method in terms of fulfilling these customer needs for product ecosystem configurations by taking producers’ capacity into account. Hence, more research is needed to further map these customer needs to various product attributes to optimize configurations of the product ecosystem.
Conclusions
In this paper, we proposed a machine-learning approach to effec-tively and efficiently analyze customer needs of product ecosystems based on the user-generated online product reviews. We addressed three challenges, includingfiltering out the noise, analyzing a large amount of text data, and understanding the rich structures of these data by using three different machine techniques and the analytical Kano model. The fastText algorithm removed uninformative review data, the LDA topic modeling method effectively extracted 22 topics related to customer needs, and the VADER method predicted both sentiment and sentiment intensity values of the reviews of each topic. Finally, the analytical Kano model was used to categorize customer needs related to each topic quantitatively. The proposed method was illustrated with a case study of the Amazon product ecosystem, and the results demonstrated the potential of the pro-posed method.
Nomenclature
w = w=[w1,w2,…,wN] is a review document with a sequence ofNwords
z = z=[z1,…,zm,…,zM], wherezmis a topic as a multinomial distribution over words
D = D=[w1,…,wm,…,wM] is a collection ofMreview documents
K = number of topics identified in LDA M = number of informative review documents
N = number of words in a review document V = total number of words involved in the data ri = the magnitude ofri
ri = vector representation of the customer needs wv = V-dimensional one-hot vector
Nm = total number of words in themth review document in test data
Dtest = test data in a review document
INRi = mean intensity values of the negative reviews of theith topic
IPRi = mean intensity values of the positive reviews of theith topic
2www.statista.com/statistics/266288/annual-et-income-of-amazoncom/