Plasma Crystals – Structure and Dynamics
∗)Alexander PIEL
Institute for Experimental and Applied Physics, Christian-Albrechts-University, D-24098 Kiel, Germany (Received 31 August 2008/Accepted 5 January 2009)
This overview describes the confinement and structure of two-dimensional plasma crystals. Phonons and Mach cones in monolayer systems can be used for diagnostic purposes. Three-dimensional plasma crystals are found as multilayer systems or as Yukawa balls. The differences between Coulomb and Yukawa balls are described by means of a simple model. Optical diagnostic methods for studying dynamical phenomena in three-dimensional plasma crystals are discussed.
c
2009 The Japan Society of Plasma Science and Nuclear Fusion Research
Keywords: complex plasma, plasma crystal, strongly coupled system DOI: 10.1585/pfr.4.013
1. Introduction
The formation of regular arrangements of charged par-ticles in a confining potential well is known for a long time from Thomson’s 1904 model of the atom [1]. Wigner, in 1934, suggested that, by correlation effects, electrons in a metal at zero temperature could settle into a body-centered cubic crystal [2]. Ordered structures of electri-cally charged, micrometer-sized aluminum particles in a Paul trap were reported by Wuerkeret al. in 1959 [3]. In the 1960 s and 70 s, charged polymer particles in a col-loidal suspension and interacting by screened Coulomb po-tentials were detected by Bragg scattering to form crys-talline structures [4–7]. Ordered Coulomb clusters consist-ing of a few laser-cooled ions in a Paul trap were report-eded in 1987 [8, 9]. Systems with large numbers of laser-cooled ions in a Penning trap [10] or a Paul trap [11] exhib-ited a shell structure as predicted by molecular-dynamics simulations [12–14]. Crystallization in non-neutral plas-mas was reviewed in Ref. [15]. The formation of ordered arrangements of micrometer-sized particles (dust) in a gas discharge plasma was predicted by Ikezi in 1986 [16] and such “plasma crystals” were experimentally realized in 1994 [17–19]. Plasma crystals opened a new window into the physics of strongly-coupled systems. Similar to colloidal suspensions, the convenient size of the particles allows direct observation of individual particle motion in a many-particle system. However, particle friction in a plasma can be made so low that dynamic phenomena be-come accessible which are overdamped in colloidal sus-pensions. Compared to trapped laser-cooled ions, the large mass (of 3×10¹¹proton masses for a 10µm diameter poly-mer particle) reduces all characteristic frequencies into the range f < 100 Hz, which is easily accessible with fast videocameras.
author’s e-mail: [email protected]
∗) This article is based on the invited talk at the 14th International
Congress on Plasma Physics (ICPP2008).
This article describes the physical processes that de-termine the structure and the dynamical properties of two and three-dimensional plasma crystals. Due to the limited space, the discussion emphasizes experimental findings.
2. Plasma Crystals
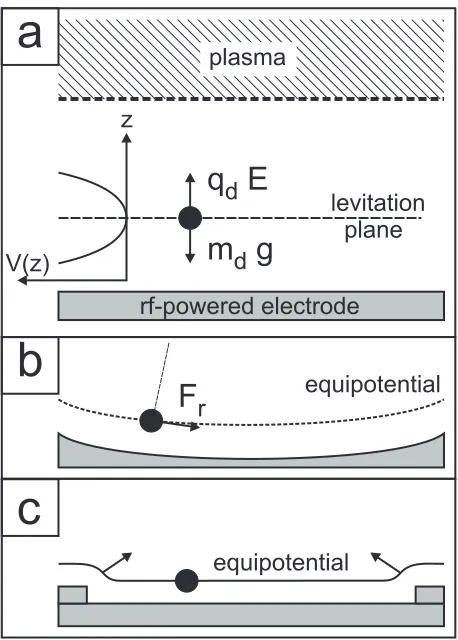
A plasma crystal is an assembly of electrically charged micrometer-sized particles (“dust”) in a gas dis-charge plasma. These particles carry a few thousand el-ementary charges. Under typical laboratory conditions in radio frequency discharges, dust particles of about 5µm di-ameter or larger are too heavy to be levitated by the weak ambipolar field inside the plasma volume. Rather, the par-ticles sediment into the sheath region before an electrode, where the time-averaged electric fieldE is strong enough to balance the weight force when the Millikan condition qdE = mdgis fulfilled (qd andmd being the dust charge
and mass, andgthe gravitational acceleration) [20]. Unlike the situation of Millikan’s oil-drop experiment, the electric field is not homogeneous but increases linearly from the sheath edge towards the electrode and leads to a parabolic potential well that provides a stable vertical confinement (see Fig. 1(a)). Dust particles in this poten-tial well have a resonance frequencyω0=(qdnie/md0)1/2,
which can be used to determine the dust chargeqd when
the ion densityniin the sheath and the particle massmdare
known [21, 22]. Lateral confinement of the dust cloud can either be realized as a harmonic potential well, e.g., by a parabolic depression of the electrode surface, or as surface confinement, which is provided by a suitable barrier on the electrode that raises the equipotentials (see Figs. 1(b), (c)). Dust confinement against gravity comes at a price. The plasma sheath is a region with a supersonic ion flow, vi > vB, where the ion velocity vi exceeds the Bohm
ve-locityvB = (kBTe/mi)1/2 (Te is the electron temperature
and mi the ion mass). This ion flow is responsible for
anisotropic shielding of the dust and provides a source
c
2009 The Japan Society of Plasma
rf-powered electrode
a
b
c
plasma
q E
d
m g
d
z
V(z)
levitation
plane
equipotential
equipotential
F
r
Fig. 1 (a) Levitation of a dust particle in the sheath. The in-homogeneous electric field leads to a vertical harmonic confinement. (b) Horizontal confinement by a parabolic shaped electrode. The restoring forceFris proportional to the radial displacement. (c) Lateral confinement by barriers.
of free energy for instabilities. Dust clouds confined in such a potential trap can form monolayers or multilayer systems. The monolayers show a hexagonal order in the plane (Fig. 2(a)), which is the expected minimum energy configuration. A two-layer system (Fig. 2(b)) has a sur-prising aligned structure. This alignment is a consequence of the ion flow, which is deflected by the highly charged particle and forms an “ion focus” in the wake of the up-per particle (see Fig. 2(c)) [23, 24]. The positive charge in the ion focus then attracts the lower particle. Long strings of particles can be formed in multilayer systems in rf dis-charges [17, 21, 25] or in dust clouds trapped in a striation of a dc-discharge, [26]. A detailed discussion of wakefield attraction can be found in Ref. [27].
Bulk order (fcc,bcc,hcp) was found in multilayer sys-tems in the sheath region when the ion focus was de-stroyed by ion-neutral collisions at enhanced gas pres-sure [28, 29]. The high gas prespres-sure prevented studying dynamic phenomena in these systems. A face-centered or-thorhombic structure was reported for a cloud of very small particles (1.4µm diameter) suspended in the quasineutral plasma [30]. Under microgravity, a region of the dust cloud
Fig. 2 (a) Top view of a two-layer plasma crystal. (b) Side view showing vertical alignment. (c) Deflection of the super-sonic ion flow by the upper particle and formation of a positive net charge in the ion focus.
was found crystalline with domains of fcc, bcc, and hcp structure [31].
The interaction force between dust particles inside the levitation plane is a shielded Coulomb force. Collision ex-periments between pairs of particles showed that the pair interaction can be represented by a Yukawa potential
φ(r)= q
2 d
4π0r
exp
−λr (1)
with a shielding length λ ≈ λDe that is close to the
electron Debye length [32]. Unlike shielding in the bulk plasma, where the ion contribution to shielding is deter-mined by the ion temperature, ion shielding by a super-sonic flow involves the ion streaming energy, which ex-ceedskBTe. Therefore, the effective Debye length should
be comparable to the electron Debye length. This in-teraction law was independently confirmed by analyzing the self-compression of a monolayer cluster in a parabolic trap [33].
The structure of finite 2D clusters was studied by step-wise increasing the number of particles in a monolayer. It was found that symmetric patterns and shell structures are formed [34, 35]. The enhanced stability of closed shells compared to incomplete shells was demonstrated by laser-excited intershell rotation [36].
Crystallization of the particle system requires that the coupling parameterΓ for screened interaction exceeds a critical value,Γc=175 for three-dimensional systems
Γ= q
2 d
4π0aWSkBTd
exp
−aWS
λ
. (2)
Here,aWS=(3/4πnd)1/3is the Wigner-Seitz radius,ndthe
dust number density andTd the dust kinetic temperature.
The large value ofqd = (103-104)eallows crystallization
3. Waves in Monolayer Systems
The interparticle forces in a plasma crystal can be ex-plored by exciting elastic waves. A monolayer supports compressional and shear modes in the plane, which have different sound speeds and a different dependence on the shielding length [37]. Measuring both sound speeds is a suitable method to determineqd and λ. Wave
experi-ments were restricted to monolayer plasma crystals, be-cause multilayer systems are subject to the Schweigert in-stability [24, 38], which is fed by the free energy of the streaming ions and leads to violent oscillations and sub-sequent melting of the crystal. Compressional waves can be excited by the radiation pressure of a laser [39–41] and qdandλcould be derived from dispersion and damping of
the waves. The excitation of shear waves was introduced in Ref. [42]. Besides the study of plane waves, radiation from a point source was discussed in Ref. [43], and the local-ized shear was found to excite elastic vortex pairs. Instead of laser excited waves, the spectra of compressional and shear phonons can also be recovered by Fourier analysis of the thermal fluctuations of the particles [44]. Recent inves-tigations were focussed on the modification of the phonon spectra near the melting transition [45]. Short wavelength shear waves in the liquid phase could be excited with a laser [46] and the expected long-wavelength cut-offfor shear waves in the liquid phase was confirmed [47]. The nonlinear interaction of compressional phonons was ob-served above a threshold value that depends on frictional damping [48].
Instead of their wave dispersion properties, compres-sional and shear modes can be studied by exciting Mach cones. The first observation of Mach cones excited by fast out-of-plane particles [50] was accidental. Laser excitation of Mach cones was introduced in Ref. [51]. The half-angle μof the Mach cone is related to the sound speedcsby
sin(μ)=cs/u, (3)
where u is the velocity of the disturbance that generates the Mach cone. Wave dispersion outside the acoustic part of the dispersion branch leads to an internal interference structure of the Mach cone [52], which resembles the trans-verse and lateral wakes in the “Kelvin wedge” behind a moving ship in deep water. The simultaneous excitation of compresional and shear Mach cones and the corresponding wake structures were described in Ref. [49]. The result-ing Mach relation [Eq. (3)] is shown in Fig. 3. The differ-ent sound velocities of the compressional and shear wave become evident from the different slopes of the fit lines, which is proportinal to 1/cs. In this way, Mach cones can
be used as a diagnostic tool for monolayer plasma crystals.
4. Yukawa Balls
Spherical plasma crystals were discovered in 2004 [53] when a cloud of dust particles was levitated by the thermophoretic force arising from a vertical
tempera-Fig. 3 Test of the Mach relation for compressional and shear Mach cones (from Ref. [49]).
Fig. 4 (a) Particle arangements in the outer shell of a Yukawa ball. The superimposed Voronoi cells show the expected hexagons and pentagons as well as defects. (b) Plotting all particle positions in cylindrical coordinates (ρ,z) re-veals the shell structure (from [53]).
4.1
Structure of Yukawa balls
Some of the differences between Yukawa and Coulomb balls can be understood by a simple model based on the different interaction force. Consider a spherical as-sembly ofNparticles each carrying a chargeQ, which are confined in a parabolic potential well Vt(r) = (1/2)αr2
and interact pairwise either by a repulsive Coulomb force FC(ri j)=Q2/(4π0r2i j) or by a shielded Yukawa force
FY(ri j)=
Q2
4π0r2i j
1+ri jλ
exp
−ri jλ (4)
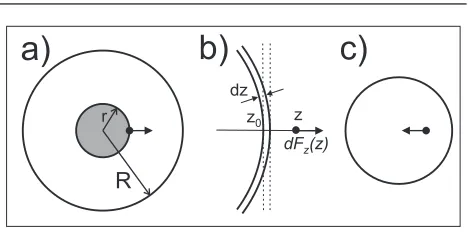
with shielding lengthλ. The peculiarity of the Coulomb force is twofold: (a) Inside a hollow sphere there is no electric field and (b) a charge distribution with spherical symmetry can be replaced by a point charge at the center of the sphere (see Fig. 5(a)). The internal structure of a Coulomb ball is therefore determined by the requirement that each particle, at radial positionr, is in a force balance between the repulsion from all those particles at positions r1 ≤rand the restoring forceFt(r)= −αrfrom the trap.
When we assume that there areN(r) particles inside the radiusr, the force balance requires
[N(r)−1]Q2
4π0r2 =αr, (5)
hence [N(r)−1]∝r3. On the other hand, when we
repre-sent the discrete particle distribution by a continuous den-sity distributionn(r), we have
N(r)≈4π r
0
n(r1)r21dr1. (6)
Hence, dN(r)/dr=4πn(r)r2∝r2can only be fulfilled for
a constant densityn(r) = 3α0/Q2 =: nC. Therefore, a
Coulomb ball in a parabolic trap is necessarily homoge-neous. In particular, the radius of a Coulomb ball
RC=
(N−1)Q2
4π0α
1/3
(7) can be obtained from the force balance of a particle at the surface.
For shielded interaction, these principles do not hold any longer. Consider a point charge Qat a distancez− z0 from a homogeneously charged (infinitely large) plane
of thickness dzand densityn(z0) (see Fig. 5(b)). The test
charge interacts with each volume element in this plane by the shielded force (4) and the resulting repulsive force becomes
dFz(z)=n(z0)
Q2
20
exp
−z−z0
λ
dz. (8)
This force now depends on the distance from the plane, whereas the force would be constant for Coulomb interac-tion. This simple model approximates the interaction be-tween a point charge and a spherical shell as long asrλ.
Fig. 5 (a) In a Coulomb ball, a particle experiences only a net force from shells withr1 <rwhile outer (hollow) shells give no net force. (b) The interaction of a particle with a shell of particles is approximated by the interaction with a charged plane. (c) In a Yukawa ball, a hollow shell exerts a net force on a particle that pushes it towards the center.
Moreover, because of the finite range of the Yukawa force, a particle in a hollow sphere, which is not at the center of the sphere, now experiences a net force that pushes it towards the center (see Fig. 5(c)). This is a first hint that Yukawa balls tend to have an inhomogeneous density pro-file.
A more quantitative description can be obtained for large Yukawa balls, which haveR/λ1. The force equi-librium for a test particle of charge Q inside a Yukawa ball is defined by the balance of a net force from a gra-dient in the densityn(r) with the confining forceFt. For
simplicity of calculation, we assume that the test particle is located between an inner and outer half space with a plane interface and a stratified set of density layers par-allel to the interface, which have a density distribution n(r1)=n(r)+(r1−r)n(r). Then, the force from the inner
and outer half spaces become F< = Q
2
20
[λn(r)−λ2n(r)],
F> = −Q
2
20
[λn(r)+λ2n(r)], (9) which define the force balance
F<+F>=−Q
2
0
λ2n(r)=αr. (10)
Hence, for a parabolic confinement, the curvature of the density profile must be a constant,
n=− α0 Q2λ2 =−
nC
3λ2 . (11)
Henning et al. [58] have shown, that the same result is obtained for a spherical geometry and for arbitraryR/λ. The density profile therefore has the shape of an inverted parabola,
n(r)=n(0)−1 6
nC
λ2 r
2. (12)
The force balance at the surface of the Yukawa ball is determined by the balance from the inner half space with the trap,F<+Ft=0, which yields
λn(R)−λ2n(R)=2
3nCR (13)
and usingn(R)=(1/3)nC(R/λ2) we obtain
n(R)=1 3nC
R
λ . (14)
Therefore, despite the radial decay of the density, a Yukawa ball has a finite value of the particle densityn(R) at the surface. Finally, the density in the center of the Yukawa ball is obtained as
n(0)= 1 3nC
R λ +
1 2
R2 λ2
, (15)
which gives the asymptotic form of the model in refer-ence [58]. Note that the density at the surface scales∝R/λ but the central density increases more rapidly∝ (R/λ)2.
Hence, the larger a Yukawa ball becomes by adding more and more particles, the sharper peaked is the density profile in the center.
The total number of particles in a large Yukawa ball is given by
N ≈ 2π
3 R
0
nC
R2−r2
λ2
r2dr = 4π
45R
5nC
λ2 . (16)
For comparison, in a Coulomb ball,N≈(4π/3)R3
CnC. This
leads to the useful relationR/λ ≈ 151/5(R
C/λ)3/5, which
shows that, compared to a Coulomb ball, the growth of the radius of a Yukawa ball is much slower for the same number of particles.
The steepening of the profile shape can be seen in Fig. 6(a). There, the profile function from reference [58] is used with the asymptotic formR/λ≈151/5(RC/λ)3/5 and
rescaled to an abscissar/RC. The shielding factor is here
given asRC/λ = (N/2)1/3r0/λ, r0 being the equilibrium
distance in the parabolic trap of two particles interacting by a Coulomb force. Forr0/λ = 1, the curves represent
N=2000,16000,and 27000 particles.
The increase of the central density in a Yukawa ball by adding more and more particles to the system was stud-ied experimentally and by computer simulation [57, 62]. The comparison is shown in Fig. 6(b). Here, the number of particles in the outermost shell becomes smaller than the prediction for a Coulomb ball (dashed line) whereas in the innermost shell, the population is larger than that of a Coulomb ball (full line). The population densities agree quite well with simulations forr0/λ= 0.6. A density
in-crease in the center could also be identified in experiments with small clusters [63].
Fig. 6 (a) Density profiles of Yukawa balls for different values ofRC/λ. (b) Measured shell populations in comparison with the prediction for Coulomb balls (dashed line) and Yukawa balls forr0/λ=0.6 (full line).
4.2
Elastic properties of Yukawa balls
The elastic properties of Yukawa ball can be derived from the eigenmodes of the system, which are the analo-gon to the phonon dispersion in infinite systems. Eigen-modes of finite two-dimensional clusters were studied ex-perimentally in Refs. [64, 65]. Usually, the mode of high-est frequency is associated with the self-similar radial ex-pansion (“breathing mode”). Recently, Henninget al. have proved that the breathing mode only exists for systems with power-law interaction or in Yukawa systems with special symmetries [66].0 = ji
F(ri j)rj−ri ri j ×ri
= ji
F(ri j)
ri j (rj×ri). (17) Assuming now a small radial expansion of the Yukawa ball by a factorD=1+, we obtain the condition
0= ji
F(D ri j) D ri j (D
2r
j×ri). (18)
Requiring the arbitrariness of theri, the interaction poten-tial must fulfil the conditionF(Dr)=βF(r). Taylor expan-sion ofFyields the differential equation
rF(r)−(β−1)F(r)=0, (19) which leads to a power-law shape of the interaction poten-tial
F(r)=arc with c=(β−1)/ . (20) The exponentcis usually negative but can even take pos-itive values, as long as the confinement by the trap is en-sured. Hence, a Coulomb ball with ther−1interaction-law possesses a breathing mode, whereas for a Yukawa ball the self-similar radial expansion is not an eigenmode, ex-cept for some specific symmetric arrangements of parti-cles. This shows again the difference between Coulomb and Yukawa balls, which originate from the different range of the interaction force.
5. Diagnostic Methods
The important difference between studying dynamic phenomena in 2D-plasma crystals and Yukawa balls is the necessity for a simultaneous measurement of the three spa-tial coordinates of all particles in the field of view. Dif-ferent methods have been developed in the last few years for this purpose: the colour gradient method [54], the stereoscopy with an orthogonal arrangement of three cam-eras [67], and digital in-line holography [68].
In the colour gradient method, a small dust cloud is illuminated by two overlapping laser sheets of different colour with opposing intensity gradients along the line of sight of a camera system. The depth information is, in prin-ciple, contained in the intensity ratio of the scattered light, which is recorded by two cameras with the same field of view and appropriate colour filters. However, the depth resolution was found unsufficient and most measurements with this system employed a third camera at right angle, which makes the arrangement a stereoscopic measurement system. With this system, small 3D dust clusters confined in a microplasma were studied with respect to the interac-tion force between the particles [69]. A detailed analysis led to the conjecture, that an attractive part of the interac-tion exists for interparticle distancesd λD, which by
far exceed the linearized Debye length. This attractive part
Fig. 7 (a) Arrangement of the cameras and the laser illumination for stereoscopic measurements (from [62]). (b) Change of the size of the Wigner-Seitz cells during a transition from metastable to ground state.
may be related to an unshielded dipole force that exceeds the shielded repulsive force at large distance [70]. In recent experiments, the normal modes of a small 3D cluster were investigated [71]. The spectrum shows a similarity with the eigenmode spectrum of a droplet, which was interpreted as a further hint at attractive forces which give the system a kind of surface tension.
Fig. 8 (a) Experimental arrangement for digital in-line hologra-phy with laser, beam expander (BE), glass box containing the Yukawa ball, neutral density filter (NDF) and CMOS camera. (b,c) Images of (N=4) and (N=7) clusters from top-view video camera (VM). (d,e) Reconstructed 3D view with projections into the horizontal plane.
above.
Holography is in principle able to record the full spa-tial arrangement of a set of particles. Because of the fi-nite pixel size in digital cameras, which are much larger than the silver grains in photographic plates for hologra-phy, digital holography is preferentially made in an in-line arrangement (DIH) (see Fig. 8(a)), which leads to smaller spatial frequencies in the interference pattern on the sensor. Like all camera methods, there is little doubt about the lateral positions of the particles in the image plane. The challenge lies in the depth resolution. The DIH method was tested with small clusters of 4 or 7 particles (Figs. 8(b)-(e)), for which a direct comparison with a video micro-scope (VM in Fig. 8(a)) can be made. The reconstructed 3D images show an excellent agreement between DIH and VM positions.
6. Concluding Remarks
Finite 3D particle arrangements represent a new and interesting research topic in the field of complex plasmas. The new questions have stimulated the development of advanced diagnostic techniques. Significant progress has been achieved with respect to the structural and dynami-cal properties of 3D clusters. Because of the overwhelm-ing number of publications in the field of plasma
crys-tals, some interesting aspects had to be omitted from this overview, like phase transitions, transport properties, col-lisions of dust clouds or quantum effects. Some of these aspects were addressed in earlier reviews [73–75].
Fruitful discussions with D. Block and M. Bonitz are gratefully acknowledged. This work was supported by DFG within SFB-TR24 projects A2 and A3, and by DLR under grant 50WM0739.
[1] J.J. Thomson, Phil. Mag.39, 237 (1904). [2] E. Wigner, Phys. Rev.46, 1002 (1934).
[3] R.F. Wuerker, H. Shelton and R.V. Langmuir, J. Appl. Phys. 30, 342 (1959).
[4] W. Luck, M. Klier and H. Wesslau, Ber. Bunsenges. Phys. Chem.50, 485 (1963).
[5] P.A. Hiltner and I.M. Krieger, J. Phys. Chem. 73, 2386 (1969).
[6] A. Kose, M. Ozaki, K. Takano, Y. Kobayashi and S. Hachiso, J. Colloid Interface Sci.44, 330 (1973). [7] R. Williams and R.S. Crandall, Phys. Lett. A 48, 225
(1974).
[8] F. Diedrich, E. Peik, J.M. Chen, W. Quint and H. Walther, Phys. Rev. Lett.59, 2931 (1987).
[9] D.J. Wineland, J.C. Bergquist, W.M. Itano, J.J. Bollinger and C.H. Manney, Phys. Rev. Lett.59, 2935 (1987). [10] S.L. Gilbert, J.J. Bollinger and D.J. Wineland, Phys. Rev.
Lett.60, 2022 (1988).
[11] M. Drewsen, C. Brodersen, L. Hornekaer, J. Hangst and J. Schiffer, Phys. Rev. Lett.81, 2878 (1998).
[12] A. Rahman and J.P. Schiffer, Phys. Rev. Lett. 57, 1133 (1986).
[13] J.P. Schiffer, Phys. Rev. Lett.61, 1843 (1988).
[14] D.H.E. Dubin and T.M. O’Neil, Phys. Rev. Lett.60, 511 (1988).
[15] D.H.E. Dubin and T.M. O’Neill, Rev. Mod. Phys.71, 87 (1999).
[16] H. Ikezi, Phys. Fluids29, 1764 (1986). [17] J.H. Chu and L.I, Physica A205, 183 (1994).
[18] Y. Hayashi and K. Tachibana, Jpn. J. Appl. Phys.33, L804 (1994).
[19] H. Thomas, G.E. Morfill, V. Demmel, J. Goree, B. Feuer-bacher and D. M¨ohlmann, Phys. Rev. Lett.73, 652 (1994). [20] A. Melzer, T. Trottenberg and A. Piel, Phys. Lett. A191,
301 (1994).
[21] T. Trottenberg, A. Melzer and A. Piel, Plasma Sources Sci. Technol.4, 450 (1995).
[22] A. Homann, A. Melzer and A. Piel, Phys. Rev. E59, 3835 (1999).
[23] F. Melandsø and J. Goree, Phys. Rev. E52, 5312 (1995). [24] V.A. Schweigert, I.V. Schweigert, A. Melzer, A. Homann
and A. Piel, Phys. Rev. E54, 4155 (1996).
[25] K. Takahashi, T. Oishi, K. Shimomai, Y. Hayashi and S. Nishino, Phys. Rev. E58, 7805 (1998).
[26] A.V. Zobnin, A.P. Nefedov, V.A. Sinel’shchikov, O.A. Sinkevich, A.D. Usachev, V.S. Filippov and V.E. Fortov, Plasma Physics Reports26, 415 (2000).
[27] A. Piel, O. Arp, D. Block, I. Pilch, T. Trottenberg, S. K¨ading, A. Melzer, H. Baumgartner, C. Henning and M. Bonitz, Plasma Phys. Control. Fusion 50, 124003 (2008).
Thomas, H. Rothermel, U. Konopka, R. S¨utterlin and D.D. Goldbeck, Phys. Rev. Lett.85, 4064 (2000).
[30] Y. Hayashi, Phys. Rev. Lett.83, 4764 (1999).
[31] A.P. Nefedov, G.E. Morfill, V.E. Fortov, H.M. Thomas, H. Rothermel, T. Hagl, A.V. Ivlev, M. Zuzic, B.A. Klumov, A.M. Lipaevet al., New J. Phys.5, 33 (2003).
[32] U. Konopka, L. Ratke and H.M. Thomas, Phys. Rev. Lett. 79, 1269 (1997).
[33] G.A. Hebner, M.E. Riley and K.E. Greenberg, Phys. Rev. E 66, 046407 (2002).
[34] V.M. Bedanov and F. Peeters, Phys. Rev. B49, 2667 (1994). [35] W.-T. Juan, Z.-H. Huang, J.-W. Hsu, Y.-J. Lai and L. I, Phys.
Rev. E58, R6947 (1998).
[36] M. Klindworth, A. Melzer, A. Piel and V.A. Schweigert, Phys. Rev. B61, 8404 (2000).
[37] F.M. Peeters and X. Wu, Phys. Rev. A35, 3109 (1987). [38] A. Melzer, V. Schweigert, I. Schweigert, A. Homann, S.
Peters and A. Piel, Phys. Rev. E54, R46 (1996).
[39] A. Homann, A. Melzer, S. Peters, R. Madani and A. Piel, Phys. Rev. E56, 7138 (1997).
[40] A. Homann, A. Melzer, S. Peters, R. Madani and A. Piel, Phys. Lett. A242, 173 (1998).
[41] A. Piel, A. Homann and A. Melzer, Plasma Phys. Control. Fusion41, A453 (1999).
[42] S. Nunomura, D. Samsonov and J. Goree, Phys. Rev. Lett. 84, 5141 (2000).
[43] A. Piel, V. Nosenko and J. Goree, Phys. Rev. Lett.89, 085004 (2002).
[44] S. Nunomura, J. Goree, S. Hu, X. Wang, A. Bhattacharjee and K. Avinash, Phys. Rev. Lett.89, 035001 (2002). [45] S. Nunomura, S. Zhdanov, D. Samsonov and G. Morfill,
Phys. Rev. Lett.94, 045001 (2005).
[46] A. Piel, V. Nosenko and J. Goree, Phys. Plasmas13, 042104 (2006).
[47] V. Nosenko, J. Goree and A. Piel, Phys. Rev. Lett.97, 115001 (2006).
[48] V. Nosenko, K. Avinash, J. Goree and B. Liu, Phys. Rev. Lett.92, 085001 (2004).
[49] V. Nosenko, J. Goree, Z.W. Ma, D.H.E. Dubin and A. Piel, Phys. Rev. E68, 056409 (2003).
[50] D. Samsonov, J. Goree, Z. Ma, A. Bhattacharjee, H.M. Thomas and G.E. Morfill, Phys. Rev. Lett.83, 3649 (1999). [51] A. Melzer, S. Nunomura, D. Samsonov and J. Goree, Phys.
Rev. E62, 4162 (2000).
[52] D.H.E. Dubin, Phys. Plasmas7, 3895 (2000).
[53] O. Arp, D. Block and A. Piel, Phys. Rev. Lett.93, 165004 (2004).
[54] B.M. Annaratone, T. Antonova, D. Goldbeck, H. Thomas and G.E. Morfill, Plasma Phys. Control. Fusion46, B495 (2004).
[55] O. Arp, D. Block, M. Klindworth and A. Piel, Phys. Plas-mas12, 122102 (2005).
[56] H. Totsuji, C. Totsuji, T. Ogawa and K. Tsuruta, Phys. Rev. E71, 045401 (2005).
[57] M. Bonitz, D. Block, O. Arp, V. Golubnychiy, H. Baumgartner, P. Ludwig, A. Piel and A. Filinov, Phys. Rev. Lett.96, 075001 (2006).
[58] C. Henning, H. Baumgartner, A. Piel, P. Ludwig, V. Golubnichiy, M. Bonitz and D. Block, Phys. Rev. E 74, 056403 (2006).
[59] C. Henning, P. Ludwig, A. Filinov, A. Piel and M. Bonitz, Phys. Rev. E76, 036404 (2007).
[60] H. Baumgartner, H. K¨ahlert, V. Golobnychiy, C. Henning, S. K¨ading, A. Melzer and M. Bonitz, Contrib. Plasma Phys. 47, 281 (2007).
[61] S. Apolinario, B. Partoens and F. Peeters, New J. Phys.9, 283 (2007).
[62] D. Block, M. Kroll, O. Arp, A. Piel, S. K¨ading, A. Melzer, C. Henning, H. Baumgartner, P. Ludwig and M. Bonitz, Plasma Phys. Control. Fusion49, B109 (2007).
[63] D. Block, S. K¨ading, A. Melzer, A. Piel, H. Baumgartner and M. Bonitz, Phys. Plasmas15, 040701 (2008).
[64] A. Melzer, M. Klindworth and A. Piel, Phys. Rev. Lett.87, 115002 (2001).
[65] A. Melzer, Phys. Rev. E67, 016411 (2003).
[66] C. Henning, K. Fujioka, P. Ludwig, A. Piel, A. Melzer and M. Bonitz, Phys. Rev. Lett.101, 045002 (2008).
[67] S. K¨ading and A. Melzer, Phys. Plasmas13, 090701 (2006). [68] M. Kroll, S. Harms, D. Block and A. Piel, Phys. Plasmas
15, 063703 (2008).
[69] T. Antonova, B.M. Annaratone, D.D. Goldbeck, V. Yaroshenko, H.M. Thomas and G.E. Morfill, Phys. Rev. Lett.96, 115001 (2006).
[70] V.V. Yaroshenko, B.M. Annaratone, T. Antonova, H. Thomas and G. Morfill, New J. Phys.8, 203 (2006). [71] T. Antonova, B. Annaratone, H. Thomas and G. Morfill,
New J. Phys.10, 043028 (2008).
[72] H. K¨ahlert, P. Ludwig, H. Baumgartner, M. Bonitz, A. Piel, D. Block and A. Melzer, Phys. Rev. E78, 036408 (2008). [73] G. Morfill, B.M. Annaratone, P. Bryant, A.V. Ivlev, H.M.
Thomas, M. Zuzic and V.E. Fortov, Plasma Phys. Control. Fusion44, 263 (2002).
[74] V.E. Fortov, A.V. Ivlev, S.A. Khrapak, A.G. Khrapak and G.E. Morfill, Phys. Rep.421, 1 (2005).
[75] M. Bonitz, P. Ludwig, H. Baumgartner, C. Henning, A. Filinov, D. Block, O. Arp, A. Piel, S. K¨ading, Y. Ivanov


![Fig. 7(a) Arrangement of the cameras and the laser illuminationfor stereoscopic measurements (from [62])](https://thumb-us.123doks.com/thumbv2/123dok_us/8444825.1702799/6.595.330.514.78.375/fig-arrangement-cameras-laser-illuminationfor-stereoscopic-measurements.webp)

