© Universiti Tun Hussein Onn Malaysia Publisher’s Office
IJIE
Journal homepage: http://penerbit.uthm.edu.my/ojs/index.php/ijie
The International
Journal of
Integrated
Engineering
ISSN : 2229-838X e-ISSN : 2600-7916
Spectrogram Based Window Selection for the Detection of
Voltage Variation
Weihown Tee
1, M.R. Yusoff
2, A.R. Abdullah
1,*, M.H. Jopri
2, N.S.N. Anwar
1, H.
Musa
31Fakulti Kejuruteraan Elektrik
Universiti Teknikal Malaysia Melaka, MALAYSIA. 2Fakulti Teknologi Kejuruteraan
Universiti Teknikal Malaysia Melaka, MALAYSIA. 3Fakulti Pengurusan Teknologi dan Teknousahawanan
Universiti Teknikal Malaysia Melaka, MALAYSIA.
*Corresponding Author
DOI: https://doi.org/10.30880/ijie.2019.11.03.025
Received 7 August 2019; accepted 19 August 2019, available online 31 August 2019
1. Introduction
With the expanding usage of high-tech machinery in power systems, power quality (PQ) disturbances are becoming a challenging research for engineers [1]. The disturbances stated include voltage sag, swell, interruption, harmonic, transient and so on [2]–[4]. These may lead to malfunctions, reduced lifetime and failure of equipment in the industry. To determine and reduce PQ in the industry, the characteristics of these disturbances should be analyzed and classified properly [4]–[6]. In this paper, the PQ disturbances focused are the voltage variations, which consist of voltage sag, swell and interruption.
The main requirement in PQ study is the ability to perform data analysis. Signal processing is an important step to analyze the signals [7]–[9]. There are several techniques for analyzing signals. The most widely used in signal processing is spectral analysis using Fourier Transform but due to the non-stationary nature of PQ, this technique is not effective in detecting the disturbances [10], [11]. There are some other time-frequency distribution (TFD) techniques such as Spectrogram, Wavelet transform, Gabor Transform, S-Transform and so on [12]–[16] . In this study,
Abstract: This paper presents the application of spectrogram with K-nearest neighbors (KNN) and Support Vector Machine (SVM) for window selection and voltage variation classification. The voltage variation signals such as voltage sag, swell and interruption are simulated in Matlab and analyzed in spectrogram with different windows which are 256, 512 and 1024. The variations analyzed by spectrogram are displayed in time-frequency representation (TFR) and voltage per unit (PU) graphs. The parameters are calculated from the TFR obtained and be used as inputs for KNN and SVM classifiers. The signals obtained are then added with noise (0SNR and 20SNR) and used in classification. The tested data contain voltage variation signals obtained using the mathematical models simulated in Matlab and the signals added with noise. Classification accuracy of each window by each classifier is obtained and compared along with the TFR and voltage PU graphs to select the best window to be used to analyze the best window to be used to analyze the voltage variation signals in spectrogram. The results showed window 1024 is more suitable to be used.
spectrogram with several windows will be applied for analyzing voltage variation signals by distinguishing the signals obtained in time and frequency domain. Window selection will be focused after the signals are analyzed.
Several methods have been proposed for classification of PQ events [17]. The classification of three types of voltage variations are tested to identify the best classification. K-Nearest Neighbors Algorithm (KNN) as well as Support Vector Machine (SVM) are used as classifiers in this study. KNN is a non-parametric method to assign weight to the contributions of the neighbors, so that the closer neighbors attribute more to the average than the further ones [18], [19].SVM is a supervised learning models that analyses data which build a model that appoints new patterns to one category, making it a non-probabilistic binary linear classifier [5], [20].
To summarize, this paper shows the windows selection and classification of the voltage variation signals by using spectrogram. First the work handles with TFD analysis of 3 windows which are 256, 512 and 1024 by using the variations simulated in Matlab. Next, the paper describes the TFR and voltage per-unit graphs of each window. Finally, the performance of KNN and SVM classification of each window will be compared and best window will be selected.
2.
Research Method
In this paper, the voltage variation signals will be simulated in Matlab. The simulated signals will then be analyzed in time-frequency distribution (TFD) of different windows and voltage variation parameters will be extracted. The extracted parameters will be used in the classification.
2.1
Voltage variation signals
Voltage variation signals are complicated, and it is tough to obtain them. Research workers usually use software to simulate the signals interested and sample the signals produced [21]. In this research 3 types of voltage variation were simulated in Matlab R2016a. The simulated samples were then analyzed by the spectrogram. The equations used to simulate each signal are as shown in Table 1. The amplitude (A) used is 230V, the fundamental frequency (f) is 50 Hz and a(t) is a step function.
Table 1 - Mathematical model of PQ disturbances.
Disturbances Equation Controlling
Parameter
Pure Sine a t Asin wt w 2f
Sag a t A(1
u t t 1 u t t2
)sin wt 2 1
0.1 0.9; – 9 ;
x
T t t T
Swell a t A(1
u t t 1 u t t2
)sin wt 2 1
0.1 0.9; – 9 ;
x
T t t T
Interruption a t A(1
u t t 1 u t t2
)sin wt 2 1
0.9 1; – 9 ;
x
T t t T
a(t) = PQ signal, A = Amplitude (constant), w = angular frequency, t = time,
= time duration of event occurrence (constant), T = time duration
2.2
Time-frequency distribution (TFD)
The spectrogram is a mathematical tool used to stimulate an analytical signal from a real-time signal obtained from data collection [12], [22], [23]. It involves a composition between frequency and time resolution [24]. It is one of the time-frequency distributions (TFDs) that describes the signal in time and frequency representations. It enumerates square magnitude of STFT [25]. The equation can be expressed as:
2 2
( , ) ( ) ( ) j f
S t f x t e d
(1)where x(τ) is the input signal and w(τ) is the observation window.
2.3
Voltage variation parameters
The parameters of the voltage variation signals can be estimated from their time-frequency representation (TFR) to identify their characteristics [22], [31]. The parameters used in this study will be the RMS voltage, Vrms, and power measurement [32]. Vrms can be derived from the TFR obtained and can be expressed as:
max
0
( ) f ( , )
rms x
V t
P t f df (2)where Px(t,f) is the time-frequency distribution (TFD), fmax is the maximum interest frequency. The power equation can be expressed as:
0
1
( ) ( )
T
t
P v t i t dt
T
(3)2.4
Classification
The parameters of the voltage variation signals obtained using different window sizes of the spectrogram are given as input to KNN and SVM for classification purpose. K-nearest neighbors (KNN) is a non-parametric prediction algorithm [19], [33]. It searches the most similar feature vectors within the historical database to predict future values. The model has simple structure and high computation efficiency where best k value is selected (k =3) [34]. Support Vector Machine (SVM) is a discriminative classifier that creates a model which can favorably anticipate the class label of data instance [35]. Numbers of kernel functions are available while Gaussian RBF kernel is proved to be the suitable kernel functions for this purpose [33]. Gaussian Radial Basis Function (RBF) kernel is used in this paper. The equation of k for RBF is given as:
2
2
( , ) exp
2
x y k x y
(4)
where ||x-y||2 is the squared Euclidean distance between the two feature vectors, is a free parameter.
Cross-validation is a model validation technique for computing the results of statistical analysis and for generalizing to an independent data set [36]. In this paper, k-fold cross-validation is used. The original sample is randomly partitioned into k equal sized subsamples (k = 4 in this paper). From the k subsamples, a single subsample is preserved as the affirmation data for testing the model [37]. Then the remaining k-1 subsamples will be used as training data. This process is repeated k times, with each of the subsamples will be used as the affirmation data. The k results from the folds will be then moderated to produce a single estimation [38].
3.
Results and Discussion
In this research, the fundamental frequency set was 50Hz while the sampling rate was 12kHz. The signals were generated from the mathematical models and then analyzed by using spectrogram. Fig. 1 shows the voltage waveforms (pure sine, swell, sag and interruption) produced by using the mathematical models.
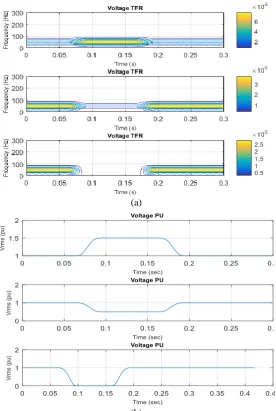
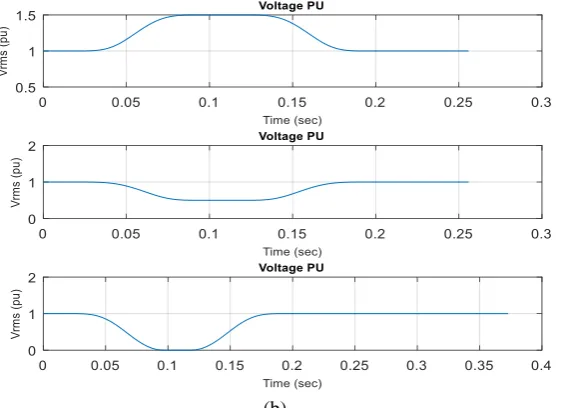
The signals generated were then analyzed by using the spectrogram with different windows (256, 512 and 1024). Fig.2, Fig.3 and Fig.4 show the voltage variation signals analyzed by using spectrogram with windows 256, 512 and 1024 respectively. The variations occurred in the time-frequency representation during 0.1 to 0.2 seconds. The highest power was presented in yellow color, while blue color represented lowest power. During voltage swell, there was an increase in power magnitude from 0.1 to 0.2s. During voltage sag, there was a sudden decrease in power magnitude from normal magnitude in between 0.1 to 0.2s. There was a sudden halt where no any power magnitude in between 0.1 to 0.2s during the occurrence of voltage interruption. The voltage per-unit (PU) graphs were directly related to the variations. During voltage swell, there was an increase in power and thus voltage PU was increased as well during the period 0.1 to 0.2s. During the occurrence of voltage sag, the voltage PU decreased as the magnitude of voltage dropped in between 0.1 to 0.2s. In voltage interruption, there was a halt in between 0.1 to 0.2s indicated no voltage was supplied during the period, so the voltage PU dropped to 0 Vrms in 0.1s and back to normal to 1 Vrms in 0.2s.
TFR of spectrogram by using window 256 could not show the proper frequency used. There were many sidelobes in voltage PU which showed less accurate Vrms reading. TFR of spectrogram by using window 512 showed an insufficient of scaling presentation of frequency used in TFR. The presentation was incomplete during voltage interruption, where the spectrogram was unable to present the complete TFR. The voltage PU graphs presented by using window 512 showed better graphs than window 256 as the graphs displayed in window 512 were smoother without sidelobes compared to windows 256. Spectrogram using window 1024 showed a complete presentation of TFR where the high and low power magnitudes could be identified well along with the presentation of the frequency. The voltage PU graphs displayed using window 1024 showed complete graphs without sidelobes as well.
(a)
(b)
(a)
(b)
Fig. 3 - (a) TFR graph by using window 512, (b) Voltage PU graph by using window 512.
(b)
Fig. 4 - (a) TFR graph by using window 1024, (b) Voltage PU graph by using window 1024.
Parameters such as RMS voltage and power were calculated from the signals generated by spectrogram. These quantities of different windows were set as input features of the classification. Noises were then being added into the variation signals. KNN and SVM were applied to get the accuracy of the data as shown in Table 2.
Table 2 - Classification results of different windows using KNN and SVM
Each classifier was trained with input samples with and without noise in Matlab. White noise SNR values of 0 and 20 were simulated to test the classification accuracy. It can be seen from Table 2 that the output of the KNN and SVM classifiers are the highest in window 1024 compared to window 256 and 512. The highest recognition accuracy among the three windows is 1024 window. For the best accuracy of each classifier, the highest accuracy of 100% in 20 SNR, 92% in 0 SNR and 100% in normal signal of KNN as well as the highest accuracy of 100% in 20 SNR, 94% in 0 SNR and 100% in normal signal of SVM respectively, are obtained from window 1024.
4.
Conclusion
In this paper, an attempt has been proposed to select the suitable window in spectrogram to analyze voltage variations in TFR and to classify the variation signals using KNN and SVM. Window 1024 shows best time-frequency representation as well as voltage per unit graphs with proper information in terms of frequency and magnitude out of window 256 and 512. Compared to window 256 and 512, window 1024 shows the best classification accuracy in both KNN and SVM in signal with and without noise. So, window 1024 is the most suitable window to be used in this case compared to window 256 and 512.
Acknowledgement
The author would like to thank Fakulti Kejuruteraan Elektrik of Universiti Teknikal Malaysia Melaka (UTeM) for providing the research grant PJP/2017/FKE/HI14/S01544 for this research.
Window Classifier
Accuracy (%) Without
Noise
0 SNR
20 SNR
256 KNN
SVM
100 100
94 92
98 97
512 KNN
SVM
100 100
90 96
98 98
1024 KNN
SVM
100 100
92 94
References
[1] Styvaktakis, E., Bollen, M. H., & Gu, I. Y. (2002). Expert system for classification and analysis of power system events. IEEE Transactions on Power Delivery, 17(2), 423-428.
[2] Lotfifard, S., Kezunovic, M., & Mousavi, M. J. (2011). Voltage sag data utilization for distribution fault location. IEEE Transactions on Power Delivery, 26(2), 1239-1246.
[3] Nagata, E. A., Ferreira, D. D., Duque, C. A., & Cequeira, A. S. (2018). Voltage sag and swell detection and segmentation based on Independent Component Analysis. Electric Power Systems Research, 155, 274-280. [4] Bollen, M. H. (2000). Understanding power quality problems. In Voltage sags and Interruptions. IEEE press. [5] Lin, W. M., Wu, C. H., Lin, C. H., & Cheng, F. S. (2008). Detection and classification of multiple power-quality
disturbances with wavelet multiclass SVM. IEEE transactions on power delivery, 23(4), 2575-2582.
[6] Smith, J. C., Hensley, G., & Ray, L. (1995). IEEE recommended practice for monitoring electric power quality. IEEE Std, 1159-1995.
[7] Ribeiro, M. V., Romano, J. M., & Duque, C. A. (2004). An improved method for signal processing and compression in power quality evaluation. IEEE Transactions on Power Delivery, 19(2), 464-471.
[8] Bollen, M. H., & Gu, I. Y. (2006). Signal processing of power quality disturbances (Vol. 30). John Wiley & Sons. [9] Champagne, B. Discrete time signal processing: Class Notes for the Course ECSE-412. Chapter, 9, 166-199. [10] Smith, S.W. (1997). The complex Fourier transform. Chapter 31 in. The scientist and engineer's guide to digital
signal processing, 1997-2007.
[11] Smith, S.W.(2003), Fourier transform properties. in Digital Signal Processing, 185–208.
[12] Abdullah, A. R., Ahmad, N. S., Bahari, N., Manap, M., Jidin, A., & Jopri, M. H. (2013, October). Short-circuit switches fault analysis of voltage source inverter using spectrogram. In 2013 International Conference on Electrical Machines and Systems (ICEMS) (pp. 1808-1813). IEEE.
[13] Sifuzzaman, M., Islam, M. R., & Ali, M. Z. (2009). Application of wavelet transform and its advantages compared to Fourier transform.
[14] Qian, S., & Chen, D. (1993). Discrete gabor transform. IEEE transactions on signal processing, 41(7), 2429-2438. [15] Yao, J., Krolak, P., & Steele, C. (1995). The generalized Gabor transform. IEEE Transactions on image
processing, 4(7), 978-988.
[16] Huda, N. H. T., Abdullah, A. R., & Jopri, M. H. (2013, June). Power quality signals detection using S-transform. In 2013 IEEE 7th International Power Engineering and Optimization Conference (PEOCO) (pp. 552-557). IEEE. [17] Tsoumakas, G., & Katakis, I. (2007). Multi-label classification: An overview. International Journal of Data
Warehousing and Mining (IJDWM), 3(3), 1-13.
[18] Lathia, N., Hailes, S., & Capra, L. (2008, October). kNN CF: a temporal social network. In Proceedings of the 2008 ACM conference on Recommender systems (pp. 227-234). ACM.
[19] Min, R., Stanley, D. A., Yuan, Z., Bonner, A., & Zhang, Z. (2009, December). A deep non-linear feature mapping for large-margin knn classification. In 2009 Ninth IEEE International Conference on Data Mining (pp. 357-366). IEEE.
[20] De Yong, D., Bhowmik, S., & Magnago, F. (2014, June). Sistema de deteccion de eventos de calidad de energía basado en Maquinas de Vectores de Soporte. In 2014 IEEE Biennial Congress of Argentina (ARGENCON) (pp. 108-113). IEEE.
[21] Khokhar, S., Zin, A. M., Mokhtar, A. S., & Ismail, N. A. M. (2014, October). MATLAB/Simulink based modeling and simulation of power quality disturbances. In 2014 IEEE Conference on Energy Conversion (CENCON) (pp. 445-450). IEEE.
[22] Abdullah, A. R., Jopri, M. H., Manap, M., & Yusoff, M. R. (2017). An Improved Spectrogram to Identify Multiple Harmonic Sources in Distribution System with Inverter Loads. In Proceedings of the International MultiConference of Engineers and Computer Scientists (Vol. 2).
[23] Jopri, M. H., Abidullah, N. A., Peng, G. Z., & Abdullah, A. R. (2014). A new two points method for identify dominant harmonic disturbance using frequency and phase spectrogram. Int. Rev. Electr. Eng, 9(2), 453-459. [24] J Jopri, M. H., Abdullah, A. R., Manap, M., Yusoff, M. R., Sutikno, T., & Habban, M. F. (2017). An improved
detection and classification technique of harmonic signals in power distribution by utilizing spectrogram. International Journal of Electrical and Computer Engineering, 7(1), 12.
[25] Stanković, L. (2015). On the STFT inversion redundancy. IEEE Transactions on Circuits and Systems II: Express Briefs, 63(3), 284-288.
[26] Abdullah, A. R., Sha'ameri, A. Z., & Saad, N. M. (2007, December). Power quality analysis using spectrogram and gabor transformation. In 2007 Asia-Pacific Conference on Applied Electromagnetics (pp. 1-5). IEEE.
[27] Abdullah, A. R., & Sha'ameri, A. Z. (2011). Power quality analysis using bilinear time-frequency distributions. EURASIP Journal on Advances in Signal Processing, 2010(1), 837360.
[29] A. J. and Abdullah, M. H. J. A. R., Ahmad, N. S., Bahari, N., Manap, M. Short-circuit analysis of voltage source inverter using spectrogram. J. Int. Conf. Electr. Mach Syst. Volume 3, (2014), pp.190-199.
[30] Ahmad, N. H. T., Abdullah, A. R., Abidullah, N. A., & Jopri, M. H. (2014). Analysis of power qualitY disturbances using spectrogram and S-Transform. Int. Rev. Electr. Eng, 9.
[31]Bollen, M. H., & Gu, I. Y. (2006). Signal processing of power quality disturbances (Vol. 30). John Wiley & Sons. [32] Jopri, M. H., Abdullah, A. R., Sutikno, T., Manap, M., & Yusoff, M. R. (2017). A utilisation of improved Gabor
transform for harmonic signals detection and classification analysis. International Journal of Electrical and Computer Engineering, 7(1), 21.
[33] Zhang, H., Berg, A. C., Maire, M., & Malik, J. (2006, June). SVM-KNN: Discriminative nearest neighbor classification for visual category recognition. In 2006 IEEE Computer Society Conference on Computer Vision and Pattern Recognition (CVPR'06) (Vol. 2, pp. 2126-2136). IEEE.
[34] Grčar, M., Fortuna, B., Mladenič, D., & Grobelnik, M. (2006). kNN versus SVM in the collaborative filtering framework. In Data Science and Classification (pp. 251-260). Springer, Berlin, Heidelberg.
[35] Jakkula, V. (2006). Tutorial on support vector machine (svm). School of EECS, Washington State University, 37. [36] Tickle, I. J., Laskowski, R. A., & Moss, D. S. (2000). Rfree and the Rfree ratio. II. Calculation of the expected
values and variances of cross-validation statistics in macromolecular least-squares refinement. Acta Crystallographica Section D: Biological Crystallography, 56(4), 442-450.
[37] Kim, J. H. (2009). Estimating classification error rate: Repeated cross-validation, repeated hold-out and bootstrap. Computational statistics & data analysis, 53(11), 3735-3745.