Effect of Tensile Direction on Microstructure
Evolution of SAC305 Solder Wire
Izhan Abdullah1, Azman Jalar 1∗, Roslina Ismai2, Maria Abu Bakar1, Muhammad Nubli Zulkifli 3
and Emee Marina Salleh1
1Institute of Microengineering and Nanoelectronic (IMEN), Universiti Kebangsaan Malaysia (UKM) 2Division of Fine Arts, Culture Centre, University of Malaya (UM)
3Electrical Section, International College, British Malaysian Institute,
Universiti Kuala Lumpur (UniKL)
The mechanical characterization of Sn-3.0Ag-0.5Cu (SAC305) solder wire without flux under different strain rates and temperature was performed through bulk tensile test. Grain size analysis was used to study the microstructural behavior of solder material under varied tensile strain rates and temperatures. The SAC305 solder wire microstructures were examined using the infinite focus microscope (IFM) and the average grain size was measured using standard line intercept techniques (ASTM E112-13) after tensile test with different strain rates and temperatures. Microstructural analysis showed that the grain size was decreased with increasing strain rates while the grain size was increased with increasing temperature. The result also showed that grain refinement caused higher yield strength, tensile strength and hardness. The grain coarsening was the factor for the decrement of yield strength and tensile strength. The measured grain aspect ratio was ranging from1.11 to 1.26 that could be represented as equiaxed grains. The value of the activation energy for the grain movement in the tensile direction is 1.6 kJmol-1 to 37.6 kJmol-1. This study of
microstructure behavior from the bulk tensile test of SAC305 solder wire has revealed the relationship of microstructure-properties with mechanical properties from the tensile test.
Keywords: SnAgCu; grain size; grain aspect ratio; activation energy; tensile test
I. INTRODUCTION
In recent years, SnAgCu (SAC) solder is widely commercialized and used as a solder joint in the semiconductor industry. However, the demand on miniaturization of devices is challenged in determining the actual characterization of the solder structure (Pang & Xiong, 2005; Wiese et al., 2008; Ismail et al., 2018). Specific material tests are needed to evaluate the material characterization of Pb-free solder in small scale with different shapes in different mechanical tests such as nanoindentation (Abu Bakar et al.,
2016) and tensile test (Abdullah et al., 2018). In mechanical characterization on SAC solder wire, the load-bearing in solder application such as strain and temperature would create deformation in localization after a long period (Pang, 2008). The grain formation also played the main role in constituent material and their microstructure. Thus, the detailed
knowledge of mechanical solder behavior correlates with mechanical properties as well as in-situ tensile test (Chen
et al., 2011). The reliability of solder joints are closely governed by the mechanical properties of its properties on solder joints and is crucial in electronic manufacturing to ensure a good process yield and reliable products for long-term applications.
Previous research by Che et al., (2010) showed that the Sn-1.0Ag-0.5Cu (SAC105) dog bone sample was used to conduct a tensile test with temperature load. It was discovered that yield strength of SAC105solder was decreased and the microstructure changed their shape and dimension with the increase in temperature (Che et al.,
creates dislocation among the grains. High activation energy level could influence the mechanism of deformation and would give a small resistance to ductility in SAC of solder material due to high creep resistance. Shohji et al., (2004) observed that Sn-55Pb have large activation energy values compared to Sn-3.5Ag and it is noticed that high activation energy level materials could self-diffuse in the microstructure. El-daly et al., (2014) also observed the increase of activation energy on grain boundaries of SAC305 solder joint is due to self-diffusion on grains.
For the present study, activation energy on deformation was determined at low and high strain rates of tensile test to correlate the microstructure evolution and mechanical properties of SAC305 solder wire. In this work, two variants of strain rates i.e. low and high rates were performed on this specimen to observe the microstructure effect in the application of tensile temperature. This paper will also discuss the mechanism that influences the activation energy on SAC305 grain size effect by tensile test.
II. MATERIALS AND METHOD
The 96.5Sn/3.0Ag/0.5Cu (SAC305) solder wire without flux with 2 mm diameter was acquired from solder material manufacturer, RedRing Solder (M) Sdn. Bhd. and was used as the specimen. The selected SAC305 solder wire was cut into 100 mm of lengths and a gauge length of 50 mm based on ASTM-E8 standard. The acrylic tapes were attached within 25 mm of each end to lessen the deformation imposed by tensile gripper during the tensile test. The tensile test was performed using INSTRON universal test machine (UTM) in a thermal chamber by configuring two crosshead speed (ẋ) of the tensile machine (1.5 x 10⁻⁵ ms-1 and 1.5 x 10⁻² ms-1) within variant
temperatures of room temperature of 25 C, 50 C, 100 C, 150
C and 200 C respectively. The unit of crosshead speed is
meter per second (ms-1) and tensile load is 1 kN. The crosshead
speed of tensile was converted into strain rate (ἐ) by equation (1), where ẋ is the crosshead speed of tensile and l represents the length of SAC305 solder wire specimen of 100 mm:
𝜀̇ =𝑥̇
𝑙 (1)
By applying equation (1), the strain rate of 1.5 x 10⁻⁴ s-1 and 1.5
x 10-1 s-1 were acquired. After the tensile test was performed,
the specimens were cooled down for grain formation stability before metallography experimental work. The raw tensile
results were generated to obtain the engineering stress-strain values for the analysis of their mechanical properties related to microstructure grain mechanism.
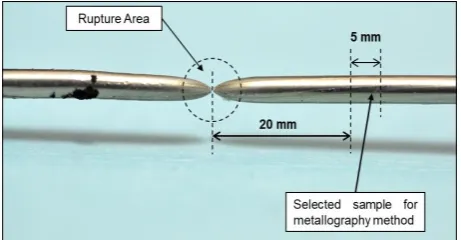
For the microstructure study, these samples were selected and cut into 5 mm of length from the final elongation (Figure 1). Those specimens were then cold-mounted using resin and hardness for epoxy later and left for a few hours. The epoxy consists of one part of hardness and ten parts of resin. After cold mounted, SAC305 samples were ground at the center of the solder wire through a series of silicon carbide abrasive papers with increasing fine mesh grit of 240, 400, 600, 1200, 2400 followed by drying with blower. Finally, the polished samples were exposed to diamond spray to 3 µm, 1 µm and 0.25 µm diameters to eliminate the fine residue or scratches on the solder surface. The polished samples were then etched by a solution consisting of 5% hydrochloric acid (HCL) and 95% methanol for 10 seconds and rinsed with deionized water (DI) for revelation of the microstructure clearly.
Figure 1. The ruptured sample of SAC305 solder wire after tensile test using metallography method
𝐷 = 𝐷𝑜𝑒(−𝐸𝑎/𝑅𝑇) (2)
III. RESULTS AND DISCUSSION
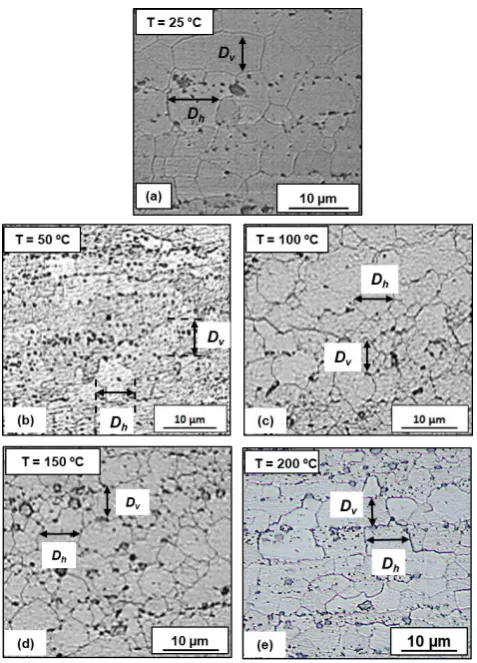
Microstructure examination was performed to evaluate the effect of the microstructure evolution towards the bulk mechanical test i.e. tensile test of SAC305 solder wire. SAC305 solder wire microstructure was evaluated by measuring the grain size and grain aspect ratio based on ASTM E112 standard. Figures 2 and 3 show micrographs of SAC305 solder wire microstructures for increasing temperatures at strain rates of 1.5 x 10⁻⁴ s-1 and 1.5 x 10⁻¹ s-1 in the scale 10 µm. Figure
2 and Figure 3 show the Dh representing the grain size intercept in tensile test direction while Dv representing the grain size in the perpendicular direction. In Figures 2 and 3, it is depicted that
the small precipitates i.e Ag3Sn (dark grey) were revealed and
distributed randomly and located near to the grain boundaries. However, the application of elevated temperatures to 200 °C and increase to 1.5 x 10⁻¹ s-1 have
induced the possession of Ag3Sn which affects the mechanical
behavior of SAC305 solder wire.
Figure 2. Micrograph of SAC305 solder wire with tensile test temperatures of (a) 25°C, (b) 50 °C, (c) 100 °C, (d) 150 °C and (e) 200 °C at a strain rate of 1.5 x
10-4 s-1
Figure 3. Micrograph of SAC305 solder wire with tensile test temperatures of (a) 25°C, (b) 50 °C, (c) 100 °C, (d) 150 °C and (e) 200 °C at a strain rate of 1.5 × 10⁻¹ s-1
The elevated temperature of the tensile test to SAC305 solder wire has enlarged the grain size or boundaries in the tensile direction (Dh) due to the recrystallization process and this would decrease the flow stress. In addition, the increase of tensile strain rates of 1.5 x 10⁻⁴ s-1 to 1.5 x 10⁻¹ s -1 has reduced the grain size and boundaries and this would
increase the flow stress. It is known Ag3Sn has high
mechanical properties such as strength and hardness compared to Sn matrix which acts as a resistant to the flow stress (Sun et al., 2007). Therefore, the increment and reduction of grain size and boundaries have caused the increment and reduction of flow stress.
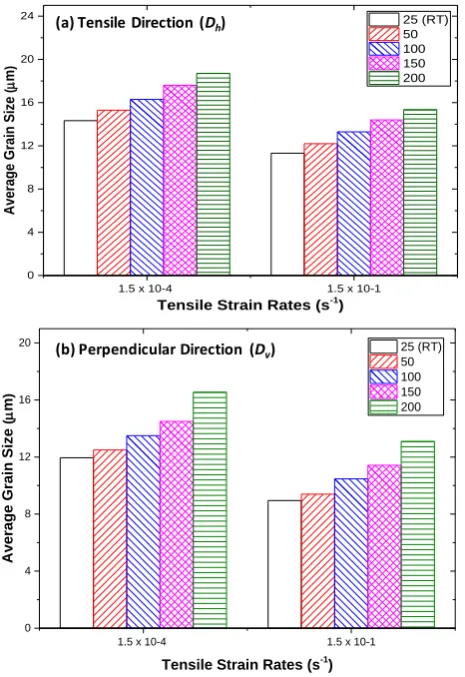
1. Grain size effect on tensile strain rate and temperatures
direction (Dv) are increased with tensile temperatures elevation at the same strain rates. As can be seen, the increment of Dh is faster compared to Dv due to the applied pull stress of the
tensile test and is in the same direction with Dh. In addition, the increment of the grain size due to increasing temperatures at the same strain rate also decreases the mechanical properties (strength, modulus and hardness) and is in accordance to the Hall-Petch relationship in previous studies (Pereira et al., 2013; Tsao et al., 2012), where the increment of grain size decreases the yield strength of this solder material while the reduction of grain size would decrease the yield strength, respectively. The reduction of grain size would lead to grain refinement (Pereira
et al., 2013). It is also observed that both grain size directions are decreased with increasing tensile strain rate at the same tensile temperatures as shown in Figure 4.
Figure 4. Variation of average grain sizes of SAC305 solder wires of a) tensile direction, Dh and b) perpendicular direction, Dv
This trend is opposite to the tensile temperature at the same tensile strain rate where it has increased the grain refinement and dislocation density of SAC305 solder wire. This incident is known as strain hardening of the SAC305 solder wire material which causes an increase in the value of both strengths. Thus,
it has been shown that the grain refinement with high strain hardening improved the mechanical properties of solder wire especially the strength properties that occur in this solder wire structure and this has been discussed in previous studies (Abdullah et al., 2017).
Table 1 shows the variation of the grain aspect ratio of SAC305 solder wire with different tensile temperatures and strain rates. Equation (2) was used to measure the grain aspect ratio as illustrated in Table 1.
𝐴𝑅𝐷𝑛=𝐷𝐷ℎ
𝑣 (3)
In Table 1, it is noted that the grain aspect ratio of all samples of SAC305 solder wires ranging from 1.11 to 1.26. Milner et al., (2013) has reported that the changes of grain aspect ratio can be used to identify the grain formation during deformation phenomenon on the grain structure of metal or alloy. It has been reported that grain aspect ratios lower than 1.50 represent equiaxed grain structure, whereas grain aspect ratios ranging from 1.50 to 3.40 represent elongated grain structure. The refinement grain value is 11.3 µm. With temperature increase, the grain is coarsening to 18.9 µm at 200 °C and dimension of grain does not change to elongation. The adiabatic temperature was dominant to refinement and coarsening of grains which influenced their activation energy measurement (Shi et al., 2014). This indicates that SAC305 solder wire microstructure maintained the equiaxed structure even after the application of different strain rates and temperatures of the tensile test.
Table 1. The grain aspect ratio of SAC305 solder wires with
different strain rates and temperatures
Tensile Temperature (°C) Grain Aspect Ratio From Strain Rate 1.5 x 10⁻⁴ s-1
Grain Aspect Ratio From Strain Rate 1.5 x 10⁻¹ s-1
25 (RT) 1.20 1.26
50 1.13 1.17
100 1.12 1.16
150 1.11 1.17
200 1.15 1.14
2. Activation Energy of Grain Size Effect
Figure 5 shows the slope graph of ln D versus 1/T and Figure 6 shows the results of the activation energy of SAC305 solder wire focused to the grain size effect during
1.5 x 10⁻⁴ 1.5 x 10⁻¹
0 4 8 12 16 20 24 Averag
e Grain Siz
e
(
m
)
Tensile Strain Rates (s-1)
25 (RT) 50 100 150 200
1.5 x 10⁻⁴ 1.5 x 10⁻¹
0 4 8 12 16 20 Averag
e Grain Siz
e
(
m
)
Tensile Strain Rates (s-1 ) 25 (RT) 50 100 150 200
(a) Tensile Direction (Dh)
tensile application based on equation (2). In Figure 5, it is indicated the value of ln (D - Do) is plotted against 1 / T and the slope of the graph is represented by - (Ea / R) using equation (3). Subsequently, the activation energy is obtained when multiplying the slope value with the gas constant (R) and also the value of 1000 corresponding to the analysis of the residual size change after the tensile test.
ln(𝐷) = ln(𝐷𝑜) − ( 𝐸𝑎
𝑅) . ( 1
𝑇) (4)
In Figure 6, the values of the activation energy of grain in the tensile direction is low because of the change of grain size in the perpendicular direction is low. The relationship between microstructural evolution in tensile direction and perpendicular direction with activation energy is clearly indicated in Figure 6 and Figure 4. The activation energy for grain size changes for the perpendicular direction. However, for the tensile direction, the activation energy depends on the tensile strain rate. For high strain rates, 1.5 × 10⁻¹ s-1, the value
is 37.58 kJmol-1 and for low strain rates, 1.5 × 10⁻⁴ s-1, the value
is 1.6 kJmol-1. However, at a low strain rate of 1.5 × 10⁻⁴ s-1, the
grains do not require a large force for the movements of the grain, especially in the diffusion process. The range of values are energies estimated indicating that the rate-controlling mechanism is diffusion to grain boundary slide which is similar to previous studies (El-Rahim, 2008). The activation energy of the tensile direction increases rapidly in line with the increase in strain rate. This effect occurs because the tensile energy of the solder wire SAC305 at the strain rate of 1.5 × 10 -1 s-1 is high and also good by obtaining sufficient energy to carry
out the process of forming the grains on the orientation which is tensile direction either elongated or equiaxed structure.
(a)
(b)
Figure 5. Determination of the slope of ln D versus 1000/T on the strain rates of (a)1.5× 10⁴s1
and (b) 1.5 × 10⁻¹ s-1 obtained by grain in
tensile direction and perpendicular direction
Figure 6. Tensile direction effect in activation energy of SAC305 solder wire grain size during tensile test with low and high tensile strain rates
From the bulk analysis, the activation energy obtained from this analysis is small compared to the activation energy of Sn-rich through self-diffusion which is approximated to be 100 kJmol-1 - 130 kJmol-1 (Zhu et al.,
2009). However, Saud & Jalar (2010) study has confirmed that activation energy for SAC solder materials is lower than non-SAC solders. The minimum value for the grain coarsening in the solder system is 13 kJmol-1. In contrast,
grain refinement requires a high activation energy value to initiate the grain movement through self-diffusion to dislocation. In addition, solder has tin-phase such as SnAg and SnCu which require enormous energy to enable coarsening of the grains. Therefore, the activation energy obtained in this study is still relevant to enable diffusion in
ln
D
ln
D
Dalong with tensile direction
grain size changes when changes in temperature and strain rate tensile test and this phenomenon is known as local diffusion (localization) as described previously.
IV. CONCLUSION
Tensile test and microstructure analysis with strain rates and
temperature effect was performed for determining the grain
size and aspect ratio. The increase in strain rates reduced the
average grain size and increase of temperatures growth the
average grain size of the SAC305 solder wire. It was observed
that higher strain rates have a pronounced effect on changing
the deformation or shape of grain in the longitudinal
direction of the activation energy which shows an increased
value with increase of strain rate. The direction of the tensile
test and strain rate play a role in the variation of activation
energy that low strain rate present low activation energy and
high strain rate present higher activation energy.
V. ACKNOWLEDGMENT
This work is supported by the Universiti Kebangsaan
Malaysia (UKM) under Research University Grants
(GUP-2018-079 and MI-2018-019) and RedRing Solder (M) Sdn
Bhd.
VI. REFERENCES
Abdullah, I, Zulkifli, MN, Jalar, A & Ismail, R 2018,
‘Deformation behavior relationship between tensile and nanoindentation tests of SAC305 lead-free solder wire’, Soldering Surface Mount Technology, vol. 30, pp. 194 -202.
Abdullah, I, Zulkifli, MN, Jalar, A & Ismail, R 2017,
‘Deformation behavior of Sn-3.0Ag-0.5Cu (SAC305) solder wire under varied tensile strain rates’, Soldering Surface Mount Technology, vol. 29, pp. 110–117. Abu Bakar, M, Jalar, A, Daud, AR, Ismail, R & Saedi, N
2016, ‘Micromechanical properties of solder joint Sn3. 0Ag0. 5Cu on Electroless Nickel immersion gold (ENIG) using Nanoindentation approach’, International Journal of Advanced and Applied Sciences, vol. 3, no.2, pp. 1-5.
Che, FX, Zhu, WH, Poh, ESW, Zhang, XW & Zhang, XR 2010, ‘The study of mechanical properties of Sn–Ag–
Cu lead-free solders with different Ag contents and Ni doping under different strain rates and temperatures’,
Journal of Alloys and Compounds, vol. 507, pp. 215 –
224.
Chen, H, Wang, L, Han, J & Wu, QB 2011, ‘Grain orientation evolution and deformation behaviors in Pb-free solder interconnects under mechanical stresses’,
Journal of Electronic Materials, vol. 40, no. 12, pp. 2445-2457.
El-Rahim, AFA 2008, ‘Effect of grain size on the primary and secondary creep behavior of Sn–3 wt.% Bi alloy’, Journal of Materials Science, vol. 43, no. 4, pp. 1444-1450.
El-Daly, AA, Hammad AE, Al-Ganainy, GS & Ragab. M 2014, ‘Influence of Zn addition on the microstructure, melt properties and creep behavior of low Ag-content Sn–Ag–Cu lead-free solders’,
Materials Science and Engineering: A, vol. 608, pp. 130 – 138.
Ismail, N, Jalar, A, Abu Bakar, M & Ismail, R 2018,
‘Kesan penambahan tiubnano karbon terhadap pertumbuhan lapisan sebatian antara logam sistem pateri Sn-Ag-Cu/Cu akibat penuaan’, Sains Malaysiana, vol. 47, no. 7, pp. 1585 – 1590.
Pang, JHL & Xiong, BS 2005, ‘Mechanical properties for 95.5Sn-3.8Ag-0.7Cu lead-free solder alloy’,
IEEE Transactions on Components and Packaging Technologies, vol. 28, no. 4, pp. 830-840.
Milner, JL, Abu-Farha, F, Bunget, C, Kurfess, T & Hammond, VH 2013, ‘Grain refinement and
accumulative roll bonding’, Materials Science & Engineering A, vol. 561, pp. 109 – 117.
Pang, JHL 2008, ‘Strain-rate effects on mechanical properties for SAC387 and SAC105-Y solder’,
Proceedings of 2nd IEEE Electronics System Integration Technology Conference, 1 Sept. 2008, Greenwich, UK.
Pereira, PD, Spinelli, JE & Garcia, A 2013, ‘Combined effects of Ag content and cooling rate on microstructure and mechanical behavior of Sn–Ag–Cu solders’, Materials & Design, vol. 45, pp. 377-383.
Shohji, I, Yoshida, T, Takahashi, T & Hioki, S 2004,
‘Tensile properties of Sn–Ag based lead-free solders and strain rate sensitivity’, Materials Science and Engineering A, vol. 366, pp. 50 – 55.
Saud, N & Jalar, A. 2010, ‘Sn-rich phase coarsening during isothermal annealing for as-soldered Sn–Ag–
Cu solder’, Journal of Materials Science, vol. 21, pp. 1083 – 1089.
Shi, C, Lai, J & Chen, XG 2014, ‘Microstructural evolution and dynamic softening mechanisms of Al-Zn-Mg-Cu alloy during hot compressive deformation’, Materials, vol. 7, pp. 244-264.
Sun, Y, Liang, J, Xu, ZH, Wang, G & Li, X 2007,
‘Nanoindentation for measuring individual phase mechanical properties of lead-free solder alloy’, J. Mater. Sci. Mater. Electron., vol. 19, pp. 514–521. Tsao, LC, Huang, CH, Chung, CH & Chen, RS 2012,
‘Influence of TiO2 nanoparticles addition on the microstructural and mechanical properties of Sn0.7Cu nano-composite solder’, Materials Science and Engineering: A, vol. 545, pp. 194-200.
Wiese, S, Roellig, M, Mueller, M & Wolter, KJ 2008, ‘The effect of downscaling the dimensions of solder interconnects on their creep properties’,
Microelectronics Reliability, vol. 48, no. 6, pp. 843-850.
Zhu, QS, Wang, ZG, Wu, SD & Shang, JK 2009,
‘Enhanced rate-dependent tensile deformation in equal