Shuhaib et al. World Journal of Pharmaceutical and Life Sciences
STUDIES ON FORMULATION AND CHARACTERIZATION OF TOPICAL GEL
CONTAINING MICROSPONGES OF MEFENAMIC ACID
Shuhaib B.* and Dr. Suja C.
Department of Pharmaceutics, Crescent College of Pharmaceutical Sciences, Payangadi, Kannur, India.
Article Received on 07/12/2017 Article Revised on 28/12/2017 Article Accepted on 18/01/2018
INTRODUCTION
The microsponge drug delivery system was developed by Won in 1987. The micrsponge delivery system is patented polymeric system consisting of porous microsphere. They are tiny sponge like spherical particles that consist of myriad of inter connecting void within a non-collapsible structure through which active ingredient are released in a controlled manner. Microsphere surrounded by the vehicle acts like microscopic sponges, storing the active ingredient until its release is triggered by skin application. Microspores within the spheres are employed for extensive drug retention. Release of drug into the skin is triggered by a variety of stimuli, including rubbing and higher skin temperature than ambient one. Their high degree of cross linking results in particles that are insoluble, inert and of sufficiently strong strength to withstand the high shear commonly used in creams, lotions, and powders. The active payload is protected in the formulation by the microsponge particle: it is delivered to skin via controlled diffusion. The sustained release of activities to skin over time is an effective tool to extend the efficacy and reduce the irritation commonly associated.[1,2]
The microsponges were prepared by free radical suspension method or quassi emulsion solvent diffusion
method. Rheumatoid arthritis and osteoarthritis treated by NSAID’S. Mefenamic acid is available as oral dosage form currently in market. Oral administration this drug has adverse effects like head ache, dizziness, G I ulcer, nausea, vomiting. Hence formulation novel drug delivery system such as microsponge drug delivery system mefenamic acid will maximize the duration of drug adherence on the skin surface and overcome problem associated with conventional preparation i.e. oral dosage form. The Microsponges are prepared by several methods utilizing emulsion system as well as suspension polymerization in a liquid-liquid system. The mostcommon emulsion technique used is emulsion solvent diffusion method. It was shown that the drug: polymer ratio, stirring rate, volume of dispersed phase influenced the particle size and drug release behavior of the formed microsponges and that the presence of emulsifier was essential for microsponge formation.[3,4]
MATERIALS AND METHODS
Mefenamic acid pure drug was generously gifted by Camarin Pharmaceutical, kannur. Eudragit RS100 & Eudragit RL100 were gifted by Degussa India Pvt. Ltd, Mumbai. Ethyl cellulose was purchased from Lobachemei Mumbai. All other excipients used in our work were of Analytical grade.
World Journal of Pharmaceutical and Life Sciences
WJPLS
www.wjpls.org
SJIF Impact Factor: 4.223*Corresponding Author: Shuhaib B.
Department of Pharmaceutics, Crescent College of Pharmaceutical Sciences, Payangadi, Kannur, India.
ABSTRACT
The objective of the present investigation was formulate & characterize the microsponge of mefenamic acid, these microsponges were prepared by quassi-emulsion method. Preformulation studies by FTIR, revealed no interaction between pure drug and the different polymers used. The prepared microsponges were characterized for their production yield, drug content, mean particle size & entrapment efficiency, Effect of formulation variable were also studied. The microsponge containing 0.5 gm of poly vinyl alcohol, 0.6 gm of ethyl cellulose and 5ml ethanol good were compared to the other formulation prepared The best microsponges (M3, M6, M9) in cooperated into gel. The topical gel was evaluated for their organoleptic characters, viscosity, spreadability, drug content and drug release studies. From that MG2 Shows better compared to other formulation. The various release kinetics were studied from that gel have the drug release seems to follow zero order kinetics as it is evidenced by correlation coefficients (r2=0.9907 to 0.9658) which is better than first order (r2 = 0.970 to 0.88) in mefenamic acid microsponge gel. Drug permeation from mefenamic acid gel followed Higuchi model or matrix diffusion.
Determination of ƛ max
Dissolve accurately weighed 100mg of mefenamic acid in 100ml of methanol in 100ml standard flask to get 1000μg/ml. From the stock solution of mefenamic acid, 1ml is pipette out and diluted to 100ml with methanol to get 10μg/ml. The absorption maximum of the standard solutions of mefenamic acid was scanned between 200-400nm regions on UV-visible spectrophotometer. The absorption maxima obtained with the substance being examined corresponds in position and relative intensity to those in the reference spectrum.
Preparation of standard calibration curve of Mefenamic acid
A stock solution equivalent to 1 mg/ml mefenamic acid was prepared by dissolving 50 mg of pure methanol and diluting to 50 ml of calibrated flask with methanol. Different aliquots of 1 mg/ml mefenamic acid solution were accurately measured and transferred into series of 100 ml volumetric flask and volume made up to mark with methanol. Absorbance of the solutions was measured by UV/Visible spectrophotometer at 285 nm and the data were plotted against concentration. A calibration curve was plotted by taking concentration on x axis and absorbance on y axis.
Preformulation Studies[5]
Pre-formulation testing was an investigation of physical and chemical properties of a drug substance alone. It is the first step in rational development of dosage form.
Solubility studies
Solubility of mefenamic acid was observed in different solvent such as distilled water in acetone, methanol, 95%ethanol, sodium hydroxide, Potassium hydroxide, diethyl ether, chloroform, acetic acid.
Identification by melting point
Melting point of drug was determined using Melting point apparatus.
Organoleptic properties
Physical appearance of drug was observed and compared with the official monographs.
Partition Coefficient (KP)
The partition coefficient of the drug was determined by shaking equal volumes of organic phase (n-octanol) and the aqueous phase in a separating funnel. A drug solution of 1 mg/ml was prepared in phosphate buffer pH7.4 and 50 ml of this solution was taken in a separating funnel and shaken with an equal volume of n-octanol for 10 minutes and allowed to stand for 24 hours with intermittent shaking. Then, the concentration was determined by U V Spectra.
Drug-ExcipientInteractionStudies[6]: in order to find out the possible interactions between mefenamic acid and the polymers used in the formulation of the microsponge, Fourier transform infra-red spectroscopy (FT-IR) analysis was carried out on the pure substances and their physical mixtures.
i) FT-IR Spectra of the pure drug, ethyl cellulose, eudragit RS 100, eudragit RL 100 and the physical mixture of the drug with polymers were taken individually by KBr pellet technique between 600 to4000 cm-1. This is to ensure that there is no incompatibility between the drug and the polymers. Once spectra were recorded, the peaks of the pure drug, the polymers and the physical mixture of drug and polymers were compared for any incompatibility.
Formulation Of Mefenamic Acid Loaded
Microsponges[7,8]
Microsponge were prepared by quasi-emulsion solvent diffusion method using an external phase of distilled water and polyvinyl alcohol (PVA), and internal phase consisting of drug, ethyl alcohol, polymer(ethyl cellulose, eudragit RS100 & eudragit RL 100) and Glycerol (which was added at an amount of 20% of the polymer in order to facilitate the plasticity). For preparing microsponge, the internal phase was prepared and added to the external phase at room temperature. After emulsification process is completed, the mixture was continuously stirred for 2 hours at 500 rpm. Then the microsponges were separated by filtration. The product was washed and dried under vacuum oven at 40°C for 12 hrs.
Table 1: Formulation of microsponge.
Ingredients M1 M2 M3 M4 M5 M6 M7 M8 M9
Mefanamic acid (gm) 0.2 0.2 0.2 0.2 0.2 0.2 0.2 0.2 0.2
Ethyl cellulose (gm) 0.2 0.4 0.6 - - - -
EudragitRS 100 (gm) - - - 0.2 0.4 0.6 - - -
Eudragit RL100 (gm) - - - 0.2 0.4 0.6
Polyvinyl alcohol (gm) 0.5 0.5 0.5 0.5 0.5 0.5 0.5 0.5 0.5
Ethanol (ml) 5 5 5 5 5 5 5 5 5
Distilled water (ml) 100 100 100 100 100 100 100 100 100
In this experiment and effect of different variables such as external phase volume, internal phase volume, stirring speed, and drug: polymer ratio was observed. The formed microsponges were evaluated for their physical
Formulation of Mefenamic Acid Microsponge Gel[12,13]
Accurately weighed amount of carbopol 934 P was taken and dissolved in water using propeller. Microsponge formulations containing mefenamic acid was added to the above solution with constant stirring. This final solution was neutralized slowly adding triethanolamine with constant stirring until the gel is formed.
Table 2: Formulation of Microsponge Gel.
Ingredient Quantity
Microsponge 1%w/w
Carbopol 934P 35g
Triethanolamine q.s
Sodium Benzoate 50 gm
Distilled Water 10 ml
Evaluation of Mefanamic Acid Loaded
Microsponges.[9,10,11]
a) Particle size
Particle size was determined using an optical microscope under 40X magnification. The microscope was fitted with a stage micrometer to calibrate the eyepiece micrometer.
b) Determination of Percentage yield
The percentage yield of the microsponge can be obtained by calculating accurately the initial weight of the solid raw materials and the last weight of the microsponge obtained after drying.
Percentage yield (%) = ×100
c) Drug loading efficiency
The drug content in microsponges was determined spectrophotometrically at 285nm.
A sample of mefanamic acid microsponge (10mg) was dissolved in 100 ml of solution. The drug content was expressed as actual drug content in microsponge. The loading efficiency (%) of the microsponge was calculated according to following equation.
Loading efficiency (%) =
d) Drug content
Microsponges containing100mg of drug from all batches were accurately weighed and dissolved in Methanol in 100 ml standard flask and made up to the volume.From the above solution 1ml was taken and diluted to 100ml with Methanol. Then the amount of drug was detected by UV spectrophotometric method at 285 nm.
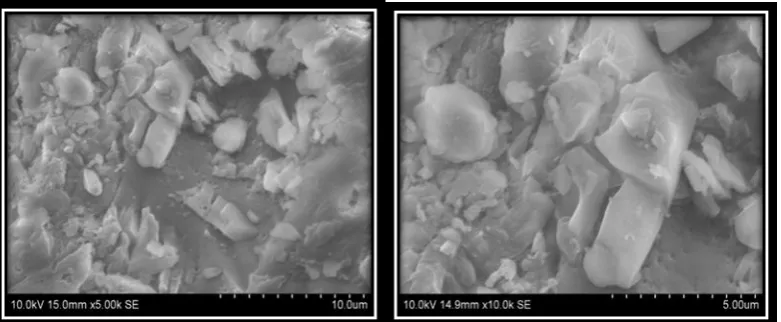
e) Surface morphology of microsponges by Scanning Electron Microscopy (SEM)
The morphology of microsponge formulation was observed by scanning electron microscope operating at 10kV.
Prepared microsponges were coated with platinum by ion sputtering using auto fine coater. The microsponges were kept on the sample holder and SEM photograph was recorded using SEM (JEOL-JSM 6390, England) under vacuum at room temperature.
Characterization Of Mefenamic Acid Microsponge Gel[14,15,16]
Gels were evaluated for their clarity, pH, viscosity, spreadability, extrudability, drug content and in vitro diffusion studies by using standard procedure
Clarity
The clarity of various formulations was determined by visual inspection under black and white background and it was graded as follows: turbid, clear, very clear
pH
1g of gel was accurately weighed and dispersed in 100 ml of distilled water. The pH of dispersion was measured by using digital pH meter.
Viscosity measurement
Brookfield digital viscometer was used to measure the viscosity (in cps) of the prepared gel formulations. The spindle number 64 was rotated at 20 rpm for the viscosity measurement.
Spreadability
Spreadability of the formulation was determined by using an apparatus designed and developed in the laboratory especially for the project. Two rectangular glass plates of standard dimension were selected 500mg of the sample was placed on one of the glass plate. Second plate was placed over the other one to sandwich sample between plates. A 20gm weight was placed on the top of upper plate to provide a uniform thin film of the sample between the plates. Weight was removed; excess of the gel sample was scrapped off from the edges. The top plate was then subjected to pull by using string to which 50gm weight was applied. The time required by the upper plate to travel a distance of 6cm and separate from the lower plate was noted. A shorter interval indicates better spreadability.
Drug content
Drug content of the gel was determined by dissolving an accurately weighed quantity of 1g gel in about 100 ml of methanol. 1ml of this solution was diluted to 10ml with methanol Solutions were then filtered and spectrophotometrically analyzed for drug content at 285nm. Drug content was determined from the standard curve of mefenamic acid.
Drug Release studies
The in vitro release of mefenamic acid microsponges
formulated gel was accurately weighed, and placed on membrane and attached to this assembly. The donor compartment was suspended in 50 ml of dissolution medium maintained at 37± 1°C so that the membrane just touched the receptor medium surface. The medium was stirred at 50 rpm using magnetic stirrer. Aliquots, each of 1ml volume, were withdrawn at hourly intervals and replaced by an equal volume of the receptor medium. The aliquots were diluted to 10ml with the receptor medium and analyzed by UV-Visible spectrophotometer at 285 nm and % cumulative drug release was calculated.
RESULT
Determination of ƛ max: Scanned in between
200-400 nm methanols as solvent maximum absorbance at 285 nm.
Standard curve of mefenamic acid
Table 3: Standard curve of mefenamic acid.
Concentration(μg/ml) Absorbance
5 0.128±0.0015
10 0.253±0.0010
15 0.378±0.0021
20 0.496±0.0020
25 0.620±0.00208
30 0.735±0.00152
Figure 1: Calibration curve of mefenamic acid.
Preformulation Studies
Solubility studies: Solubility observed different
solvents as water, acetone, methanol. Ethanol, chloroform, sodium hydroxide & it was found as mefenamic acid soluble in alkali hydroxide and 95% soluble in ethanol.
Melting point: Determined by melting point
apparatus and it was found to be 230-231°C.
Organoleptic Characters: physical appearance
observed as whitish odorless powder.
Partition coefficient: It determined in n-octanol – phosphate buffer7.4 pH.was found to be 1.87.
Drug excipient interaction studies: FT-IR studies
of pure drug sample, polymers and physical mixtures were measured.
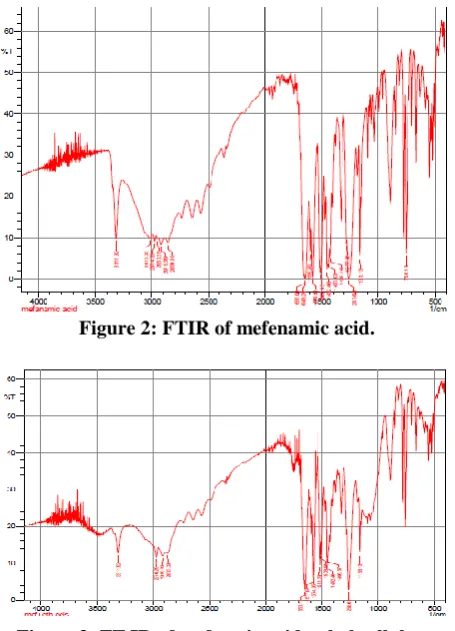
Figure 2: FTIR of mefenamic acid.
Figure 3: FT IR of mefeamic acid+ethyl cellulose.
Figure 4: FT IR of mefenamic acid+ eudragit RS 100.
Figure 6: FT IR of mefnamic acid microsponge.
• The FT-IR spectrums of pure drug, polymers and physical mixture of drug and polymers shows that no interaction took place between drug and polymer.
• Some additional peaks were observed with physical mixtures, which could be due to the presence of polymers.
• These results suggest that there is no interaction between the drug and polymers used in the study. Thus indicating that the drug and polymer are compatible with each other.
Effect Formulation Variables for the Formulation of Mefenamic Acid Microsponge
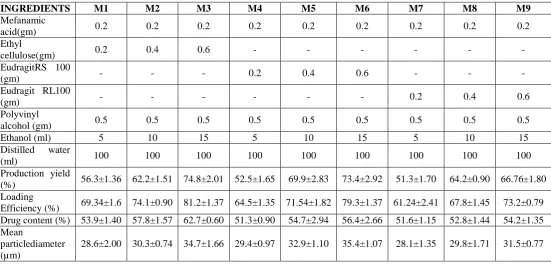
Nine microsponge formulations (M1 -M9) were prepared at 0.2, 0.4 and 0.6gm of polymers, ethanol concentration as 5,10 and 15 ml & emulsifying agents as 0.5,0.75 and 01 gm keeping all the other variables constant. The formed microsponges were then evaluated for particle size and percentage yield, loading efficiency and drug content in order to find out the optimum polymer, ethanol and emulsifying agent composition
Characterization of Microsponge
Effect of Internal phase Composition on Mefanamic acid Microsponge Table 4: Effect of internal phase on mefenamic acid microsponge.
INGREDIENTS M1 M2 M3 M4 M5 M6 M7 M8 M9
Mefanamic
acid(gm) 0.2 0.2 0.2 0.2 0.2 0.2 0.2 0.2 0.2
Ethyl
cellulose(gm) 0.2 0.4 0.6 - - - -
EudragitRS 100
(gm) - - - 0.2 0.4 0.6 - - -
Eudragit RL100
(gm) - - - 0.2 0.4 0.6
Polyvinyl
alcohol (gm) 0.5 0.5 0.5 0.5 0.5 0.5 0.5 0.5 0.5
Ethanol (ml) 5 10 15 5 10 15 5 10 15
Distilled water
(ml) 100 100 100 100 100 100 100 100 100
Production yield
(%) 56.3±1.36 62.2±1.51 74.8±2.01 52.5±1.65 69.9±2.83 73.4±2.92 51.3±1.70 64.2±0.90 66.76±1.80 Loading
Efficiency (%) 69.34±1.6 74.1±0.90 81.2±1.37 64.5±1.35 71.54±1.82 79.3±1.37 61.24±2.41 67.8±1.45 73.2±0.79 Drug content (%) 53.9±1.40 57.8±1.57 62.7±0.60 51.3±0.90 54.7±2.94 56.4±2.66 51.6±1.15 52.8±1.44 54.2±1.35 Mean
particlediameter (µm)
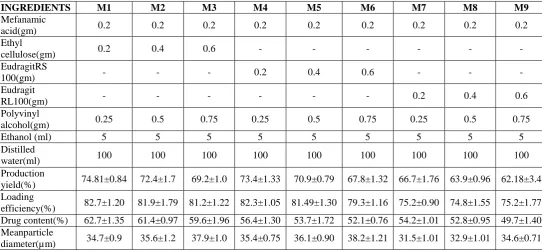
Effect on polymer on mefanamic acid microsponge
Table 5: Effect on polymer on mefanamic acid microsponge.
INGREDIENTS M1 M2 M3 M4 M5 M6 M7 M8 M9
Mefanamic
acid(gm) 0.2 0.2 0.2 0.2 0.2 0.2 0.2 0.2 0.2
Ethyl
cellulose(gm) 0.2 0.4 0.6 - - - -
EudragitRS
100(gm) - - - 0.2 0.4 0.6 - - -
Eudragit
RL100(gm) - - - 0.2 0.4 0.6
Polyvinyl
alcohol(gm) 0.5 0.5 0.5 0.5 0.5 0.5 0.5 0.5 0.5
Ethanol (ml) 5 5 5 5 5 5 5 5 5
Distilled
water(ml) 100 100 100 100 100 100 100 100 100
Production yield
(%) 74.81±2.0 68.05±1.90 61.24±1.75 73.4±2.42 71.7±1.40 69.4±1.45 66.7±1.80 65.1±1.32 64.8±1.07 Loading
efficiency (%) 81.2±1.75 79.3±1.45 77.8±1.47 79.3±1.15 76.8±2.23 75.2±1.25 73.2±1.32 72.9±2.02 71.1±1.36 Drug content (%) 62.7±1.00 61.4±1.79 59.4±1.83 56.4±2.07 54.9±2.05 53.5±1.83 54.2±1.15 53.3±1.73 52.6±1.00 Meanparticle
diameter(µm) 34.7±1.00 33.1±1.45 32.5±2.47 35.4±1.73 33.6±0.85 32.8±1.25 31.5±1.67 30.6±1.00 29.5±1.68
Effect on emulsifying agent on Mefanamic acid microsponge
Table 6: Effect on emulsifying agent on Mefanamic acid microsponge.
INGREDIENTS M1 M2 M3 M4 M5 M6 M7 M8 M9
Mefanamic
acid(gm) 0.2 0.2 0.2 0.2 0.2 0.2 0.2 0.2 0.2
Ethyl
cellulose(gm) 0.2 0.4 0.6 - - - -
EudragitRS
100(gm) - - - 0.2 0.4 0.6 - - -
Eudragit
RL100(gm) - - - 0.2 0.4 0.6
Polyvinyl
alcohol(gm) 0.25 0.5 0.75 0.25 0.5 0.75 0.25 0.5 0.75
Ethanol (ml) 5 5 5 5 5 5 5 5 5
Distilled
water(ml) 100 100 100 100 100 100 100 100 100
Production
yield(%) 74.81±0.84 72.4±1.7 69.2±1.0 73.4±1.33 70.9±0.79 67.8±1.32 66.7±1.76 63.9±0.96 62.18±3.4 Loading
efficiency(%) 82.7±1.20 81.9±1.79 81.2±1.22 82.3±1.05 81.49±1.30 79.3±1.16 75.2±0.90 74.8±1.55 75.2±1.77 Drug content(%) 62.7±1.35 61.4±0.97 59.6±1.96 56.4±1.30 53.7±1.72 52.1±0.76 54.2±1.01 52.8±0.95 49.7±1.40 Meanparticle
diameter(µm) 34.7±0.9 35.6±1.2 37.9±1.0 35.4±0.75 36.1±0.90 38.2±1.21 31.5±1.01 32.9±1.01 34.6±0.71
From the characterization study of mefenanic acid microsponge formulatons M3,M6,M9 were found to be good, so these formulations are converted into gel and emulgel.
Figure 7: SEM Images of microsponge containing Ethyl cellulose.
Figure 8: SEM Images of Microsponge containing Eudragit RS 100.
Figure 9: SEM Images of Microsponge containing Eudragit RL 100.
Evaluation of Microsponge Gel
Formulation code Colour Homogenity Grittiness pH: Extrudability
MG1 Clear Homogenous No 6.8±0.10 1.1±0.20
MG2 Clear Homogenous No 6.5±0.17 1.2±0.128
Spreadability of Microsponge Gel
Formulation code M(gm) L(cm) T(Sec) spreadability
MG1 50 6 22 13.633±0.39
MG2 50 6 23 13.092±0.33
MG3 50 6 20 15±0.91
Viscosity of mefenamic acid microsponge gel
Formulation Code Spindle number Revolution per min (RPM) Torque (%) Viscosity (Cp)
MG1 S62 20 87.5 1266±22.50
MG2 S62 20 91.2 1342±22.05
MG3 S62 20 89 1150±33.56
Drug content: 1g gel and emulgel in about 100 ml of methanol& diluted to 10ml with methanol Solutions were then filtered and spectrophotometrically analyzed for drug content at 285nm
Formulation Code Drug Content (%)
MG1 70.5±1.35
MG2 75.16±0.69
MG3 68.20±1.51
In vitro drug release of mefenamic acid microsponge Gel
• Modified Keshary-Chien apparatus
• The dissolution medium used was phosphate buffer pH7.4
• Analyzed by UV-Visible spectrophotometer at 285 nm and % cumulative drug release was calculated.
In vitro drug release mefenamic acid microsponge gel
Time in hr. % Cumulative Drug release
MG1 MG2 MG3
0 6.6±0.30 7.142±0.49 6.42±0.65
1 10.20±0.85 11.73±0.71 7.048±0.92 2 27.55±1.72 28.06±1.43 11.78±1.23 3 32.14±1.40 33.67±1.09 19.43±1.84 4 40.30±0.96 37.75±1.22 28.06±1.17
5 47.95±0.91 50±1.65 36.22±0.77
6 60.20±1.35 61.75±1.74 42.34±1.94 7 66.83±0.98 70.40±1.53 58.16±1.88 8 76.02±1.07 77.55±1.41 65.81±1.39
Kinetics of drug release was studied to examine the drug release kinetics and mechanism, the cumulative release data were fitted to models representing
• zero order • first order • Higuchi’s plot
DISCUSSION
Identification of drug & Compatibility studies
Drug identification was done by performing melting point determination and FT-IR studies. From the result the melting point of drug was found to be 230 0C which complies with official standardindicating the purity of the sample. FT-IR studies peak of mefenamic acid obtained at 3311.92cm-1, 2974.36cm-1, 1648cm-1, 1595.2 cm-1,1575.91 cm-1, 1507cm-1, 1257 cm-1, 1163 cm -1,756.13 cm -1 showed that the peaks are identical to
reference indicating the identity of drug. The FT-IRspectrums of pure drug, polymers and physical mixture of drug and polymers. (figure 2,3,4,5) shows that no interaction took place between drug and polymer.However,some additional peaks were observed with physical mixtures, whichcould be due to the presence of polymers. These results suggest that there is no interaction betweenthe drug and polymers used in the study. Thus indicating that the drug and polymer are compatible with each other.
Effect of Formulation Variables Microsponges Effect of polymer content on microsponges
It was observed that on the increase of polymer ratio to 0.2-0.6 gm production yield, loading efficiency and particle size increase and drug content decreased on increasing polymer ratio. From this study formulation containing ethyl cellulose (0.6gm) [M3] was found to be good microsponges as shown in table no.4
Effect of volume of Internal Phase on Microsponges It was observed that on increasing the volume of internal phase 5 to 10 ml microsponge were not formed. This may due to the decrease in the viscosity of internal phase. In this study observed that particle size, production yield and drug content decreased on increasing internal phase. These result suggest that the amount of ethanol need to be controlled within an appropriate range to affect not only the formation of quasi emulsion but also the solidification of drug and polymer in the droplets. The good microsponges were produced as better when 5 ml of ethanol was used as shown in table no. 5.
Effect of Amount of Emulsifying agent on Microsponge
The production yield and mean particle size were greatly affected by the amount emulsifyingagent. The increase in the amount emulsifying agent resulted in larger microsponges. This couldbe due to increased viscosity The increased amount of emulsifying agent decreased the productionyield, drug content and loading efficiency, with increased and mean particle size also as shown intable no.6.
Surface morphology by scanning electron microscopy From figure 7, 8 and 9 we can assume that the microsponge formed is spherical in shape and it has a porous surface. This may be due to rapid escape of volatile solvent (ethanol) during the formulation procedure.
Characterization of Microsponge Gel Physical appearance
The prepared mefenamic acid microsponge gel was evaluated visually for their clarity and homogeneity. All the 3 formulations had good clarity and homogeneous with absence of lumps.
pH measurement
pH values of formulation MG1, MG2 and MG3 is 6.8, 6.5 and 6.7 respectively. The values are acceptable where avoids risk of irritation upon application to the skin because skin pH is 5.5.
Viscosity
The rheological behaviour of all formulated gels was studied using Brookfield viscometer at a speed of 20 rpm and spindle no.64 was used. And it was found that all the formulations exhibit plastic flow which is a desirable property for topical gel
Extrudability
Extrudability of all the formulation was determined. It was found that the formulation MG3 has excellent extrudability with low viscosity.
Spreadability
good spreadability to microsponge gel MG1 has spreadability 15g.cm/sec. which indicates that it spreads easily by the application of small shear. Values of spreadability were ranges from 19-25 g.cm/sec. It was found that the spreadability increased with decreased viscosity.
Drug content
Drug content of the formulated gels was estimated by UV spectrophotometer at λmax 285nm and drug content was calculated from calibration curve. Drug content of the formulations showed that the drug was uniformly distributed in to gels and the drug content values of the three microsponge gel MG1, MG2 and MG3 is 70.5%, 75.16% and 68.20
In vitro Drug release studies
In vitro drug release studies of MG1, MG2 and MG3 as
microsponge gel. The release profiles obtained mefenamic acid From the drug release profiles the mefenamic acid microsponge gel it as found that the formulation containing eudragit RS 100 (MG2) as polymer showed good cumulative % drug release (75.16%)
Drug Release kinetics
The cumulative percentage of drug released when plotted against time, the figure shows the drug release seems to follow zero order kinetics as it is evidenced by correlation coefficients (r2=0.9907 to 0.9658 ) which is better than first order( r2 = 0.970 to 0.88) in mefenamic acid microsponge gel. Therefore it was ascertained that the drug permeation from these formulations could follow nearly zero order kinetics. In this study the correlation coefficient (r2 )of Korsmeyer-Peppas model was found to be closer to 1 and slope values (n) was ranging from 0.9068-08733 for MG1 & MG2 ,this suggests that the drug permeation from mefenamic acid gel followed Higuchi model or matrix diffusion
CONCLUSION
Mefenamic acid is anthranilic acid derivative of NSAID’S, it appears to be first antiphlogistic analgesic discovered since aminopyrine. Rheumatoid and osteo arthritis are treated by NSAID’S, mefenamic acid is used tablets orally as currently. Oral administration this drug has adverse effects like head ache, dizziness, G I ulcer, nausea, vomiting. Hence formulation novel drug delivery system such as microsponge drug delivery system mefenamic acid will maximize the duration of drug adherence on the skin surface and overcome problem associated with conventional preparation i.e. oral dosage form.
Mefenamic acid loaded microsponges were successfully developed by quasi emulsion technique. microsponge with ethanol 5ml as internal phase and 0.5 g of emulsifying agent shows better microsponge. The developed formulations were in cooperated into gel. Mefenamic acid microsponge good to gel as their
viscosity, spreadability, drug content and in vitro release was found better than that of mefenamic acid microsponge gel. Mefenamic acid containing eudragit RS100 produced good gel (MG2) showed the better result in term of drug content and in vitro drug release.
REFERENCES
1. Embil K. Nacht S. The Microsponge Drug Delivery: A Topical Delivery System with reduced irritancy in-cooperating multiple triggering mechanism for the release of Actives. Journal of Microcapsule.1996; 3(5): 557-558.
2. Comoglo T, Gonul N, Baykara T. Preparation and in vitro evaluation of modified release ketoprofen microsponge. Farmaco, 2003; 58: 101-106.
3. Ali Nokhodchi, Mitra Jelveghari, Mohammad-Reza Siahi, Siavoosh Dastmalchi. The Effect of Formulation Type on the Release of Benzoyl Peroxide from Microsponges. Iranian Journal of Pharmaceutical Sciences, 2005; 1(3): 131-142. 4. Jelvehgari M, Siahi-Shadbad MR, Azarmi S, Gary
P, Martin, Nokhodchi A. The microsponge delivery system of benzoyl peroxide: Preparation, characterization and release studies. International Journal of Pharmaceutics, 2006; 308: 124-132. 5. Teena Oswal, Sonali Naik. Formulation and
Evaluation of Mefenamic acid. International Journal of Pharmaceutical Research and Development, 2014; 5(12).91-100.
6. Mahajan Anirudha G. Jagtap Leena S, Choudhari Atul L, Swami Sima P, Maliprabha R. Formulation and Evaluation of Microsponge drug delivery system using Indomethacin. International Research Journal of Pharmacy, 2011; 2(10): 64-69.
7. Malode Sonali S, Basarkar G.D. Formulation, Development and in vitro evaluation terbinafine Hcl microsponge gel. International Journal of pharmaceutical research and development, 2014; 6(07): 84-91.
8. Shyam Sunder Mandava, Vedavathi Thavva. Novel Approach: Microsponge drug Delivery system. International Journal of Pharmaceutical Sciences and Research, 2012; 3(4): 967-980.
9. Rashmi Sareen, Kavitha nath, Nitin Jain, and K.L Dhar. Curcumin loaded microsponge for colon targeting in inflammatory bowel disease: fabrication, optimization, and in vitro and pharmacodynamics Evaluation. Bio med research international, 2014: 1-7.
10. Swetha A, Gopal Rao, Venkata Ramana K, Niyas Basha B. Formulation and in vitro evaluationof etodolac entrapped in microsponge based drug delivery system. International Journal of Pharmacy, 2011; 1(2): 73-80.
11. Yerram chandramouli, Shaik Firoz, R. Rajalakshmi, Amaravathi Vikram, R. Naveen Chakravarthi. International Journal of Biopharmaceutics, 2012; 3(2): 96-102.
microsponge gel. International Journal of pharmaceutical research and development, 2014; 6(07): 84-91.
13. Swetha A, Gopal Rao, Venkata Ramana K, Niyas Basha B. Formulation and in vitro evaluation of etodolac entrapped in microsponge based drug delivery system. International Journal of Pharmacy, 2011; 1(2): 73-80.
14. Yerram chandramouli, Shaik Firoz, R.Rajalakshmi, Amaravathi Vikram, R. Naveen Chakravarthi. International Journal of Biopharmaceutics, 2012; 3(2):96-102.
15. Ravi R, S.K. Senthil kumar, S. Prathiban. Formulation and evaluation of the microsponge gel for an anti-acne agent for the treatment of acne. International Journal of Pharmaceutical science and research, 2013; 32-38.