Re-evaluation of Automatic Global Histogram Equalization-based Contrast
Enhancement Methods
Chen Soong Der, Manjit Singh Sidhu
Department of Graphics & MultimediaCollege of Information Technology, Universiti Tenaga Nasional Putrajaya, Malaysia
Abstract—A good number of modifications of the conventional
Global Histogram Equalization have been proposed, and claimed to have overcome the problem of distortions. However, the previous evaluation focused only on one type of distortion. The resilience to other types of distortion remains questionable. In this paper, we propose a new evaluation method based on a Noise-Artifacts-Proof test. The results show that none of the methods under evaluation is noise-artifacts-proof.
Keywords: Histogram equalization, noise, consumer
electronics
I. INTRODUCTION
Global Histogram Equalization (GHE) is one of the popular methods used to enhance the contrast of image. The underlying idea is to produce image with a uniform distribution of gray levels. As a result, GHE tends to flatten and stretch the dynamic range of image’s histogram to produce an image with better contrast. GHE has been widely used in many areas such as medical and radar imaging. However, GHE is rarely used in consumer electronics such as digital cameras because it may produce undesirable distortions such as:
i) excessive brightness change ii) noise-artifacts
iii) gray-level saturation iv) unnatural enhancement
Various modifications to the conventional GHE have been proposed to overcome the aforementioned problem. They can be broadly classified into two categories:
i) Automatic - user cannot regulate the degree of
enhancement. Examples are Brightness preserving Bi-Histogram Equalization (BBHE) [1], Multi-peak Histogram Equalization (Multi-peak) [2], equal area Dualistic Sub-Image Histogram Equalization (DSIHE) [3], Minimum Mean Brightness Error Bi-Histogram Equalization (MMBEBHE) [4], Brightness Preserving Histogram Equalization with Maximum Entropy (BPHEME) [5], Brightness Preserving Dynamic Histogram Equalization (BPDHE) [6],
ii) Scalable – user can interactively regulate the degree
of enhancement by altering the parameter’s value. Examples are Recursive Mean-Separate Histogram Equalization (RMSHE) [7], Dynamic Histogram Equalization (DHE) [8], Weighted Thresholded Histogram Equalization (WTHE) [9] and Scalable Global Histogram Equalization with Selective Enhancement (SGHESE) [10].
Despite the claim of all these methods to have overcome the problem of distortions, they remain questionable, particularly the automatic methods. Scalable methods can always avoid producing distortions as it can be regulated interactively. However, the same cannot be said for automatic methods. Hence, it is essential to run through a reliable “Distortion-Proof” test before any automatic method can be claimed to be suitable for consumer electronics.
In the next section, previous evaluation method is reviewed and the weaknesses will be highlighted. In section III, we propose a new evaluation method based on Noise-Artifacts-Proof test. Section IV presents the results of evaluation on selected automatic methods using the new evaluation method. Section V makes some concluding remarks.
II. REVIEW OF PREVIOUS EVALUATION METHODS
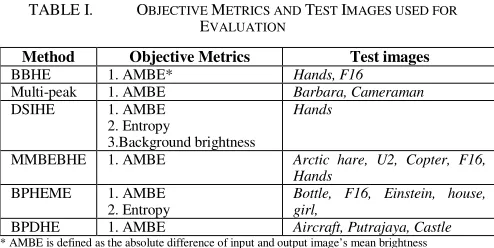
Table 1 summarizes the objective metrics and test images used to evaluate the respective automatic methods.
TABLE I. OBJECTIVE METRICS AND TEST IMAGES USED FOR EVALUATION
Method Objective Metrics Test images
BBHE 1. AMBE* Hands, F16
Multi-peak 1. AMBE Barbara, Cameraman
DSIHE 1. AMBE 2. Entropy
3.Background brightness
Hands
MMBEBHE 1. AMBE Arctic hare, U2, Copter, F16, Hands
BPHEME 1. AMBE 2. Entropy
Bottle, F16, Einstein, house, girl,
BPDHE 1. AMBE Aircraft, Putrajaya, Castle * AMBE is defined as the absolute difference of input and output image’s mean brightness
Table 1 clearly shows that the evaluation focuses only one of the four types of distortion - excessive brightness change. In fact, all the automatic methods so far have been designed to preserve brightness. The idea of preserving
brightness is originated by the author of BBHE, assuming that the fundamental reason behind limitation of conventional GHE is that, it does not take the mean brightness of an image into account. This paper argues that using AMBE or Entropy to indicate the presence of distortions such as noise-artifacts, gray-level saturation and unnatural enhancement across different images could be misleading.
Besides, there are two more weaknesses in the previous evaluations:
i) the number of test images used is too few to conclude that the method in-study is distortion-proof.
ii) the evaluations are not based on a common set of test images. The evaluation results may not be reliable because test images could have been chosen in favor of the method in study.
Since there are weaknesses in the previous evaluations, it remains questionable whether the current automatic GHE-based methods are distortion-proof. In this paper, we propose to re-evaluate the methods using a new evaluation method based on Noise-Artifacts-Proof test as described in the following section.
III. NEW EVALUATION METHOD
In this new evaluation method, a GHE-based method is tested on their resilience to noise-artifacts. The details of the evaluation such as test images and procedures of noise-artifacts-proof test are as described below:
A. Test Image
The procedures to identify suitable test images are as follows:
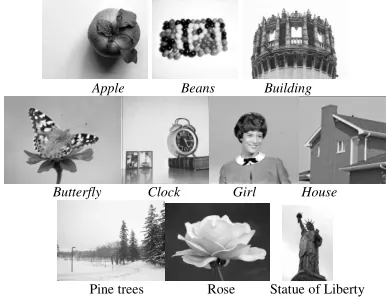
i) identify images with simple structure that show only one single main-object with plain background Figure 1 shows example of such images. It is observed that this type of image tends to show noise-artifacts at the background after being processed by GHE.
ii) select only images with good contrast; i.e. gray-level distribution is more than 90% of the full dynamic range
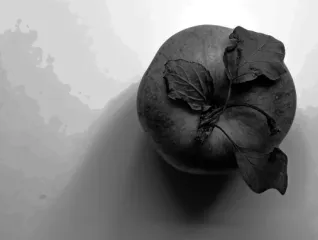
iii) reduce the image contrast by using histogram shrink such that the new gray-level distribution is 60% of the full dynamic range. Figure 2 and 3 show an image before and after the contrast shrink. This step served two purposes:-
- to simulate low contrast image such that there is room for contrast enhancement because all the test images originally have good contrast
- for benchmarking purposes where original image was used as reference image to be compared with the output images of the methods in study.
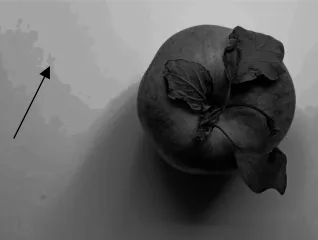
iv) process the contrast-reduced image using GHE and select only images that show presence of severe noise-artifacts at the background. Figure 4 shows an
output image with severe noise- at the background after being processed by GHE.
Ten test images (see Figure 1) have been identified for the Noise-Artifacts-Proof test following the above procedures.
Apple Beans Building
Butterfly Clock Girl House
Pine trees Rose Statue of Liberty Figure 1. The test images with simple structure
Figure 2. Original image, apple
Figure 4. Output image of GHE, apple
B. Noise-Artifacts-Proof Test
This test consist both subjective and objective evaluation. It is known that there is potential of bias in evaluation involving human subject. The objective evaluation serves to minimize the bias. The conclusion of the test will be based on the consistency of the results of both.
In subjective evaluation, the noise-artifacts are detected by means of visual observation. During the observation, each output image is displayed next to its contrast-reduced image. The presence of noise-artifacts is detected as the presence of lines, contours, patches or dots within the background of an image that is not observed in its corresponding contrast-reduced image.
Contrast can be measured by using the variance of its gray levels distribution, σ2 defined by (1) as follows:
(
)
[
]
∑
= − = n i i g g n 1 2 2 1σ (1)
∑
= = n i i g n g 11 (2)
where
gi: gray level of the pixel
n: the total number of pixel
i: the index of pixel
In the objective evaluation, we propose a new objective metric called Background Contrast Gain Percentage (BCGP). It is used to measure the change of contrast of an image’s background relative to its corresponding contrast-reduced image’s background. It is formally defined by (3) as follows:
% 100 2 _ 2 _ 2 x BCGP BGR CRI BGR CRI BGR σ σ σ −
= (3)
where 2
BGR
σ : variance of an image’s background 2
_BGR CRI
σ
: variance of its corresponding contrast-reduced image’s backgroundIn order to measure only the contrast of an image’s background (without the main-object), a background mask image (see Figure. 5) must be created manually for each test image. The BCGP of an output image with noise-artifacts will be significantly higher than the BCGP of its original image without noise-artifacts.
An output image is considered to show presence of noise-artifacts if and only if
i) the presence of noise-artifacts are detected by human observer and,
ii) significantly high BGCP (at least 10 times) compared to original image
A method under evaluation is considered to have failed the noise-artifacts-proof test if any of its output images are found to show presence of noise-artifacts.
Figure 5. Background mask, apple
IV. RESULTS AND DISCUSSIONS
Table II shows the results of visual inspection for the presence of noise-artifacts in the output images of GHE, BBHE, DSIHE MMBEBHE and Multi-peak HE. During the evaluation, it is observed that all the output images show noise-artifacts. As such, none of the automatic GHE-based methods is noise-artifacts-proof. Figure 6, 7, 8 and 9 show example of output image of BBHE, DSIHE, Multi-peak HE and MMBEBHE respectively. An arrow is inserted in each output images to highlight the location that show noise-artifacts. Note that there could be more than one location that shows noise-artifacts in all the output images. The inserted arrow served to highlight one of the locations for reader reference.
TABLE II. RESULTS OF VISUAL INSPECTION FOR NOISE-ARTIFACTS
GHE BBHE DSIHE MMBEB HE
Multi-peak HE
apple Yes Yes Yes Yes Yes
beans Yes Yes Yes Yes Yes
building Yes Yes Yes Yes Yes
butterfly Yes Yes Yes Yes Yes
clock Yes Yes Yes Yes Yes
house Yes Yes Yes Yes Yes
girl Yes Yes Yes Yes Yes
pine trees Yes Yes Yes Yes Yes
rose Yes Yes Yes Yes Yes
statue of liberty
Figure 6. Output image of BBHE, apple
Figure 7. Output image of DSIHE, apple
Figure 8. Output image of Multi-peak, apple
Figure 9. Output image of MMBEBHE, apple
Table III shows the computed BCGP of each output image in study. Notice that the BCGP of all the output
images are much higher than their corresponding original image. Figure 10a and 10b presents the log10(BCGP) of all the output images in the form of clustered chart. The charts show that majority (46 out of 50) of the output images’ BCGP are higher than their original images’ BCGP for more than 1 magnitude order (10 times). The readings strongly indicate that the contrast of most output images’ background have been over-enhanced and very likely that there are noise-artifacts.
TABLE III. BCGP OF THE OUTPUT IMAGES
GHE BBHE DSIHE
Multi-Peak MMBEBHE Original
Apple 4705 2315 2099 2734 3625 109
Beans 21249 2036 5788 3593 1455 151
Building 817660 427950 415470 29895 240760 225
Butterfly 6128 2059 5555 629 4441 189
Clock 4950 1031 1947 3592 1007 95
Girl 40082 16696 36716 2980 36716 392
House 38746 49469 40347 4883 33841 101
Pine Trees 25183 1996 6885 19718 1866 732
Rose 16524 7881 7637 5919 12963 176
Statue of
Liberty 6338 2365 3054 1545 3762 174
Figure 10a. log10(BCGP) of the output images
Figure 10b. log10(BCGP) of the output images
V. CONCLUSIONS
evaluation method. None of the methods are noise-artifacts-proof. The results indicate that the previous evaluation method that is based on AMBE and entropy is insufficient. We recommend adopting the proposed evaluation method as complement to the existing one.
REFERENCES
[1] Yeong-Taeg Kim. "Contrast enhancement using brightness preserving bi-histogram equalization", IEEE Transactions on Consumer Electronics, Vol. 43, Issue: 1, pp. 1-8, Feb 1997 [2] Wongsritong K.et. al., "Contrast enhancement using multipeak
histogram equalization with brightness preserving", The 1998 IEEE Asia-Pacific Conference on Circuits and Systems, pp. 455-458, Nov 1998,
[3] Yu Wang, Qian Chen and Baeomin Zhang, "Image enhancement based on equal area dualistic sub-image histogram equalization method", IEEE Transactions on Consumer Electronics, Vol. 45 Issue: 1, pp. 68 -75, Feb. 1999
[4] Soong-Der Chen and Abd. Rahman Ramli, "Minimum Mean Brightness Error Bi-Histogram Equalization in Contrast Enhancement", IEEE Transactions on Consumer Electronics, Vol. 49, No. 4, pp. 1310–1319, Nov 2003
[5] Chao Wang and Zhongfu Ye, "Brightness Preserving Histogram Equalization with Maximum Entropy: A Variational Perspective", IEEE Transaction on Consumer Electronics, Vol. 51, No. 4, pp. 1326-1334, Nov 2005
[6] Haidi Ibrahim and Nicholas Sia Pik Kong, "Brightness Preserving Dynamic Histogram Equalization for Image Contrast Enhancement", Vol. 53, No. 4, pp. 1752-1758, Nov 2007 [7] Soong-Der Chen and Abd. Rahman Ramli, "Contrast
Enhancement using Recursive Mean-Separate Histogram Equalization for Scalable Brightness Preservation", IEEE Transactions on Consumer Electronics, Vol. 49, No. 4, pp. 1301–1309, Nov 2003
[8] M. Abdullah-Al-Wadud et. al., "A Dynamic Histogram Equalization for Image Contrast Enhancement", IEEE Transactions on Consumer Electronics, Vol. 53, No. 2, pp. 593-600, May 2007
[9] Qing Wang and Rabab K. Ward, "Fast Image/Video Contrast Enhancement Based on Weighted Thresholded Histogram Equalization", IEEE Transactions on Consumer Electronics, Vol. 53, No. 2, pp. 757-764, May 2007