Maximising Export Returns
(MER): Consumer behaviour
and trends for credence
attributes in key markets
and
a review of how these
may be
communicated
Sini Miller
Tim Driver
Noelani Velasquez
Caroline Saunders
Research to improve decisions and outcomes in agribusiness, resource, environmental, and social issues.
The Agribusiness and Economics Research Unit (AERU) operates from Lincoln University providing research expertise for a wide range of organisations. AERU research focuses on agribusiness, resource, environment, and social issues.
Founded as the Agricultural Economics Research Unit in 1962 the AERU has evolved to become an independent, major source of business and economic research expertise.
The Agribusiness and Economics Research Unit (AERU) has four main areas of focus. These areas are trade and environment; economic development; non-market valuation, and social research.
Research clients include Government Departments, both within New Zealand and from other countries, international agencies, New Zealand companies and organisations, individuals and farmers.
MISSION
To exercise leadership in research for sustainable well-being
VISION
The AERU is a cheerful and vibrant workplace where senior and emerging researchers are working together to produce and deliver new knowledge that promotes sustainable well-being
AIMS
To be recognised by our peers and end-users as research leaders for sustainable well-being
To mentor emerging researchers and provide advanced education to postgraduate students
To maintain strong networks to guide AERU research efforts and to help disseminate its research findings
To contribute to the University’s financial targets as agreed in the AERU business model
DISCLAIMER
While every effort has been made to ensure that the information herein is accurate, the AERU does not accept any liability for error of fact or opinion which may be present, nor for the consequences of any decision based on this information.
A summary of AERU Research Reports, beginning with #235, are available at the AERU website www.lincoln.ac.nz/aeru
Printed copies of AERU Research Reports are available from the Secretary.
Maximising Export Returns (MER): Consumer behaviour
and trends for credence attributes in key markets and a
review of how these may be communicated
Sini Miller Tim Driver Noelani Velasquez Caroline Saunders
July 2014
Research Report No. 332
Agribusiness and Economics Research Unit PO Box 85084
Lincoln University Lincoln 7647 Christchurch New Zealand
Ph: (64) (3) 423 0372 http://www.lincoln.ac.nz/AERU/
ISSN 1170-7682 (Print) ISSN 2230-3179 (Online)
Table of Contents
LIST OF FIGURES vii
LIST OF TABLES vii
LIST OF ACRONYMS x
EXECUTIVE SUMMARY xi
CHAPTER 1 INTRODUCTION 1
CHAPTER 2 MARKET DEVELOPMENTS 7
2.1 United Kingdom 7
2.1.1 Background 7
2.1.2 Credence attributes 8
2.2 China 14
2.2.1 Background 14
2.2.2 Credence attributes 15
2.3 India 21
2.3.1 Background 21
2.3.2 Credence attributes 21
2.4 Singapore 25
2.4.1 Background 25
2.4.2 Credence attributes 26
2.5 Indonesia 27
2.5.1 Background 27
2.5.2 Credence attributes 30
CHAPTER 3 CHOICE MODELLING 33
3.1 Introduction 33
3.1.1 Choice experiments 33
3.1.2 Practical considerations 34
3.2 Literature review: choice experiment applications on credence
attributes 34
3.2.1 Studies from Asia 35
CHAPTER 4 CONSUMER PREFERENCES AND TECHNOLOGY 63
4.1 Internet and Web 2.0 63
4.2 Social media 68
4.3 Mobile technology 83
4.4 Technology integration 86
CHAPTER 5 CONCLUSION 91
REFERENCES 97
APPENDIX A CHOICE MODELLING METHOD/NOT INCLUDED 123
List of Figures
Figure 1.1: Importance of attributes in New Zealand food products 1
Figure 1.2: Importance of ethical and environmental attributes in New Zealand food
products 2
Figure 1.3: Importance of ethical and environmental attributes in New Zealand food
products 3
List of Tables
Table 1.1: Consumers WTP for food attributes in lamb and dairy in China, India and UK 4
Table 2.1: Exports of New Zealand agricultural commodities to the United Kingdom
(2013) 8
Table 2.2: Exports of New Zealand agricultural commodities to China (2013) 14
Table 2.3: Chinese consumers’ WTP for certified traceable food 17
Table 2.4: Exports of New Zealand agricultural commodities to Singapore (2013) 25
Table 2.5: Exports of New Zealand agricultural commodities to Indonesia (2013) 28
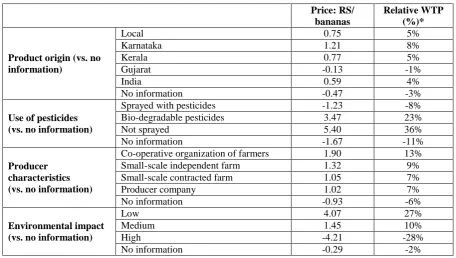
Table 3.1: Indian consumers’ WTP for product transparency information of bananas 35
Table 3.2: Chinese consumers' WTP for milk food safety attributes 36
Table 3.3: Chinese consumers’ WTP for traceability certified milk 37
Table 3.4: Chinese consumers’ WTP for pork food safety attributes 38
Table 3.5: Chinese consumers’ preferences for the soybean milk 38
Table 3.6: Japanese consumers’ WTP for HACCP and Eco labelled milk products 39
Table 3.7: Japanese consumers’ WTP for organic milk 39
Table 3.8: Japanese consumers’ WTP for credence attributes in oil products 40
Table 3.9: Japanese consumers’ WTP for BSE-tested beef 40
Table 3.10: Swedish consumers’ WTP for pig welfare in production 41
Table 3.11: Sweden: Consumers’ WTP for pig welfare in production 42
Table 3.12: Swedish consumers’ WTP for meat production attributes: chicken, beef and
pork 42
Table 3.13: Swedish consumers’ WTP for other agricultural production attributes: eggs
and milk 43
Table 3.14: Swedish consumers’ WTP for other agricultural production attributes: flour 43
Table 3.15: Finnish consumers’ WTP for broiler chicken products’ country of origin 43
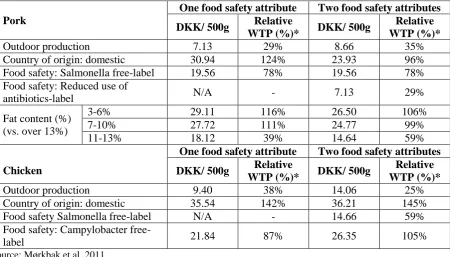
Table 3.17: Danish consumers’ WTP for food safety attributes for pork and chicken 45
Table 3.18: Danish consumers’ WTP for food safety and chicken outdoor production
attributes 45
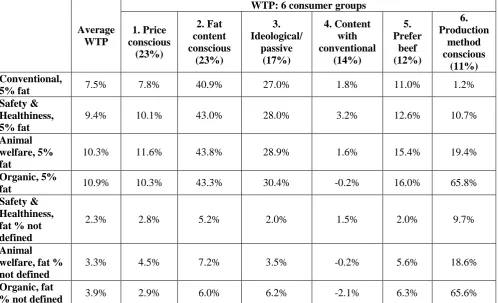
Table 3.19: Finnish consumers’ WTP for the baseline beef and pork products: with
conventional production and fat content not defined 46
Table 3.20: Finnish consumers’ WTP for beef products 47
Table 3.21: Finnish consumers’ WTP for pork products 47
Table 3.22: Finnish consumers’ WTP for carbon footprint relative to the baseline beef
and pork products 48
Table 3.23: US consumers WTP for steak production attributes 48
Table 3.24: US consumers WTP for the rib-eye beef steak attributes 48
Table 3.25: US consumers’ preferences for pork production attributes 49
Table 3.26: US consumers’ WTP for certification programs for pork chops 50
Table 3.27: US consumers’ preferences from two perspectives for pork product
certification 51
Table 3.28: US consumers’ preferences from two perspectives for milk product
certification 52
Table 3.29: US consumers’ WTP for animal welfare and food safety attributes in pork
production 53
Table 3.30: Canadian consumers’ WTP for bison steak attributes 53
Table 3.31: US consumers’ WTP for milk food safety 54
Table 3.32: UK consumers’ WTP for functional ingredients in bread choices 55
Table 3.33: Spanish consumers’ preferences for functional wine 56
Table 3.34: US consumers’ WTP for pear search and experience attributes 56
Table 3.35: UK consumers’ WTP for airline carbon offset certification programs 57
Table 3.36: US consumers WTP for the forest product (paper towels) production
attributes 58
Table 3.37: Consumer preferences for the steak food safety and tenderness in a
cross-country comparison 58
Table 3.38: Consumer WTP for onion GM, pesticide and origin attributes in a
cross-country comparison 59
Table 3.39: European consumers (Czech Republic, Denmark, Germany) WTP for organic
certification logos 60
Table 3.40: European consumers’ (Italy, Switzerland, UK) WTP for organic certification l
ogos 60
Table 4.1: Top 10 most visited websites (global) – February/March 2014. 70
Table 4.2: Number of fans for the top five brands on Facebook across 5 international
markets (February 2014) 70
Table 4.3: Number of followers for the top five brands on Twitter across 5 international
Table 4.4: Number of fans for the top five industries on Facebook (February 2014) 73
Table 4.5: Number of fans for the top 5 brands on Facebook – New Zealand (February
2014) 73
Table 4.6: Number of followors for the Top 5 brands on Twitter – New Zealand (April
2014) 73
Table 4.7: Number of fans for the top 5 industries on Facebook – New Zealand (February
2014) 73
Table 4.8: Anchor’s international market-based Facebook and Twitter pages 79
Table 4.9: Anlene’s international market-based Facebook and Twitter pages 80
Table 4.10: Anmum’s international market-based Facebook and Twitter pages 80
Table 4.11: Zespri’s international market-based Facebook and Twitter pages 81
List of Acronyms
ASEAN Association of Southeast Asian Nations
B2B Business-to-business
B2C Business-to-consumer
BSE Bovine Spongiform Encephalopathy
Bt Bacillus thuringiensis
C2C Consumer-to-consumer
CAGR Compound annual growth rate
CE Choice experiment
CGM Consumer-generated media
CO2 Carbon dioxide
ECB Ecologically-conscious behaviour
EPC Electronic product code
eWOM Electronic word of mouth
FDI Foreign direct investment
FMCG Fast moving consumer goods
FSA Food Standards Agency
FSC Forest Stewardship Council
FTS Food traceability system
GAP Good agricultural practices
GDP Gross domestic product
GHG Greenhouse gases
GM Genetically-modified
GMO Genetically-modified organism
GPS Global positioning system
HACCP Hazard analysis and critical control point
NFC Near field communication
NGO Non-governmental organisation
QR Quick response
rbST Recombinant bovine somatotropin
RFID Radio frequency identification device
RSS Really simple syndication
SMS Short message service
UGC User-generated content
UHT Ultra-high temperature
WOM Word of mouth
WTA Willingness to accept
Executive Summary
This report builds upon earlier work conducted by the Agribusiness and Economics Research Unit (AERU), and examines trends in consumer attitudes toward credence attributes concentrating on key markets (United Kingdom, China, India, Singapore and Indonesia) that are important or have potential for New Zealand exporters.
This report is part of a wider research project ‘Maximising Export Returns (MER)’, an MBIE funded three year project undertaken by the AERU at Lincoln University. This project aims to explore how export firms can capture price premiums by including credence attributes in products for overseas markets. The purpose of this report is to provide an initial literature review to identify types of credence attributes, explore consumer preferences for them as well as provide an overview of “smart” technologies being used by consumers internationally.
Credence attributes are features of a product that are not directly determinable via product experience (Wirth et al. 2011). Thus they are often expressed by some type of labelling or certification scheme. Examples of credence attributes include those relating to food safety, animal welfare, environmental protection, country-of-origin, functional (or healthy) foods and the use of organic production methods.
Aspects of this work builds on former research work undertaken by AERU (Driver et al. 2011; Saunders et al. 2010, 2013), showing that overseas consumers (including those in the UK, China, and India) value different food attributes in New Zealand products. Food safety was the most important food attribute, not surprisingly India and China rated food safety certification as more important than respondents from the UK. However, more surprising was that in most cases Indian and Chinese consumers valued other credence attributes more than in the UK, especially for organic, environmental quality, animal welfare and recyclability. This indicated that consumers in all markets value credence attributes, and their willingness to pay for different food attributes differ across countries.
Therefore, this study explores these preference for credence attributes further in developing countries. Based on the study briefs, the following markets will be included:
The United Kingdom (UK), which is an established market that still accounts for a sizable share of New Zealand’s export trade.
China, one of New Zealand’s most valuable trade partners (via New Zealand’s Free Trade Agreement with China).
India, a fast-growing market with which New Zealand is negotiating a Free Trade Agreement.
Other countries like Singapore or Indonesia that have current trade with New Zealand, and have been identified as growing export markets in the future.
recent technological developments focusing on online and mobile phone technology use trends are examined with specific relation to the use of these technologies by firms for direct communication with consumers.
Demand for certain credence attributes were examined in the consumer markets of United Kingdom, China, India, Singapore and Indonesia. Research exists for the United Kingdom, China, and India, fewer studies are available for Singapore and Indonesia. The main credence attribute across all markets (in terms of importance) is food safety.
Amongst UK consumers, the major themes include food safety, traceability, and country of origin labelling (for example, “Buy British”), especially after such food safety scares as the January 2013 Horsemeat adulteration scandal and the 2011 German sprouts E. coli outbreak. Other credence attributes that are relevant for British consumers are organic, fair trade, animal welfare, carbon labelling and local food.
The Chinese market is undergoing rapid change as more people move into urban areas. The most important credence attribute for Chinese consumers is food safety, with a high consumer demand for some form of food safety certification rather than none at all, as well as traceability information. “Safe food” is also related to the idea of “green food” in China, with consumers associating organics with being safer and healthier because of the lack of pesticide and other residues on food.
India is another market of increasing economic importance, with growing urbanisation. Indian consumers are showing an increase in interest for green consumption. Eco-labelling and eco-friendly packaging has been shown to strongly influence the purchasing decisions of urban Indians. Similar to China, Indian consumers also regard organics as a healthier alternative to conventionally produced food due, for example, to the lack of pesticide residues.
Countries like Singapore and Indonesia lack the in-depth credence attributes studies relative to those of the UK, China, and India, though some inferences can be made with the information that does exist. Singapore’s affluent consumer class is on the rise, and with national events such as the “Green Singapore Sale” which encouraged consumers to purchase eco-friendly products, there is indication that there is some interest in environmental credence attributes amongst Singaporean consumers. In Indonesia, research on the demand for organic products exists, organic products being a part of an increasing interest in healthy lifestyles.
Choice modelling, also known as choice experiments, is the main tool that economists use to estimate people’s willingness to pay for the attributes of products and services. This involves survey processes through which respondents choose their preferred option from a given set of options. This choice-making process involves respondents making “trade-offs”, as each option is described with multiple credence (or other) attributes. The choice experiment literature review herein extends beyond the selected key markets (UK, China, India, Singapore and Indonesia) to such markets as Europe and the US in order to provide a wider review of consumer preferences for credence attributes.
high concerns for the safety of food products following contamination outbreaks (e.g. “Horsegate” in the UK and the melamine scare of 2008 in China). This resulted in an overall lowering of consumer trust in food safety mechanisms and supermarkets. The value of food safety attribute can be measured through choice modelling experiments which show that consumers are willing to pay, on average:
In China, 69-106 per cent more for certified pork safety and 98-203 per cent for certified milk safety
In UK, China and India, 18-77 per cent more for lamb and dairy food safety
In USA, 18-46 per cent more for milk food safety labelling
In Japan, 110 per cent more for food safety labelled milk and 97-264 per cent more for BSE-tested meat
In Denmark, 19-105 per cent more for food safety labelling in chicken and pork
In Japan, Denmark and USA, 26-165 per cent of reduced use of antibiotics in meat and/or milk production
Quality is another credence attribute that has been included in food choice experiments. Some examples of consumer willingness to pay for food quality include:
In Japan, 103 per cent more for milk products with an extended expiration date of one day
In China, 37 per cent less for milk been sold after a three month time period
In Finland and Denmark, 7-111 per cent more for meat products with lower fat content
In USA, 14-16 per cent more for enhanced quality of pork and beef steak with guaranteed tenderness
In addition, a cross-country comparison indicated that people in Japan and Mexico were willing to pay more for enhanced food safety than for steak tenderness - the opposite was found in US and Canadian studies.
Many countries overseas also have certification schemes for different food attributes such as food safety. For example, the Chinese government introduced food product safety certification in response to recent food safety scares. Choice modelling studies indicate that Chinese consumers prefer government certified products, though other studies (i.e. not choice modelling) show that there is some distrust of these. Similar results have been found across other markets such as the US, but results are not always consistent. For a range of products, consumers were willing to pay:
In China, 64-140 per cent more for traceability, organic and GM-free for Government certifications; and 46-113 per cent more for foreign or private certifications of traceability, organic and GM-free food
In USA, 44-74 per cent more for USDA certified (all claims) milk and 11-34 per cent less for privately certified milk
In USA, 43-96 per cent for variety of animal welfare attributes certified by USDA but with inconsistent willingness to pay (premiums and discounts) for consumer group and third-party certifications
Another credence attribute is local food and country-of-origin. In UK, for example, consumers are marginally more willing to demand local or British made food as a result of food safety scares, with UK consumers willing to pay between 5 per cent less and 6 per cent more for imported lamb and dairy products.The choice modelling studies found similar results across a range of markets, with consumers indicating a willingness to pay premiums for products originating from a particular location, such as:
In China, 10-49 per cent more for imported lamb and dairy
In USA, 4-11 per cent more for local milk
In Denmark, 96-145 per cent for domestically-produced pork and chicken products
In China, France, USA and Niger, 50-130 per cent more for domestically-produced onions
In Finland, 30-92 per cent less for imported chicken
Organic production is also a common credence attribute. Interestingly, this was a product attribute found within the limited range of literature on the Indonesian food market. Consumers had knowledge about organics, with health-conscious consumers willing to pay more for these products. This is linked to a common association of organic products as having health (rather than environmental) benefits, including a limited use of pesticides, as indicated by Chinese and Indian consumers. Regarding the estimated values of these attributes, the choice modelling studies indicate that consumers are willing to pay, on average:
In China, 56-113 per cent more for certified organic soymilk
In Japan, 140-156 per cent more for organic milk and 32 per cent more for organic oil
In Spain, 15 per cent more for organic wine
In various markets, 36-121 per cent more for pesticide-free onions (USA, France and China), bananas (India) and flour (Sweden)
Studies have also explored how consumers perceive genetically modified (GM) food production. Mixed consumer preferences have been found, as while GM can be beneficial (for example, in reducing the need for pesticide use), consumers have indicated concern regarding the direct or indirect effects of consumption of genetically modified organisms (GMOs). In general, evidence from China and India has been mixed. Furthermore, the choice modelling review show that people were willing to pay:
In China, France, USA and Niger, 40-312 per cent more for GM-free onions
In China, 61-78 per cent more for GM-free soymilk
In Japan, 192-219 per cent more for avoiding GM-ingredients
In Canada, 49 per cent more for GM-free bison steak
Functional foods are those that offer health benefits beyond basic nutrition (also referred to as “health foods”) and this can be considered as another type of credence attribute. In China and Singapore, for example, there is growing interest on these type of functional/health foods including products designed to enhance the immune system or brain function in children, supplement basic nutrition, or assist with aspects of beauty, among others. Functional foods have also been included in some choice experiment studies, for products such for oil, bread, eggs and wine. The range of premiums that consumers were willing to pay included:
In Japan, 75 per cent more for certification of functional oil products
In UK, 19 per cent more for functional ingredients and 19-62 per cent for added health benefits in bread
In Sweden, 19 per cent more for omega-3 enriched eggs
In Spain, 58 per cent more for functional wine products
There is evidence that consumers are concerned with environmental issues, particularly with regards to food production processes. The general public’s increased awareness of and interest in environmental issues has been also noted by producers and manufacturers who include environmentally friendly and/or recyclable packaging, as well as eco-labels (which identify the environmental friendliness of a product in relation to production and distribution methods), in their products. Regarding environmental attributes, choice modelling studies indicate that people are willing to pay:
In India, 27 per cent more for low, 10 per cent for medium, but 28 per cent less for high, environmental impact in production processes
In China and India, 12-42 per cent for reduced water pollution, reduced GHG emissions and improved biodiversity in agricultural production
In UK, 3-7 per cent for reduced water pollution, reduced GHG emissions, and improved
biodiversity, in agricultural production
In USA, 73-113 per cent more for paper towels certified for “no clear cutting” and sustainable forest management
In USA, 93-189 per cent more for paper towels certified for enhanced fish and wildlife stewardship and/or reduced environmental pollution
Research from the European Union indicates that many people are concerned about the welfare of animals, with this potentially influencing their purchase decisions. In addition, comparative research between the UK, India and China has shown similar results. The reviewed choice modelling studies indicate that, for selected attributes, people are willing to pay:
In China, India, and the UK, 13-41 per cent for animal welfare certified lamb
In Sweden and Denmark, 4 per cent (beef), 32-96 per cent (pork) and 36-112 per cent (chicken) more for outdoor housing/access
In Sweden:
o 110-165 per cent more for the limitation of stock density or cessation of the mixing of unfamiliar animal species
o 38 per cent more for free-range beef, and 122-183 per cent more for free-range eggs
Other concerns for animal welfare include the use of gestation crates, fixation, low stress feeding, tail docking, castration, transporting and feed-types.
Overall, this review indicates that there exists research on credence attributes in many international markets, and that consumers place value on these product attributes. However, the review also shows a gap in the literature regarding the credence attributes in some countries, namely in Singapore and Indonesia, of interest the present wider research project.
A further element of this research project is also to develop an understanding of how firms and producers can use technology to communicate with consumers. Recent advances in online and mobile phone technologies, as well as significant increases in their use and availability to the consumers in both developing and developed countries, have highlighted their importance. Overall, global internet usage has increased between by approximately 33 per cent in the developing world, and approximately 55.5 per cent in the developed world between 2005 and 2013. In 2014, this included approximately 641.6 million users in China (46 per cent of the population), 243.2 million users in India (20 per cent), 57.0 million users in the United Kingdom (89 per cent), 42.3 million users in Indonesia (17 per cent), and 4.5 million users in Singapore (85 per cent). These methods of communication may be useful for exporters as often consumers are unaware of credence attributes in the products that they buy.
The development of new internet-based services and tools within the last decade has expanded the potential of internet use and communication, such as blogs, wikis, online marketplaces, multimedia sharing and streaming services, podcasts, Really Simple Syndication (RSS) and social media.
Online shopping (via online marketplaces) has increased in its importance to consumers internationally, with a high number of consumers claiming the regular use of these services. Fifty per cent of consumers internationally have purchased food products online. However, up to 7 per cent of total food purchases are made online in some countries. For example, online retail is increasing in Indonesia, with expected online sales increasing by 14 per cent between 2012 and 2017. Examples of online marketplaces include online auction sites (e.g. eBay or TradeMe) and large online shopping services (e.g. Amazon.com). Amazon are also increasing their offering of food products in the US, UK and Germany.
Perhaps the most significant development within the Web 2.0 framework is social media. For consumers, this has provided a platform in which they can share content, interact and communicate, and is constantly changing and adapting. In 2013, an estimated 1.73 billion users of social media were identified internationally, which is project to increase to approximately 2.55 billion users by 2017. The Asia-Pacific region currently has the largest user base with approximately 777 million users identified in 2013.
and YouTube around 91 per cent of Chinese internet users are accessing China-specific social media services such as WeChat, Sina Weibo, Tencent QQ and Tencent Weibo for an average of 47 minutes per day. In addition, Indonesia represented the world’s largest per capita user base for Twitter in 2013, with 29 million active Twitter accounts registered in Indonesia. Overall, internet users in the US, UK and Australia spent 27 per cent of total time online using social media in 2013, with Facebook indicated as the most popular social media service internationally, with approximately 1.23 billion active users in 2013. For firms and producers, social media provides a way to directly interact and communicate with consumers in a more in-depth way than previously available. In New Zealand examples of companies using social media for communicating with customers include Silver Fern Farms, Fonterra, Zespri and ENZA.
Most common social media sites are Facebook pages or Twitter that companies can use passive communication (i.e. advertising) or active communication (one-on-one public communication) to directly engage with consumers. These forums can provide some indication of brand popularity to businesses by allowing consumers to "like" or "follow" brands and products. The top brands indicated by Facebook likes and Twitter followers are Amazon and Nando’s in UK, Tata Docomo and Rendezvous Sports World in India, Batik and XL Axiata in Indonesia, and Samsung mobile and TigerAir in Singapore.
Increases in the popularity of "smartphones" have brought about a new means for consumers to interact with, generate information regarding and purchase food products globally. Integration of mobile technologies with Web 2.0 applications, “The Internet Things”, such as social media, is rapidly increasing. Current examples in New Zealand include STQRY that uses global positioning system (GPS) technology to assist the user in finding places of interest in a particular city, Fast, Fresh and Tasty cooking app, and FoodSwitch app aimed at encouraging New Zealand consumers to eat a more nutritionally-balanced diet.
The integration of "real-world" items with internet-accessing mobile devices (otherwise known as “the Internet of Things”) has shown future potential as an effective means of marketing New Zealand's food products. This allows marketers to establish a type of participative marketing, through which the consumer is "pulled" rather than “pushed” to the information. An example of this type of interaction is the QR code, which is “scanned” by the consumer via their mobile device in order to receive further information or participate in an interactive process regarding a product or brand. Research has shown that consumers prefer to scan QR codes (and similar points of interactivity) over other forms of interaction with mobile technology including more traditional bar codes.
Chapter 1
Introduction
Credence attributes of food are important to many consumers. The value that consumers place on different attributes, such as the product’s environmental and social performance and its country of origin, is likely to vary across different countries and commodities. Therefore it is important to explore consumer preferences in different markets. The literature on these values, attitudes and preferences towards different food attributes has tended to be concentrated on consumer preferences in developed country markets, and with few studies from emerging markets. New Zealand is a developed country which is heavily dependent on agricultural exports. Historically, New Zealand’s main export market has been the United Kingdom (UK) but in recent years, also China and India have gained in importance for New Zealand.
Previous research by Saunders et al. (2013) assessed consumer preferences and willingness to pay (WTP) for different attributes in New Zealand food products in the UK, India and China. The below is an extract of this 2013 paper. Firstly, Figure 1.1 below, shows the results for importance of freshness, taste, quality, price and brand attributes. A pilot survey with 100 respondents in each country found that the majority of consumers in all countries rated freshness, taste and quality as
very important. Interestingly, Indian and Chinese participants rated freshness and quality greater
than the respondents from the UK where it is likely that to exists a well-established, generally safe supply chain. Most respondents rated the product’s price as important or very important (an average of 87 per cent across all countries selected important or very important for the price) but fewer selected price as very important compared with the importance of other attributes. The brand was the least important attribute in New Zealand food products compared with the other attributes. UK consumers rated this lower (19 per cent indicating the brand is very important) than consumers from India and China with 48 per cent and 42 per cent, respectively, indicating the brand is very important.
Figure 1.1: Importance of attributes in New Zealand food products
0% 10% 20% 30% 40% 50% 60% 70% 80% 90% 100% UK In d ia Chin a UK In d ia Chin a UK In d ia Chin a UK In d ia Chin a UK In d ia Chin a
Freshness Taste Quality Price Brand
Don't Know
Secondly,Figures 1.2 and 1.3 below show the results for importance of ethical and environmental attributes in New Zealand food products. Respondents in India and China rated food safety certification as more important than respondents from the UK, with 75 per cent of Chinese and 65 per cent of Indians stating food safety is very important while only 41 per cent of UK respondents find this attribute very important in New Zealand food products. Again this is not surprising given the relatively safe value chain in the UK and recent food scares in China. Similarly, country of origin was rated more important in China (54 per cent indicating very important) and India (40 per cent indicating very important) than in the UK (29 per cent indicating very important) which may be for similar reasons. However, more surprising is that both Indian and Chinese respondents rated the product’s recyclability much more important than the UK with 27 per cent of Chinese and 45 per cent of Indian respondents rating it very important compared with only 22 per cent from the UK. Even more surprising is the rating for animal welfare and environmental quality certification with UK respondents reporting this was less important than those from India and China. For animal welfare and environmental quality, in the UK 34 per cent and 29 per cent of respondents, respectively, rated them as very important; these numbers were much higher for China and India, with 42 per cent and 58 per cent in China, and 50 per cent and 55 per cent in India rated them as very important.
Respondents from all countries described environmental quality related to food production as predominantly as an activity that does not harm the environment. Moreover, Indian respondents frequently referred to environmentally friendly, eco-friendly and pollution-free production methods; and Chinese respondents commonly commented that the activity should be
non-polluting, and they made more references to organic as indicator for good environmental quality
than India or UK respondents. With regards to describing good animal welfare Indian and Chinese respondents mainly referred to good quality of life for the animals including not being mistreated and being well cared for. Indian respondents also commented on animals being well fed as indicator for good animal welfare. In contrast, UK respondents predominantly described good farm animal welfare as free and natural treatment meaning animals are entitled to behave naturally,
and free range was a term commonly used in this regard.
Figure 1.2: Importance of ethical and environmental attributes in New Zealand food products
Thirdly, Figure 1.2 shows that the majority of consumers in the UK did not value traceability, organic, genetically modified (GM)-free and fair trade as very important, especially compared to Indian and Chinese respondents. This is perhaps not surprising for traceability given the UK supply chain, especially with New Zealand, is relatively safe. However, this is more surprising for the other attributes. Organic in particular was the lowest rated of all attributes in the UK, with only 16 per cent of respondents indicating it is very important in a food product, and two thirds of respondents not thinking of it as important. In contrast, 56 per cent of Indians and 45 per cent of Chinese stated organic was very important in a New Zealand food product. The results for GM free and fair trade were similar. Fifty four per cent of Chinese, 51 per cent of Chinese and 16 per cent of UK respondents indicated that GM-free is a very important attribute in New Zealand food products. Fair trade was seen as very important by 50 per cent of Indian respondents, 42 per cent of Chinese and 21 per cent of UK respondents.
Figure 1.3: Importance of ethical and environmental attributes in New Zealand food products
Finally, consumers’ willingness to pay for food safety, farm animal welfare, water pollution minimisation, greenhouse gas (GHG) minimisation, biodiversity enhancement and country of origin attributes were assessed using choice modelling method.
The WTP results are presented in percentages for all countries in Table 1.1. Overall, UK participants were less willing to pay extra for product certification than Chinese or Indian respondents; this again may be due to current standards already in place in the food available to UK consumers. If they do not see these issues as in question currently, they may be less willing to pay extra to assure it. UK participants showed highest willingness to pay for animal welfare certification in lamb products. They would pay 22 per cent more than the normal price for the lamb product with such certification. Chinese respondents’ showed highest willingness to pay for food safety certification in dairy products. Respondents were willing to pay 74 per cent more than the normal price. In contrast, Indians showed highest willingness to pay for food safety certification in lamb products for which they would be willing to pay an extra 77 per cent. Chinese
0% 20% 40% 60% 80% 100%
UK India China UK India China UK India China UK India China
Traceability Organic GM-Free Fair Trade
Don't Know
Not Important At All
Somewhat Important
Neither Important Nor Unimportant Somewhat Important
had the lowest WTP for lamb products that were certified of not being from China, they were only willing to pay an additional 10 per cent. In comparison, Indian respondents require a 20 per cent price reduction for dairy products that are certified of being from other countries than India. Similarly, UK respondents require a 5 per cent price discount for lamb products that were not produced in the UK.
Overall, the results of this study find evidence that consumers in the UK, China and India value different food attributes in New Zealand products. It was shown that consumers in the UK, India and China have similar preferences for quality, taste and freshness in a New Zealand product. With regards to attributes for the product’s environmental and social performance, among all countries food safety was the most important food attribute, however India and China rated food safety certification as more important than respondents from the UK. The least important food attribute for consumers in all countries was the product’s brand. An important finding was that in many cases Indian and Chinese consumers valued attributes more than in the UK, especially for environmental quality, animal welfare and recyclability.
Differences were observed for consumers’ willingness to pay for the certification of different food attributes in lamb and dairy products. While UK participants showed highest WTP for animal welfare certification in lamb products, Chinese and Indian respondents showed highest WTP for food safety certification in both, dairy and lamb products. To conclude, consumer preferences and their willingness to pay for different food attributes differ across countries.
Table 1.1: Consumers WTP for food attributes in lamb and dairy in China, India and UK
China India UK
Dairy Lamb Dairy Lamb Dairy Lamb % of product price % of product price % of product price
Food safety 74 44 73 77 16 18
Animal welfare 26 13 42 41 17 22
Water 16 12 19 26 3 7
GHG 25 14 38 39 7 7
Biodiversity 22 15 27 42 6 6
Foreign Origin 26 10 -20 - -4 -5
NZ Origin 49 24 10 21 3 6
The following report is part of a wider Maximising Export Returns (MER) research project undertaken by the AERU at Lincoln University, and funded by the Ministry of Business, Innovation and Employment. The purpose of this report is to provide a detailed international literature review on consumer preferences towards credence attributes in food products in different markets, as well as modern technology use trends in order to determine methods of effective communication with consumers. The attributes identified in this report will be used in the subsequent parts of this research project.
As stated above, this report examines trends in consumer demands for credence attributes. The credence attribute is defined as product features that that are not directly determinable via product experience (Wirth et al. 2011); hence they may not be directly observed in the physical appearance of the product or at the point of consumption. Examples of credence attributes include food safety, country of origin labelling, traceability, local food, recyclability and eco-packaging, eco-labelling, environmental quality, carbon labelling and reduction, organic, GM-free products, animal welfare, biodiversity and fair trade. Food safety is discussed first in each chapter due to its importance amongst consumers in each market. Food safety is also often associated with a product’s origin. Furthermore, a product’s origin may pertain to either country of origin or local food labelling.
In this report, consumer demand for these attributes were examined in selected key consumer markets including United Kingdom, China, India, Singapore and Indonesia. These markets were chosen due to their economic significance to New Zealand. The review included general consumer preference literature as well as literature specific to choice modelling. While extensive research exists in the consumer markets of the United Kingdom, China, and India, little research on consumer preferences toward credence attributes in Singapore and Indonesia was found. However, information sourced pertaining to these countries provides insight about their changing market dynamics, which could be of potential future interest to New Zealand. The above markets are not exclusively studied in this report. In some cases, the review was expanded to allow for the inclusion of important recent market developments within other markets and geographical regions. These were particularly those pertaining to cross-country studies and other events that shaped consumer preferences and attitudes towards, and willingness to pay for, credence attributes in food and related products. Finally, this report reviewed a number of technologies which consumers are using in everyday life. The authors would also like to acknowledge the contribution of Beef + Lamb New Zealand in providing information for Chapter 4 of this report.
Chapter 2
Market Developments
This section provides an overview of market outlooks and consumer trends in selected countries, including the United Kingdom, China, India, Singapore and Indonesia. For each country, a review of consumer preferences towards food attributes (including credence attributes) is included. “Credence attributes” are defined as features of a product that are not directly determinable via product experience (Wirth et al. 2011). Numerous studies suggest that presence of credence attributes have an impact on consumers’ buying intentions, particularly the amount they are willing to pay for a product (Dentoni et al. 2009). Alongside analyses of demand for credence attributes, these markets were chosen because of their economic significance to New Zealand. Extensive research exists in the consumer markets of the United Kingdom, China, and India, though in depth credence attribute research is lacking in Singapore and Indonesia. Country profiles of these changing markets provide insight into how these markets are developing and may be of interest to New Zealand in the future.
2.1
United Kingdom
2.1.1 Background
Table 2.1: Exports of New Zealand agricultural commodities to the United Kingdom (2013)
Commodity (or Commodity Group)
Total Export Value (NZ$000) Export Share Rank
Meat or Meat Products (Total) 578,290 3 Beef, fresh and chilled* 9,744 9 Beef, frozen products* 17,047 14
Sheep meat* 521,974 2
Cheese and curd products 18,314 15
Fruit and vegetables 70,661 8
Wine 279,351 3
TOTAL AGRICULTURAL 1,083,109 5
Source: Statistics New Zealand 2014.
*Values for commodity type are included in Meat and Meat Products (Total) and do not contribute to the total value of total agricultural exports to this market.
2.1.2 Credence attributes
The first attribute to be discussed is food safety. Concerns have been highlighted by recent food safety scares, including the incidence of horsemeat found in consumer beef products in Europe in 2013. Colloquially known as “Horsegate”, this event occurred when traces of horse meat DNA was found in beef products stocked at major UK retailers, causing many consumers to question the efficacy of supply chain logistics, as well as food safety standards. A number of surveys were conducted immediately after the scandal to explore impact on consumer shopping habits and trust in the British food safety system. A study of over 2,000 British consumers by Which?(2013), published three months after the first contamination outbreak showed that confidence in the UK safety mechanisms had decreased. This study surveyed British consumers before and immediately after the contamination event and found that there had been a significant change in consumer confidence; where 92 per cent of British consumers reported a level of confidence in UK food safety mechanisms before the event, this figure had dropped to 72 per cent post-scandal. This study also reported that consumer trust in the food industry had experienced a 24 per cent decrease since the beginning of the scandal (Which? 2013). When asked about the effect this had had on their shopping habits, 60 per cent of respondents indicated a change of shopping habits as a result of the scandal; over two-thirds of survey respondents stated that they felt that the government had been neglecting law enforcement; and half of the respondents indicated a lack of trust in food labelling information (Which? 2013). Another report by the Consumer Council published six months after the outbreak found similar results with a third of respondents indicating that their confidence in the safety of food that they purchased had declined as a result of the scandal (The Consumer Council 2013).
the National Farmers' Union a year after the events showed that public trust had increased to 52 per cent, but still remained about 20 points behind trust levels prior to the scandal (FarmingUK 2014).
The studies above show some drop of consumer confidence and trust. Furthermore, there is mixed evidence in regards to actual purchase habits. In a study published one month following the outbreak, almost half of respondents stated that the scandal had no effect on their shopping habits (Kantar 2013). The Consumer Council study published six months after the scandal also showed similar results, with 40 per cent of participants stated that they were “not affected” by the issues, and another 17 per cent were not “bothered” by them (The Consumer Council 2013). In contrast, Yamoah and Yawson (2014) analysis of supermarket loyal card data showed a constant decline in sales volume of beefburgers over the six weeks immediately following the scandal. However, in an interview with the Yorkshire Post, the Agriculture and Horticulture Development Board’s market intelligence and consumer insight manager stated that retail sales recovered a month after the scandal, despite a 20 per cent decline immediately after the event (Yorkshire Post 2013). Furthermore, Agriculture and Horticulture Development Board reported that total sales volume of British meat in 2013 had only decreased by one per cent when compared to 2012 figures (Yorkshire Post 2013).
Similarly, the 2011 outbreak of foodborne illness in Europe rendered similar consumer responses. Between May and June 2011, the European Union (and nearby markets) experienced an outbreak of E. coli (Escherichia coli) originating from bean sprouts produced in Germany. The outbreak (described by the European Food Safety Authority as the worst food-borne illness outbreak in Germany for 60 years) caused the deaths of 53 people (51 within Germany), with a total of 3,950 people affected (EFSA 2012). The location of the strain’s outbreak was found to be an organic farm in Lower Saxony, Germany, which was subsequently closed down. This particular outbreak resulted in international markets placing import restrictions or bans on German fresh produce, implementing more strict food import inspection processes, as well as taking legal action to mitigate loss of produce sales (BBC 2011; Croatian Times 2011; Deutsche Welle 2011). A study conducted by de Vocht et al. (2012) examined the reactions of 6,312 Belgian consumers to news coverage of the E. coli outbreak in order to quantify consumer food safety risk perceptions of this event. Overall, this study found that, as there were no reported clinical cases of E. coli outbreak in Belgium, consumers did not feel a need to reduce the amount of fresh produce that they consumed. In addition, when consumers’ perceived that particular fresh produce items had a high susceptibility for E. coli, a significantly reduced intention to eat fresh produce was observed (de Vocht et al. 2012).
Mintel (2013b) explored a number of factors that could increase consumer trust, with research showing that 43-48 per cent of respondents found British-made ingredients important, alongside manufacturing details (i.e., where and when products were made), animal welfare certification, and the exclusion of artificial ingredients.
Demand for British-made food products also grew following the Horsemeat scandal. A report by Mintel (2013a) compared perceptions of British consumers before and after the scandal, and found that a proportion of those who preferred British food over imported food had increased from 40 to 50 per cent, and 34 per cent of consumers agreed that this attribute was an important factor. Similarly, a third of consumers stated that they were willing to pay more for British-made after the contamination event (Mintel 2013a). Six months after the scandal, Mintel (2013b) conducted a follow-up study, indicating that consumers still preferred provenance-related credence attributes, including British-made foods. Almost half of all respondents (48 per cent) stated that presence of British ingredients was one of the top five factors that influenced their trust in a product (Mintel 2013b). In another study, over three-quarters of consumers felt that British supermarkets should sell more food produced by British farms (Smedley 2014).
Similar trends relating to food origin can be seen in increasing demand for locally produced food that are often available from retail outlets such as farmers' markets. In 2011, there were over 550 markets and 230,000 stallholders throughout the UK (FARMA 2011 as cited in Spiller 2012) with 15 per cent of UK consumers shopping regularly and another 25 per cent shopping locally 'sometimes' (Gadema and Oglethorpe 2011). In a study by Spiller (2012), participants were recruited at farmers' markets around Northeastern England and questioned about their perceptions of food being sold at the markets. The majority of respondents considered local food to be safe, high quality, and “gourmet” (Spiller 2012). Again, the Horsegate scandal also led to an increase in demand for local food. Following the scandal, 13 per cent of UK consumers stated that they were more likely to buy more locally sourced meat (Kantar 2013), while purchases of local foods increased from 17 to 21 per cent in the UK between December 2012 to March 2013 (Mintel 2013a).
In addition, functional food sales in Europe, which is another type of credence attribute, have historically been the highest in the UK (Kahl et al. 2012). There is some evidence to suggest that a more health-conscious consumer group is emerging, for example, due to the increase in the number of health-food specialty shops across the market (Verdict 2014).
UK consumers also show a preference for environmental quality credence attributes in food production. This type of information is usually presented by “eco-labels” or sustainability labels. Grunert et al. (2014) explored the relationship between consumer purchase motivation, understanding and use of sustainability labels in the UK, France, Germany, Spain, Sweden, and Poland. Compared to all other countries, the results indicate highest usage of these labels in the UK. Similarly, Aguilar and Cai (2010) assessed the effect of environmental certification labelling on UK and US consumer purchase intentions for wooden bedside tables. Results showed that products with an eco-label were preferred 4-16 times more than those without one within both US and UK consumers. Moreover, the UK respondents preferred products that were certified by a non-governmental organisation over government certification. UK consumers also showed a higher belief in the need for certification in the harvest of tropical forests versus temperate forests, consistent with Kozak et al. (2004) (as cited in Aguilar and Cai 2010) who found that consumers express a negative preference toward tropical wood products due to the perception that environmental forestry practices are poor in these areas. Both US and UK consumers expressed a preference that was 37 and 40 per cent lower, respectively, when a tropical product was labelled with country of origin compared to a product without this information. In total, UK consumers had stronger attitudes toward certified products than their US counterparts and they also had stronger desires for environmental certification of tropical and temperate wood products (Aguilar and Cai 2010).
Similarly, consumer preference for sustainably labelled seafood has been explored. UK consumers pay, on average, a 14 per cent premium on fish with a sustainable eco-label issued by the Marine Stewardship Council (Roheim et al. 2011). Brécard et al. (2009) conducted research of over 5,000 European consumers of fish products and found that the demand for eco-labelled seafood was also influenced by desires for other attributes (e.g., freshness and origin information) and whether the fish was wild caught or farmed, as well as price. The study also showed that consumers that mistrusted fishery regulations were more likely to favour private ecolabels, and that the ‘green fish consumer’ (described as a consumer likely to purchase these products) is typically an educated woman who is knowledgeable about marine conservation issues (Brécard et al. 2009).
indicated that black-labelled sales decreased by 6 per cent and green labelled sales increased by 4 per cent over that time. A substantial change was not seen until green-labelled products were made the cheapest, with 20 per cent of consumers switching from black- to green-labelled products (Vanclay et al. 2011). Another study on carbon labels in supermarket own brand products in a large UK supermarket showed that a trial of carbon labels had no significant impact on sales to shift from high carbon to low carbon products (Hornibrook et al. 2013).
Conversely, a high level of awareness and consumer willingness to pay to offset carbon emissions in air travel has been noted. In one study, Brouwer et al. (2008) interviewed 349 passengers in an airport-intercept survey. Of these, 18 per cent were British. They found that UK and Dutch passengers were significantly more aware of the connection between air travel and climate change, with British passengers more concerned than passengers of other nationalities. British passengers also placed a higher value on the environment than other issues, such as employment, health or the economy. Moreover, 80 per cent of European passengers were willing to pay an additional tax on top of their plane ticket for an offset program funding tree-planting. Of all passengers, only 14 per cent protested this tax, offering the justification that they did not believe the tax would make a significant difference. Passengers from North America, Asia, and Europe were willing to pay € 16-27 per flight, where passengers from Europe were highest. On average, all passengers were willing to pay € 23 per flight (Brouwer et al. 2008).
The next credence attribute of consumer concern is organic. Annual sales of organic products in the UK had witnessed its first growth since 2008 (Best 2014). Organic food sales increased by almost 3 per cent to a total of £1.79 billion as of January 2014. Sales of meat, fish, and poultry increased by 2 per cent, vegetable sales increased by 3 per cent, and dairy sales increased by 4 per cent (Best 2014). The provision of locally-grown food as ‘organic’ has been indicated as a strong purchase motivator for UK consumers, and an attribute that influenced their decision to shop at the farmers’ market (Spiller 2012). Therefore, organic certification labelling can affect consumer attitudes. There is also evidence to suggest that health-conscious consumers are increasing their purchases of organic foods, with major UK retailers reporting significant increases in sales of organic products (Doward 2014). Garcia et al. (2010) evaluated supermarket loyal card data of 1.2 million UK supermarket shoppers and conducted focus groups to assess the use of labels in purchase decisions. Their study revealed that consumers purchased organic products for reasons other than concern for the environment, such as health (no pesticide use) and as an extension of a healthy lifestyle (Garcia et al. 2010).
The effects of the provision of animal welfare information on consumer perceptions and/or WTP has been assessed in a number of studies. Ellis et al. (2009) administered questionnaires to the general public in central Scotland and northern England to evaluate consumer awareness of UK dairy production methods and animal welfare issues. Half of the respondents indicated that they felt that the UK had a positive animal welfare situation, most respondents (93 per cent) were willing to pay more for the maintenance of “good dairy welfare”. However, despite nearly every respondent stating that they were willing to pay for animal welfare, two-thirds of respondents also wanted more information on food production (Ellis et al., 2009). Similarly, Napolitano et al. (2007) administered yogurt taste tests with and without information on various levels of animal welfare to UK consumers. For each product, consumers expressed a higher WTP for products that were labelled with high animal welfare standards compared to those labelled with lower welfare standards (Napolitano et al. 2007). Nocella et al. (2010) study of willingness to pay for farm animal welfare rendered similar results, wherein researchers analysed responses from over 25,000 European consumers (of which 12 per cent were British), with the majority (over 80 percent) expressing that animal welfare improvement was ‘very important’.
Another notable ethical attribute that has shown positive response from UK consumers is Fair Trade. This attribute is a trading partnership which aims to provide ‘fair prices’ to producers, mostly in developing markets, and improve conditions for sustainable development of disadvantaged producers (Poelman et al. 2008). By the end of 2011, the Fair Trade market in the United Kingdom had reached over £1billion in retail sales (Yamoah et al. 2013a). Sales of Fairtrade products in the UK had risen by 14 per cent in 2013, representing increases in sales of Fair Trade-certified products of 316 per cent for fresh produce, 52 per cent for chocolate, and 25 per cent for sugar products (Askew 2014d).
Increased sales of Fair Trade products in the UK mirror stated consumer preferences. Research conducted by Nandonde (2012) showed that credence processing attributes described as ‘ethical’ (including Fair Trade) are strong influencing factors on consumer purchase intentions. After interviewing over 200 Fair Trade-knowledgeable consumers recruited in Newcastle about their preferences in coffee, results showed that ethical process credence attributes were the most influential in consumer purchase intention, with ‘Fair Trade’ having the highest influence.
Yamoah et al. (2013a) explored Fair Trade buying behaviour through loyalty card data in order to understand which market segment purchase Fair Trade products. Their results showed that Fair Trade products do not present an equal appeal to all consumer segments, with affluent consumers, young families and older families showing higher appeal, and young adults (students included) in the low appeal category. Based on these findings, it is suggested that, due to the differences in consumer segmentation, shifting focus on marketing activity to consumer segments willing to pay a premium would be well advised, as opposed to continuing attempts to ‘mainstream’ Fair Trade products (Yamoah et al. 2013a).
2.2
China
2.2.1 Background
The People’s Republic of China is currently the world’s most populous country, with a population of 1.35 billion (estimate for July 2014). At present, the total gross domestic product (GDP) of China sits at US$13.39 trillion (2013 estimate) – the third-highest country in terms of GDP in the world – with a real growth rate of 7.7 per cent (2013 estimate). In addition, GDP per capita for Chinese consumers was estimated at approximately US$9,800 in 2013 (CIA 2014b).
China has become a major export market for New Zealand, and now ranks as New Zealand’s second-largest export market (NZT 2014), as well as the largest export market for New Zealand agricultural products. The signing of a Free Trade Agreement with China in October 2008 has led to a significant overall increase in trade between New Zealand and China. Trade values for specific New Zealand agricultural commodities to China in 2013 are shown in Table 2.2 below. This table demonstrates that New Zealand’s agricultural exports to China was valued at NZ$6.98 billion in 2013 – a 55 per cent increase from the previous year. In addition, China held the top position of total export value for sheep meat, dairy, milk, cream and butter products from New Zealand, as well as holding status as New Zealand’s second-largest export market for frozen beef products, meat products overall, and fruit and vegetable products. China is also New Zealand’s third-largest export market for cheese and curd products (Statistics New Zealand 2014). The overall ranking of this market in total value of exports for the specified commodity groups are also shown in Column 3 (Export Share Rank), with the number 1 representing the highest total export value.
Table 2.2: Exports of New Zealand agricultural commodities to China (2013)
Commodity (or Commodity Group)
Total Export Value (NZ$000) Export Share Rank
Meat or Meat Products (Total) 1,025,554 2 Beef, fresh and chilled* 3,893 19
Beef, frozen products* 185,741 2
Sheep meat* 669,094 1
Dairy (Total) 4,752,670 1
Milk and cream** 4,029,670 1
Butter** 267,757 1
Cheese and curd products** 117,678 3
Fruit and vegetables 119,428 2
Wine 20,993 6
Source: Statistics New Zealand 2014.
*Values for commodity type are included in Meat and Meat Products (Total) and do not contribute to the total value of total agricultural exports to this market.
**Values for commodity type are included in Dairy (Total) and do not contribute to the total value of total agricultural exports to this market.
There is significant evidence to suggest that China has a substantial number of wealthy consumers interested in purchasing premium goods. In 2012, it was estimated that China was home to 50 million affluent consumers, with this figure expected to increase to approximately 280 million people by the year 2020 (BCG 2012). Furthermore, wealthy Chinese consumers have linked the purchase of premium and/or luxury goods to a symbolic conveyance of personal success and prestige. These trends are most marked in major cities in China, where types of luxury products types is expected to diversify by the year 2020 (BCG, 2012). This is in line with retailer behaviour in this market, with US retailer WalMart’s strategic outlook shifting to focus for its’ 400 Chinese supermarket outlets on wealthy Chinese consumers in major cities over general public (Riley 2014).
2.2.2 Credence attributes
The first attribute to look into is food safety, an important one in China. Food safety issues in the Chinese market have led to scepticism of the domestic food industry, and to increases in consumer concern for food safety. A survey with over 1,000 respondents showed that two-thirds of respondents ranked food safety as their dominant social concern, over high consumer prices and government corruption (Pan 2012 as cited in Bai 2013). Similarly, Zheng et al. (2013) surveyed urban consumers on their preferences for food attributes and found the food attributes that were considered as most important were not those related to taste or texture, but those related to food safety such as the minimal use of preservatives and pesticides and low chance of foodborne illness.
The Chinese food market has experienced a number of food safety scares in recent years. This includes incidences of tainted meats and dairy products, such as US retailer Wal-Mart’s “fox meat scandal”, wherein fox DNA was found in stocked delicacy donkey meat products in 2014 (Jourdan 2014). Perhaps one of the most significant incidents regarding food safety to New Zealand within the Chinese food market was Fonterra’s botulism scare. In August 2013, Chinese authorities declared a ban on all Fonterra products entering the Chinese market after Fonterra suspected the incidence of a type of bacteria that can cause botulism in a batch of whey protein powder. The batches in question were produced in May 2012 in a New Zealand-based processing plant, which was found to have an incidence of the bacterium clostridium botulinium, with authorities finding unacceptable levels of the bacteria at the processing plant site in late July 2013. As a result, international partners using Fonterra raw materials also recalled products, including Danone and Nutricia, and Fonterra experienced a complete import ban from China (Askew 2013a). While the products themselves contained no incidence of harmful bacteria, Fonterra faced import bans from other international markets including Russia, Belarus and Kazakhstan that were later revoked by governing bodies in these markets (Best 2013).
This may be due to a perception of industrialised farming systems as being more modern and therefore more able to guarantee quality and safety than family-run operations (Dutra de Barcellos et al. 2013). In relation to animal welfare, Zhao and Wu (2011) surveyed over 260 visitors to Chinese zoos in order to explore consumer understanding and WTP of animal welfare. Researchers found that though 58 per cent of respondents had heard of the term ‘animal welfare’, there was a low level of understanding of the concept with 80 per cent of the sample having a low understanding or no understanding (Zhao and Wu 2011). However, the majority of the sample (88 per cent) agreed that people should pay more attention to animal welfare, and 85 per cent responded positively towards the creation of animal welfare legislation. When asked about WTP for animal welfare improvements, the majority (90 per cent) favoured paying to improve animal welfare. Education and income had an effect on all factors, while age and career type had an influence on awareness and understanding (Zhao and Wu 2011).
The Chinese government has recently introduced a number of food safety assurance schemes including a system of food labels. However, many consumers have limited trust, as well as limited recognition, understanding and trust in the authenticity of these labels (Sun and Collins 2012; Liu et al. 2012). Consumers have indicated a level of distrust of these certifications, suspecting that they can be fraudulent or attained without meeting the necessary standards and, in general, not trusting the government’s ability to uphold these standards (Sun and Collins 2012). However, consumers still seem to prefer some sort of certification than nothing at all (Sun and Collins 2012). Han et al. (2012) also showed that, although there is a demand for certified safe products in China, factors such as price and income constraints, and perception of safety risks in the market have significant impact on purchase intention of these products.