EFFECTS OF SPLIT APPLICATION OF NITROGEN ON TILLE RING IN SUGARCANE
K.K. SRIVASTAVA AND ASH OK KUMAR
Indian Institute of Sugarcane Research, Lucknow-226 002
Revised : September 15, 1984
SUMMARY
Results from pot culture experiments revealed that split application of urea induced higher tiller production in the genotypes of sugarcane viz. Co 1148 and CoS 510, coupled with drastic reduction in plant hight. inter-nodal length and tiller mortality. It was also found possible through split application of nitrogen to maintain a N index of 2.0 percent in leaf throu-ghout the experimental period and thus restrict the plants to shift to the next stage in sequence.
INTRODUCTION
In sugarcane, nitrogen is important in initiation and further development as well as maintenance of tillers which at harvest form millable canes. Nitrogen content in the index tissues has been related to the number of tillers produced (Anon., 1947, 48 and Singh, 1977) and also the yield (Anon., 1975 and Lakshmi-kanthan et a/., 1960). Considering these, the present study was undertaken to study the effect of split application of nitrogen on subsequent tillering and other growth characteristics of sugarcane.
MATERIALS AND METHODS
Single bud settlings of two cu!tivars of sugarcane (Saccharum tri-species complex) viz. Co 1148 and CoS 510 were raised in large galvanised pots (2, x2' X2.5') in the autumn season of 1974-75. Basal application of nitrogen as urea @ 150 kg N ha-1 and two split applications of nitrogen @ 75 and 150 kg N ha-1 constituted the three treatments. In split application, 24 equal doses
@ 75 and 150 kg N ha-1 were given at an intervals of 10 days commencing from lOth March to 30th November during the cropping season.
TILLERING IN SUGARCANE 329
described by Krebs (1972), was used to compute innate capacity to produce tillers and prevent mortality. Total nitrogen content in index tissue, (3,4, 5 and 6th leaves) was determined during mid July and mid November by micro-Kjeldhal method (Paech and Tracey, 1956).
RESULTS AND DISCUSSION
Tiller production :
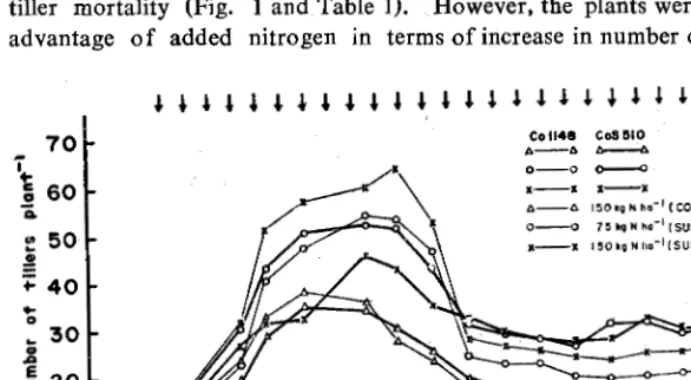
Split application of nitrogen enhanced tiller production and reduced tiller mortality (Fig. I and Table 1). However, the plants were unable to take advantage of added nitrogen in terms of increase in number of millable canes
70 i~
~ 60 Q.
~50 :! ~ 40 ....
0
.. 30 _g
~ 20 t! t!
g
10 ::EJ ' ' '
~
J J~
.&. '~
'~
.&. l J l ,J. ,J. .&. l J ,J. l ,J. ,J.Appll~tlon
Coll48 CaSillO
A A
-o - -o ~
• - • x - x
6 - 6 150koNho-1(CONTR~L)
o - o 70ioqNh•- 11SUSTAINEDI
a - x 150 ko N hG-1( SUSTAINED)
Nitroc:~en (S}
ol.~M~o-,~--A-p-,~-M-o-y~--J-u-n~--Ju-1~--A-ug~~S~e-p~~O~c~t~~No-v~~O~e~c~
Months
Fig. 1. Influence of split application of nitrogen on tillering in sugarcan cultivars.
and cane weight. Number of tillers at harvest (TH), at 150 kg ha-1 (basal
application) was largely compensated for maximum tiller pro'duction (Tmax) in this treatment by split application of nitrogen. This compensating mechanise was more pronounced in the cultivar, CoS 510 than in Co 1148. It is also evident that with split application of nitrogen attainment of Tmax (Fig. 1) was shifted which further increased with increase in nitrogen application.
w
::;
Table 1. Effect of split application of nitrogen on tiller production, mortality and proportion of immature canes Treatments Tmax/ %change TH per %change Me per %increase %of Mortality Stalk plant relative to plant relative to plant relative to immature (%) height ~ control control control canes (om)~ 1:12
A.
Co
1148
::c
-
<(a)
Control
> 1:12
(150 kg N ha-1) 38.2
-8.2 -8.2 9.0 79.0 82.3 >-l-> <
(b) 75 kg N ha-1S 54.2 (+) 41.8 24.0 (+) 192.7 14.6 (+) 78.0 65.2 63.1 80.8 > (c) 150 kg N ha-1 S (+) 68.5 28.4 (+) 263.3 16.6 > 64.4 (+)102.4 71.1 55.8 64.2
z t:l >
B.
CoS
510
1:12 :I:
(a}
Control
0 ~
(150 kg N ha-l) 35.5
-17.8 -11.0 -61.8 53.4 92.1~ c:::
(b) 75 kg N ha-l S 52.4 (+) 47.6 33.2 (+) 80.9 19.6 (+)78.1 69.4 36 6 91.7
a::: >
TILLERING IN SUGARCANE 331
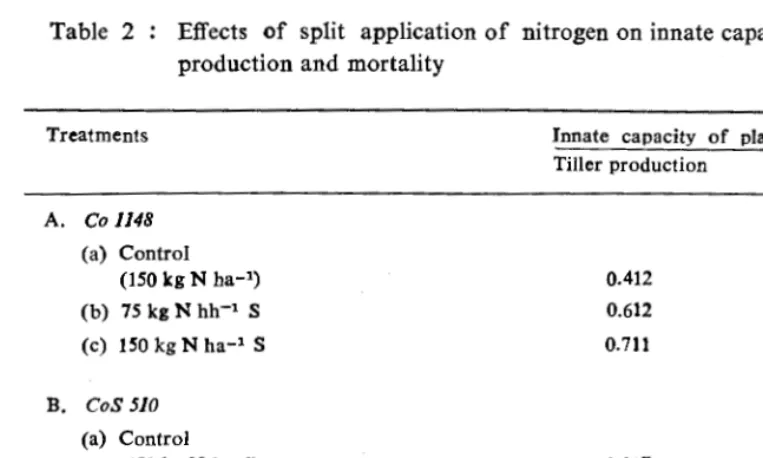
Table 2 Effects of split application of nitrogen on innate capacity for tiller production and mortality
Treatments
A. Co 1148
(a) Control
(150 kg N ha-1)
(b) 75 kg N hh-1 S
(c) 150kgNha-1 S
B. CoS 510
(a) Control (150 kg N ha-l)
(b) 75 kg N ha-l)
(c) 150 kg N ha-l) S
Innate capacity of plants for
Tiller production Mortality
0.412
0.612
0.711
0.317
0.581 0.570
0.612 0.413
0.310
0.541
0.411
0.371
Nitrogen content in index tissues in relation to tiller production :
Split application of nitrogenous fertilizer increased nitrogen content in index tissues. This increase in nitrogen was positively related to maximum tillering (in Co 1148, r=0.9509** and in CoS 510, r=0.8412**) and number of millable canes per plant (in Co 1148, r=0.6978* and CoS 510 r=0.5927*). These confirm the observation made by earlier workers (Anon, 1947-48 and Singh, 1977). Thus, tillering appears to be a function of nitrogen in index tissues rather thah a phasic development. Regression equations for the dependencs of till-ering on leaf nitrogen (Table 3) may be used conveniently for predicting tilltill-ering performance at a particular leaf nitrogen level.
Cane weight and internode length :
Mean cane weight per plant increased with 75 kg N ha-1 (S) N compared
to control (150 kg N ha-1 basal application) and decreased with increasing dose
of split application of nitrogen (Table 1). Both the cultivars exhibited simillar trend. Besides, mean internodal length and weight per millable cane decreased with increasing split application of nitrogen.
Quality components :
Table 3 Relationship between tissue nitrogen content and tiller production Treatments A. Co 1148 (a)
Control (150
kg N ha-1 ) (b) 75 kg N ha-l S (c) 150 kg N ha-1 S B. Cos 510 (a)
Control (150
kg N ha-l) (b) 75 kg N ha-1 S (c) 150 kg N ha-1 S LeafN% D.W. July November (a) (b)
1.20 2.16 2.44 1.36 2.13 2.18
1.19 2.00 2.41 1·23 2.13 2.13
Tmax 38.2 54.2 64.4 35.5 52.4 46.0
Me 8.2 14.6 16.6 11.0 19
6 18.4 As<odation of T max and Me with leaf nitrogen in July Correlation coefficient (r) Regression equation (i) a 0.5 Tmax + 0.9509** (ii) a VS Me (i) a VS Tmax + 0.8412** (ii) a VS Me Y
=
-13.0754+31.3170 X Y .., -1.8284+ 7.6819 X Y = -ll.6833+28.0841 X Y=
-2.4239+ 9.9108 X Over all (pooled/or varieties) (i) a vs Tmax Y = -6.3422 + 27.0697 X + 0.8470** (ii) a vs Me y =-0.0723 + 7.2594 X + 0.7472**TILLERING IN SUGARCANE
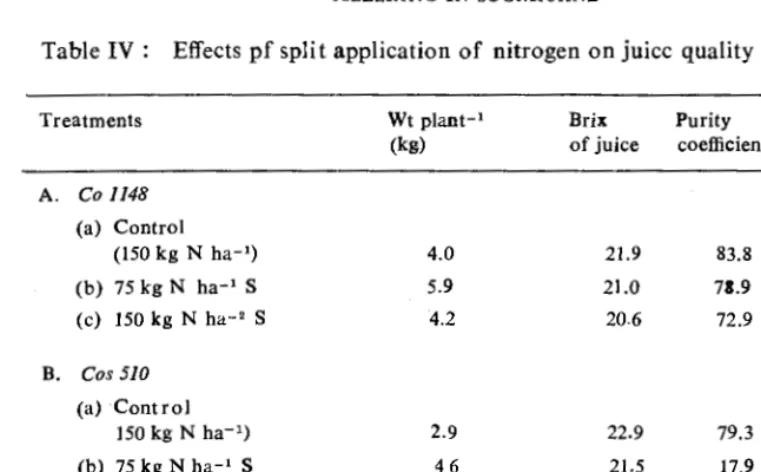
Table IV : Effects pf split application of nitrogen on juice quality
Treatments
A. Co 1148 (a) Control
(150 kg N ha-1
)
(b) 75 kg N ha-1 S
(c) 150 kg N ha-2 S
B. Cos 510
(a) Control 150 kg N ha-1
)
(b) 75 kg N ha-1 S
(c) 150 kg N ha-1 S
Wt plant-1
(kg)
4.0
5.9
4.2
2.9
46
4.1
Brix of juice
21.9
21.0
20.6
22.9
21.5
20.1
Purity coefficient
83.8
78.9
72.9
79.3
17.9
73.4
333
Pol%
17.79
17.09
15.88
18.84
17.79
15.38
Earlier studies also indicate that excess of nitrogen has a detrimental effect on quality of juice in sugarcane (Clements, 1958) and in sugarbeet (Ulrich et al.,
1959).
REFERENCES
Anon. (1947-48). Ann. Rep. of Sugarcane Res., U.P., Sahjahnpur.
Anon. (1975). Plana! Sucar, Ann. Rep. Exptal. Stn. pp. 64.
Clements. H.F. (1958). Quality in Hawaiian Sugarcane. Hawaii Agr. Expt. Stn. Prog. Notes. 115.
Krebs, C.J. (1972). In Ecology, Harper and Row Publication, N.Y. Evanston, Sanfransis London. pp. 694.
Lakshmikantham, M., Sura Narayna, J.V.V. and Prasada Rao, K.K. (1960). Studies in methods of nitrogen fertilization to sugarcane at Anakapalle. Proc. 4th All Ind. Conf. Sug. Cane Res. & Dev. workers (A.P.) pp. 85-96.
Peach, K. and Tracey M.V. (1956). Modern Methods of Plant Analysis Vol. I pp. 479-481. Singh, V.S. (1977). Nitrogen and sugarcane x correlation between leaf N and tillering.
Indian Sugar., 27 : 449-450.