
_____________________________________________________________________________________________________ 3(1): 1-9, 2019; Article no.SAJSSE.47436
Economic Development versus Social Development:
In the Case of Sri Lanka
Wasantha Rajapakshe
1*1
SLIIT Business School, Sri Lanka Institute of Information Technology, Malabe, Sri Lanka.
Author’s contribution
The sole author designed, analysed, interpreted and prepared the manuscript.
Article Information
DOI: 10.9734/SAJSSE/2019/v3i130096
Editor(s):
(1) Dr. Alexandru Trifu, Professor, Faculty of Economics, “Petre Andrei” University of Iasi, Romania.
Reviewers:
(1) Dr. Bharat Raj Singh, Dr. APJ Abdul Kalam Technical University, India. (2)Emmanuel Etim, National Open University of Nigeria, Nigeria. Complete Peer review History:http://www.sdiarticle3.com/review-history/47436
Received 22 October 2018 Accepted 13 February 2019 Published 07 March 2019
ABSTRACT
Aims: After the independence from British in 1948, all successive governments have operated welfare programs as a development strategy. The objective of this paper is to investigate and analyze the major food subsidy programs which are functioned until today and check their effectiveness with regards to the two meaning of development; traditional and modern meaning. Study Design: This is survey research based on secondary data and involved an extensive literature review on the area of concern to provide an overview of the social welfare programs and economic impact of Sri Lanka.
Methodology: For this study therefore data collected from various published sources and analyzed with descriptive statistics and presented as graphs, percentages to show the trends.
Results:It is not the attention to conclude this investigation with purely negative opinion. However,
Sri Lanka has not enjoyed sustainable health growth rate after the independence. Except for occasional booms, which had for only 2-3 years in early 1980s’. Therefore according to the traditional meaning of development, clearly Sri Lanka is a less developed country.The decades of welfare policies act as a development strategies in modern point of view. Sri Lanka always considers as a model country. Comparing developed countries, Human Development Index (HDI) in Sri Lanka has a higher rank. Is that mean Sri Lanka is a developed country? According to the two doctrine, development is not only economic growth but also human development. It is essentially a mix tasks. Therefore, Sri Lanka Experience confirm that the fact that neither purely
Rajapakshe; SAJSSE, 3(1): 1-9, 2019; Article no.SAJSSE.47436
welfare policies nor even growth oriented policies supported by welfare programs can be a substitute for more upfront institutional measures for overcoming poverty and inequality and development of a country.
Keywords: Economic development; social development; Sri Lanka.
1. INTRODUCTION
The purpose of this study to examine how social poverty alleviation programs in Sri Lanka affected to economic development of the country. Development become an increasingly important issue in recent years as problems of poverty, inequality, and unemployment in less developed countries (LDCs) have subjected to searching examination. In response, time to time these countries have adopted various development strategies based on earlier models used by developed countries to overcome problems in these areas. However, these earlier models have not always succeeded in the one other country not even throughout the countries. Moreover, those model have not worked successfully during one period necessarily had a same degree of success during another [1]. This has been the case in Sri Lanka too as in other countries, where a variety of theoretical doctrines have articulated cause of the “development” from different perspectives. Basically economist have different arguments when defining the term “development”; traditional meaning and modern or new meaning of development.
1.1 Traditional Meaning of Development
The ‘traditional meaning of development’, emerged during 50s and 60s. During these periods, the standard measure of economic development used by traditional economist were growth in Gross national product (GNP), Gross Domestic Product (GDP), and Growth of per capita GNP etc. [2]. Those amongst the development consensus of rapid industrialization via a shift from agriculture to manufacture and services. On the other hand, during the same period, economist usually measured develop-ment in terms of only one leading economic indicator- per capita or national income.
1.2 Modern Meaning of Development
However, beginning in the 70s, and continuing the decade, which followed Seers and most other theorist like Todaro, Bryant & White engaged that economic growth is different from development sense [1,3,4]. They argue that, even this growth
indicator alone did not sufficiently encompass the full meaning of development because when a country increased its national income, it could and indeed often did lead to an increase in social and political problems. Hence, the emergence of a broader view of economic development taking in to account the necessity of creating the conditions for the fuller realization of human capabilities. Todaro defined development as a “multi-dimensional process that involves major changes in social structures, popular attitudes and national institutions…economic growth, reduction of inequality, and eradication of absolute poverty” [3]. This ‘modern meaning of development’ is concern welfare of the community, which can be enhanced their living standards.
Sustainable development is another fairly new development paradigm. All of the above approaches emphasis that the development should not only result from economic development but also from social development. So, how could we define development? In fact, development is a multidimensional process of increasing economic growth while increasing living standards. Eliminating poverty is one of the most crucial issue for any country which is undergoing development. Accordingly, social welfare is one of the most important area discussions in examining the social aspects of development.
Welfare programs is a major agenda of all successive government from the independence in 1948 in Sri Lanka. Social development in Sri Lanka, even started before the independence. During colonial governments also practiced social welfare systems in Sri Lanka, then called as Ceylon. Under the welfare program, food subsidies, subsidies for agriculture, free education and health, price control for essential items as well as nutrition supplements programs for school children as well as infant, nursery mothers and pregnant mothers are included [5].
Rajapakshe; SAJSSE, 3(1): 1-9, 2019; Article no.SAJSSE.47436
successive governments. After the independence from British in 1948, political power in Sri Lanka has basically shifted between two major political parties. Even though they have different perspectives about the political vision, in office both have operated welfare programs as a development strategy. The objective of this paper is to investigate and analyze the major food subsidy programs which are functioned until today and check their effectiveness with regards to the two meaning of development; traditional and modern meaning.
2. LITERATURE REVIEW
2.1 Welfare Programs in Sri Lanka
2.1.1 Food ration shop scheme (FRSS) 1948 1978
The major welfare program in relation to basic food supplies called the Food ration Shop Scheme (FRSS) was introduced to the benefit of people throughout Sri Lanka by government in 1948. Rice was the major food subsidy item followed by sugar, wheat flour, and milk powder for infants and children. Most than 90% of the population was benefitted from this program [6]. Rice was the main subsidy and 4 pound per week was given for each person. Out of 4 pounds 2 were free of charge. This scheme became very sensitive issue for the political field. To cover up the budget for the schema, price was increased for the paid portion and income tax payer were excluded from the scheme. In 1978, new government came into power and reduced number of beneficiaries up to 50% beneficiaries who had received FRSS under previous government [7].
2.1.2 Food stamp program (FSP) 1979-1985
By the time the country began to feel the pressure of increase in population that was due to successful free health service and food subsidy programs, it was politically explosive to attempt to modify these programs. On the other hand increase of the population directly affected to the increasing cost of the FRSS, in September 1979, the government replace it with Food Stamp Program (FSP), which had the advantage of a fixed nominal value. Under this program, recipients were limited to annual income ceiling. In 1979 it was decided Sri Lanka Rs. 3600 as a margin and provide food stamp accordingly [8]. Furthermore, if they were unable to spend the total value of the food stamp, they were
permitted to deposit the unused food stamps in the Post Office Savings Bank [8].
2.1.3 Janasaviya program (JP) 1989-1996
In 1989, FSP has replaced by Jansaviya Program called as people’s strength program. This is different from previous two programs. Jansaviya not directly provide free subsidy, instead it was considered as income transfer program. Moreover, to receive the benefits, beneficiaries have to work voluntarily and it was compulsory too. Beneficiaries received Rs. 2500 and part of it can use for food and consider as human development and another potion for compulsory savings for their future investment [9].
2.1.4 Samurdhi Program (SP) 1996- up to date
The Samurdhi Program consider as beneficiaries prosperity, was launched in 1996, and it is very similar to Janasviya program. Under this program beneficiaries are householder with less than Rs. 1000 per month. Under this program, food stamp were issued as well as nutritional stamp also issue for need mothers since 2008 [10]. Under this program also introduced forced saving out of their benefits and allowed them to deposit food stamp if they do not use in the Samurdhi Bank [11].
2.2 Measures of Economic Development
2.2.1 Traditional meaning of development
2.2.2 Modern meaning of development
However, recently economist like Clark, Kindleberger, Hersick etc. proposed that economic welfare as a development
the welfare, it has recognized basic necessities of life, education, health employment and equity in the distribution of income and wealth as development measures. At present, many such type of indexes are used. Morris D. Morris identified three such indicators as life expectancy at age one, infant mortality and literacy, to construct a simple composite index called Physical Quality of Life Index (PQLI)
Development Index (HDI) in 1989 introduced in Human Development Report [19] by UNDP Social Accounting Matrices was supported by (SAM) [20,1].
3. METHODOLOGY
This is survey research based on secondary data and involves an extensive literature review on the area of concern to provide an overview of the social welfare programs and economic impact of Sri Lanka. For this study therefore data collected from various published sources such as central bank reports in Sri Lanka, various annual reports, relevant books, peer journals, and also current
Fig. 1. Economic growth, capital investment and in welfare expenditure (%)
Source: Central
Rajapakshe; SAJSSE, 3(1): 1-9, 2019; Article no.
development
However, recently economist like Clark, etc. proposed that economic welfare as a development [18]. Under the welfare, it has recognized basic necessities of life, education, health employment and equity in the distribution of income and wealth as development measures. At present, many such of indexes are used. Morris D. Morris identified three such indicators as life expectancy at age one, infant mortality and literacy, to construct a simple composite index called PQLI) [18], Human n 1989 introduced in
by UNDP and Social Accounting Matrices was supported by
This is survey research based on secondary data and involves an extensive literature review on the area of concern to provide an overview of the social welfare programs and economic impact of Sri Lanka. For this study therefore data collected published sources such as central bank reports in Sri Lanka, various annual reports, relevant books, peer journals, and also current
electronic publications (valid websites). The study presents the 70 years’ experience of welfare policies in Sri Lanka from 1948
Collected data is analyzed with descriptive statistics and presented as graphs, percentages to show the trends.
4. RESULTS
4.1 Economic Growth and Investment
In 1955 GDP growth average about 5.8% and it was changed in 1960 to 3.7% and
averaged 3.1%. The annual growth rate of GDP in constant prices in 1970 3.9% and in 1975 declined to 2.8 but in 1978 with the new government came in to power the rate reached a strong 8.2%. After introducing FSP in 1979, it showed 6.3 and in 1980 again reduced slightly to 5.8% in 1985, 5% and in 1990 6.2% a slightly increased again [21,22].
In 1989, with the introduction of Janasaviya and then 1996 Samurdhi program, it showed similar fluctuations in GDP rates. In 1995 it was 5.5%, and up to 2010 showed gradual increased like in 2000, 6%, in 2005, 6.2%, in 2010, 8%. However, after new government came into power it again
Fig. 1. Economic growth, capital investment and in welfare expenditure (%)
Central Bank Reports; the World Bank, [21,22]
; Article no.SAJSSE.47436
electronic publications (valid websites). The study presents the 70 years’ experience of m 1948 – 2018. Collected data is analyzed with descriptive statistics and presented as graphs, percentages
4.1 Economic Growth and Investment
In 1955 GDP growth average about 5.8% and it was changed in 1960 to 3.7% and in 1965 it was averaged 3.1%. The annual growth rate of GDP in constant prices in 1970 3.9% and in 1975 declined to 2.8 but in 1978 with the new government came in to power the rate reached a strong 8.2%. After introducing FSP in 1979, it n 1980 again reduced slightly to 5.8% in 1985, 5% and in 1990 6.2% a slightly
In 1989, with the introduction of Janasaviya and then 1996 Samurdhi program, it showed similar 1995 it was 5.5%, and up to 2010 showed gradual increased like in 2000, 6%, in 2005, 6.2%, in 2010, 8%. However, after new government came into power it again
showed decline in 2015 3.8% and in 2017 again up to 3.1%. The pattern of GDP rate fluctuation shows that even though government expenditure allocation for food subsidy was reduced, economic development ration, GDP was not influenced. Moreover, it was clearly s
with the new regime came in to power in 1978, 1990, 2010, and 2015 GDP was popped up
The investment for the Capital expenditure pattern as a percentage of GDP during 1950 was 10.7% and raised to 14.1% in 1960 and again reduced to 12.5% in 1965. It was again increased to 20% in 1978 and rapidly shifted to 33.8% in 1980. From 1985 up to 2017 it showed that slightly fluctuated was not drastica improved other than 2017 [21].
This shows that, during the FRSS up to 1978, there is no noticeable fluctuation in GDP growth rate and investment for welfare program. Each and every budget has allocated higher ratio for FRSS program might be the reason for stable type of growth pattern. Until 1978, higher percentage from GDP such as 9.8% in 1960, 13.6% in 1965, 12.4% in 1970 and 8.1% in early 1977 were allocated for FRSS welfare program [21].
Thereafter, in 1979, the FRSS program shifted to FSP. Meanwhile expenditure, which was allocated for food subsidy was reduced to 2.4% out of GDP in 1980. In 1980, it showed that the
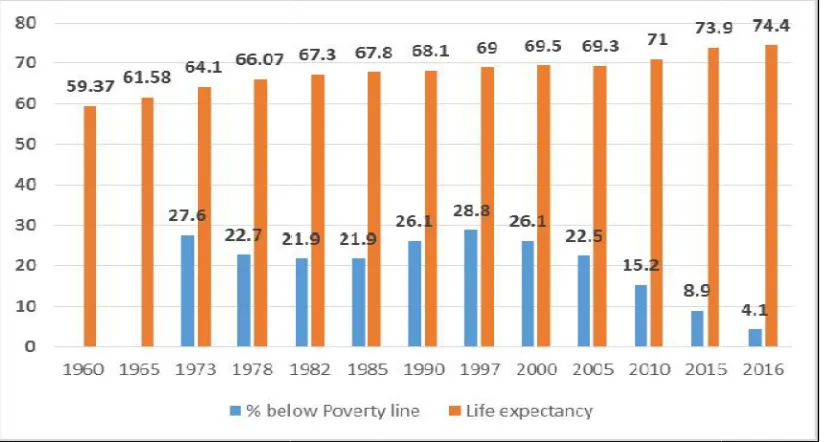
Fig. 2. Poverty and life expectancy
Source: Knoema- World Data Atlas;
Rajapakshe; SAJSSE, 3(1): 1-9, 2019; Article no.
decline in 2015 3.8% and in 2017 again up to 3.1%. The pattern of GDP rate fluctuation shows that even though government expenditure allocation for food subsidy was reduced, GDP was not influenced. Moreover, it was clearly showed that with the new regime came in to power in 1978, 1990, 2010, and 2015 GDP was popped up [21].
The investment for the Capital expenditure pattern as a percentage of GDP during 1950 was 10.7% and raised to 14.1% in 1960 and again n 1965. It was again increased to 20% in 1978 and rapidly shifted to 33.8% in 1980. From 1985 up to 2017 it showed that slightly fluctuated was not drastically
This shows that, during the FRSS up to 1978, eable fluctuation in GDP growth rate and investment for welfare program. Each and every budget has allocated higher ratio for FRSS program might be the reason for stable type of growth pattern. Until 1978, higher percentage from GDP such as 9.8% in 1960, 13.6% in 1965, 12.4% in 1970 and 8.1% in early 1977 were allocated for FRSS welfare program
e FRSS program shifted to Meanwhile expenditure, which was allocated for food subsidy was reduced to 2.4% out of GDP in 1980. In 1980, it showed that the
economic growth rate of GDP was over 6%. However, again it was declined to 4.9% in 1985 due to increase the civil disturbances
North- East of the country. The GDP growth rate was increased during FSP period than FRSS. The expenditure allocated for the food subsidies drastically reduced and those budgets were invested in large-scale development project like Mahaweli irrigation project, investment promotion zones [21].
However, after 1985 budget allocation for Janasaviya and Samurdhi was less than 1% showed huge difference between previous welfare systems. Both of these welfare programs are not direct food subsidy programs instead supporting them to eradicate poverty by supporting them through income transfer plan. Under both programs, beneficiaries were advised to saved and invest money they received.
Comparing GDP with welfare expe
showed that regardless of the amount spend for the welfare economic growth has fluctuate in same manner. The questions raised here are, Does Sri Lanka has progressive results from these welfare programs and what is the reality after 70 years of independence. It has found out that poverty and inequality are not reduced to the expected levels. Still nearly 1/4
population are in below the poverty line [25].
Fig. 2. Poverty and life expectancy
World Data Atlas; Human Development Report, [23,24]
; Article no.SAJSSE.47436
economic growth rate of GDP was over 6%. However, again it was declined to 4.9% in 1985 due to increase the civil disturbances of the East of the country. The GDP growth rate was increased during FSP period than FRSS. The expenditure allocated for the food subsidies drastically reduced and those budgets were scale development project like ion project, investment promotion
However, after 1985 budget allocation for Janasaviya and Samurdhi was less than 1% showed huge difference between previous welfare systems. Both of these welfare programs are not direct food subsidy programs, instead supporting them to eradicate poverty by supporting them through income transfer plan. Under both programs, beneficiaries were advised to saved and invest money they
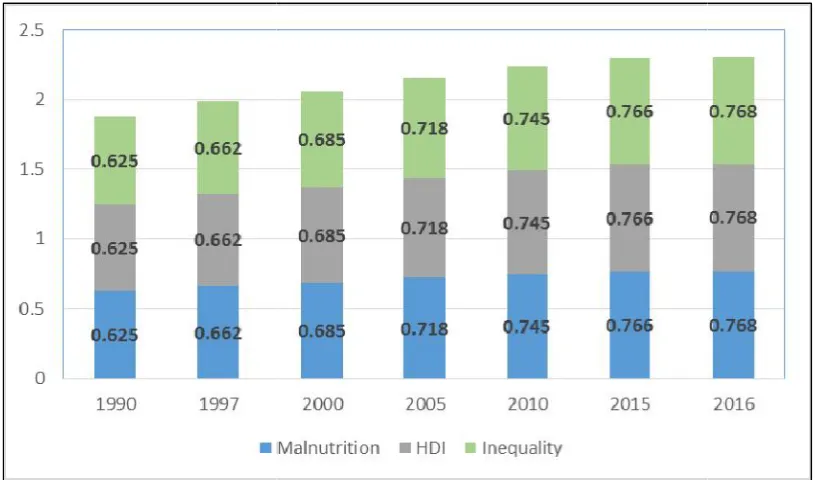
Fig. 3. HDI,
Source: Knoema- World Data Atlas;
4.2 Social Indicators
Noticeably both the FRSS as well as FSP programs were benefited to the majority of Sri Lankans. Under the FRSS program nearly 99% of the population was benefitted directly and which was in then had a direct impact on poverty and inequality levels. Under the FSP although the target group was slashed to around 50% of the population, this program also helped to maintain better living condition for the poorer [25,26].
Benefits provided under the welfare programs might be highly progressive, for example, in 1982, only 21.9% of the population remain below poverty line comparing favorable with 27.6% in 1973 and 22.7% in 1978. Thereafter, when it was introduced FSP, the rate of improvement slowed down significantly. However, in 1977, it was again increased to 25%-35% under the income transfer programs [25
according to the Central Bank of Sri Lanka showed that declining trend in poverty line it was 21.9%, in 1990, 26.1%; 1997, 28.8%; 2000, 26.1%; in 2005, 22.5%; in 2010, 15.2%; in 2015, 8.9% and in 2016, 4.1% [21].
In addition to this, the poorer might have suffered another problem, a decline in their standard of living. In this regards two other areas need to be
Rajapakshe; SAJSSE, 3(1): 1-9, 2019; Article no.
Fig. 3. HDI, malnutrition and inequality
World Data Atlas; Human Development Report, [23,24]
Noticeably both the FRSS as well as FSP programs were benefited to the majority of Sri Lankans. Under the FRSS program nearly 99% of the population was benefitted directly and which was in then had a direct impact on poverty the FSP although the target group was slashed to around 50% of the population, this program also helped to maintain better living condition for the poorer
Benefits provided under the welfare programs might be highly progressive, for example, in 1982, only 21.9% of the population remain below poverty line comparing favorable with 27.6% in 1973 and 22.7% in 1978. Thereafter, when it was introduced FSP, the rate of improvement slowed down significantly. However, in 1977, it 35% under the 5]. However, according to the Central Bank of Sri Lanka, it showed that declining trend in poverty line. 1982 it was 21.9%, in 1990, 26.1%; 1997, 28.8%; 2000, 26.1%; in 2005, 22.5%; in 2010, 15.2%; in
].
In addition to this, the poorer might have suffered another problem, a decline in their standard of living. In this regards two other areas need to be
considered; food consumption and nutrition. The relevant question is, to what extent the poorest portion of the population has been able to meet their basic calorie and protein energy needs under each of the programs.
Firstly, with the replacement of the earlier FRSS by the FSP in 1979, the low income households have experienced increasing difficulties in maintain adequate food consumption levels. The FSP badly affected to the food consumption need of the receivers. Because, comparing with FRSS, firstly, the value of the FSP is fixed in monetary terms and secondly, the food pr were increased sharply during 1979
impact on the poorer households with larger families would have been severe as the eligibility for food stamps is based on household incomes rather than per capita income. The net outcome of this situation affected to decline their nutrition level, especially in the low income groups. As a result, nutrition related problems appear to indicate not only a high degree of under nutrition but also deterioration of the malnutrition problems. However, malnutrition rate was increased up to 0.768 in 2016 from .625 in 1990 [22].
However, Sri Lanka performs quite well in terms of most social indicators. Life expectancy ratios, however, showed favorable result, indicating that in 1960 was 59.37 years was improved up to
; Article no.SAJSSE.47436
considered; food consumption and nutrition. The hat extent the poorest portion of the population has been able to meet their basic calorie and protein energy needs
Firstly, with the replacement of the earlier FRSS by the FSP in 1979, the low income households d increasing difficulties in maintain adequate food consumption levels. The FSP badly affected to the food consumption need of the receivers. Because, comparing with FRSS, firstly, the value of the FSP is fixed in monetary terms and secondly, the food prices during 1979-1985. The impact on the poorer households with larger families would have been severe as the eligibility for food stamps is based on household incomes rather than per capita income. The net outcome n affected to decline their nutrition level, especially in the low income groups. As a result, nutrition related problems appear to indicate not only a high degree of under nutrition but also deterioration of the malnutrition on rate was increased up to 0.768 in 2016 from .625 in 1990
Rajapakshe; SAJSSE, 3(1): 1-9, 2019; Article no.SAJSSE.47436
75.3 year in 2017. In 1973 adult literacy rate was 81%, 86% in 1982, and 85% in 1988. Almost all children of primary school age were enrolled in school. In fact mortality was 82 per thousand in 1950 was reduced to 36 per thousand in 1985. Comparing other countries, which have similar income level (per capita income), it is easily determine the place of Sri Lanka. The World Happiness Report provides data for Sri Lanka from 2013 to 2018. The average value for Sri Lanka during that period was 4.35 points with a minimum of 4.15 points in 2013 and a maximum of 4.47 points in 2018 [24].
In 1994 HDI values and rank in Sri Lanka as 90, comparing higher place than South Africa, Iraq who have higher GNP per capita income than Sri Lanka. Sri Lanka HDI value in 1994 was .665. In 2018 HDI value was 0.770 and the world rank was 76 [24].
It is also been argued, however, that the picture is much less impressive when one shifts from single-period cross country comparison to a time series analysis that takes into account Sri Lanka’s initial relative position and its capacity to improve upon that position or even maintain at least. In the first two decades after the independence, Sri Lanka’s standard of living, measured by usual indicators, remained well above those of other developing countries. Since then, however, Sri Lanka has fallen. In 1950, school enrollment rate in Sri Lanka was 54%, higher than that of Korea 43% and
comparable to that of Philippines 59%. By 1979, however, both Korea at 94% and Philippines at 85% was surpassed Sri Lanka at 74% in terms of this measure. In 1950, Sri Lanka’s infant mortality rate was 77, compared with 102 for Philippines, 84 for Thailand, 85 for Korea and 91 for Malaysia. By 1985, Sri Lanka, with a rate of 36, ranked behind Malaysia 28 and Korea 27 [25]. However, Both Thailand 43 and Philippines has improved more rapidly than Sri Lanka had. Nevertheless, the overall performance of Sri Lanka in terms of social welfare indicators has been quite outstanding. However, because of these achievements, Sri Lanka has been often cited as a model country that has been able to provide its people with a high standard of living despite relatively slow growth and low GDP as shown in Fig. 1 [24].
The social welfare program has directly accountable for these progresses, as a human capital development strategy in Sri Lanka. However, the higher rates allocated for the welfare was negatively affected to economic growth of Sri Lanka.
4.3 Economic Growth versus Social
Welfare
The second major issue is tradeoff between growth and allocating resources to consumer subsidies or allocating them to investment. Comparing to the East Asian countries, it showed that Sri Lanka was quite well at the time of
Rajapakshe; SAJSSE, 3(1): 1-9, 2019; Article no.SAJSSE.47436
independence than today. When Sri Lanka got independence from British, the growth rate was 11.4% and in 1998 it is 8.1% [21]. However in 2015 again it was reduced to 3.8 and then 2017 to 3.1% [21]. The achievement of Sri Lanka in the area of health and education have a result of this government intervention. The statistics indicate that high levels of expenditure on welfare are unsustainable without a growth. If these funds allocated to the welfare programs were redirected to productive investments, growth and future income might be raised. In that sense there is a clear tradeoff between current expenditures on welfare and the levels of future incomes. To the extent that economic growth is expected to reduce poverty and inequality.
Sri Lanka was in higher position than East Asian counties before the independence. If at the beginning of the program, that welfare expenditure could have been better targeted and the alleviation of poverty achieved at lower cost.
5. CONCLUSION
The objective of this paper is to investigate and analyze the major food subsidy programs which are functioned until today and check their effectiveness with regards to the two meaning of development; traditional and modern meaning. Development policy in Sri Lanka has changed alone with its successive governments. After the independence from British in 1948, political power in Sri Lanka has basically shifted between two major political parties. Even though they have different perspectives about the political vision, in office both have operated welfare programs as a development strategy. Economist argues that, huge welfare expenditure has directly affected to economic development of the country. However, after introducing people strengthen program in 1989, GDP was not accelerated as expected level.
It is not the attention to conclude this investigation with purely negative opinion. However, Sri Lanka has not enjoyed sustainable health growth rate after the independence. Except for occasional booms, which had for only 2-3 years in early 1980s’. Therefore according to the traditional meaning of development, clearly Sri Lanka is a less developed country. However, the decades of welfare policies act as a development strategies in modern point of view. Social development achievement of the country shows significant values, even though economic progress is inadequate. Sri Lanka always
considers as a model country. Comparing developed countries, HDI in Sri Lanka has a higher rank. Is that mean Sri Lanka is a developed country? No, as mentioned earlier, development is not only economic growth but also human development. It is essentially a mix tasks.
Therefore, Sri Lanka Experience confirm that the fact that neither purely welfare policies nor even growth oriented policies supported by welfare programs can be a substitute for more forth right institutional measures for overcoming poverty and inequality and development of a country.
6. RECOMMENDATIONS
Issues involved in economic development were not depended on government expenditure on social welfare programs. The government was under pressure to contain rising inflation and civil war expenditure. However, after seven decades of independent, Sri Lanka is shifted to middle income country and achieved moderate growth even though unable to maintain the required growth rate to make Sri Lanka a fast growing economy in South Asia. Even though, Sri Lanka has opportunity to grow faster than other South Asian countries because of long term welfarism of the country not only for food subsidy programs but also for free health, education, fertilizer subsidy program, price control etc. Higher literacy rate and life expectancy and other social indicators shows that, the welfarism policy made talented and healthiest citizen for the country. Thus, government intervention required for Sri Lanka to become a fast growing economy by taking advantage of talented and healthier citizen. To achieve economic development, while improving standard of living of the citizen can do with a little effort, which requires a commitment of not only the government, but also the society.
COMPETING INTERESTS
Author has declared that no competing interests exist.
REFERENCES
1. Seers D. The meaning of development: Development theory: Four critical studies. Ed. David Lehman, Frank Cass Ltd; 1979. 2. Lipsey RG, Lancaster K. The general
Rajapakshe; SAJSSE, 3(1): 1-9, 2019; Article no.SAJSSE.47436
3. Todaro M. Economic development. 11th ed., with Stephen C. Smith. Pearson Education and Addison-Wesley; 2011. 4. Bryant C, White L. Managing development
in the third world. Boulier, Co: Westview; 1982.
5. Wickramasinghe H. Evaluation of anti-poverty programs: Post – 1977 period. Sarvananthan M (ed.), Economic Reforms in Sri Lanka, International Centre for Ethnic Studies, Colombo. 2006;242–285.
6. Wickramasekara P. An evaluation of policies and programmes for the alleviation of poverty in Sri Lanka, Chapter 3 of Strategies for Alleviating Poverty in Rural Asia (Bangladesh Institute of Development Studies Dhaka – ILO. 1985;346.
7. Gavan JD, Chandrasekara I. Sri. The impact of public food grain distribution on food consumption and welfare in Sri Lanka, Research Report 13. International Food Policy Research Institute, Washington; 1979.
8. Central Bank of Sri Lanka. Annual Report. Central Bank Publications, Colombo; 2008. Available:https://www.cbsl.gov.lk/sites/defa ult/files/cbslweb_documents/statistics/other pub/econ_%26_ss_2008_e-min.pdf 9. Marasinghe ML. Poverty elimination
through poverty alleviation: The Jansaviya programme of Sri Lanka for national development. Third World Legal Studies. 1993;12(2):13–42.
10. Ministry of Economic Development, Sri Lanka. Performance Report; 2012.
Available:http://www.erd.gov.lk/images/pdf/ performance_report_2012_english.pdf 11. Samurdhi Authority, Sri Lanka. Annual
Report; 1999.
Available:http://www.samurdhi.gov.lk/web/i ndex.php?option¼com_content&view¼arti cle&id¼106&Itemid¼103&lang¼en 12. Debashis. Measurement of economic
development, economics discussion. Available:http://www.economicsdiscussion.
net/economics-2/measurement-of-economic-development/4437
13. Meier GM, Baldwin RE. Economic development: Theory, history, policy. By. New York: John Wiley & Sons, Inc; 1957. 14. Harvey Leibenstein. General X-efficiency
theory and economic development. Oxford University Press; 1978.
15. Rostow WW. The stages of economic growth: A non-communist manifesto. Cambridge University Press; 1960.
16. Baran Paul A. The political economy of growth. New York: Monthly Review Press. 1957;22–23,41–42.
17. Buchanan J, Knight FH. International encyclopedia of the social sciences. New York: MacMillan. 1968;424–28.
18. Kumar A, Sharma U. Traditional vs. modern measures of economic develop-ment: A theoretical analysis. International Journal of Scientific Footprints. 2014;2(1): 94–101.
19. Human Development Report (1990-2018). Available:http://hdr.undp.org/en/countries/p rofiles/LKA
20. Stone, Christopher. Where the Law Ends. New York: Harper & Row; 1975.
21. Central Bank of Sri Lanka. Annual reports: Colombo. Central Bank Publications; 1967-2017.
22. The World Bank. Sri Lanka: Capital investment as percent of GDP; 2019. Available:https://www.theglobaleconomy.c om/Sri-Lanka/Capital_investment/
23. Knoema. World data atlas-Sri Lanka poverty. Sri Lanka - Poverty headcount ratio at national poverty line; 2018.
Available:https://knoema.com/atlas/Sri-Lanka/Poverty-rate-at-national-poverty-line 24. Human Development Report. UNDP
Publications; 1994 & 2018.
Available:http://hdr.undp.org/en/countries/p rofiles/LKA
25. Central Bank of Sri Lanka. Annual Report. Central Bank Publications, Colombo; 1997. 26. Athukorala P, Jayasuriya S.
Macroeconomics policies, crises and growth in Sri Lanka. The World Bank, Washington D.C. 1994;47-49.
© 2019 Rajapakshe; This is an Open Access article distributed under the terms of the Creative Commons Attribution License
(http://creativecommons.org/licenses/by/4.0), which permits unrestricted use, distribution, and reproduction in any medium,
provided the original work is properly cited.
Peer-review history:

![Fig. 4. Index comparison Source: Human Development Report [24]](https://thumb-us.123doks.com/thumbv2/123dok_us/8412408.1691251/7.612.106.514.472.685/fig-index-comparison-source-human-development-report.webp)
