Counting Brown Planthoppers in Light-Trap Images
Using Morphological Operations
Nghi Cong Tran
1, An Cong Tran
1,*, Nguyen Huu Van Long
1, and Hiep Xuan Huynh
11Can Tho University, Vietnam
Abstract
As brown plant hopper (BPH) is one of the most dangerous kinds of insect for rice plant, in recent years, there has been increased concern in counting them in light trap images to control their spread in order to reduce their damage on rice plant. This paper proposes an approach to counting BPHs in light trap images based on morphological operations. By applying these operations appropriately, combined with some noise removal techniques based on color, BPHs in the light trap images can be identified. In addition, it is common that the BPHs in the light-trap images are overlapped due to the layout of the light trap. Therefore, an approach to counting the overlapped BPHs based on their size is also introduced while the sequential region labeling algorithm is used to count the number of the separate BPHs. The experimental results show that our proposed approach is suited to identifying and counting the BPHs in images which are overlapped.
Keywords: brown plant hopper, morphological operations, overlapped BHPs, sequential region labelling. Received on 03 April 2019, accepted on 20 June 2019, published on 26 June 2019
Copyright © 2019 Nghi Cong Tran et al., licensed to EAI. This is an open access article distributed under the terms of the Creative Commons Attribution licence (http://creativecommons.org/licenses/by/3.0/), which permits unlimited use, distribution and reproduction in any medium so long as the original work is properly cited.
doi: 10.4108/eai.13-7-2018.159352
*Corresponding author. Email: [email protected]
1. Introduction
Brown plant hopper (BPH) is one of the most dangerous insects for rice plants. It harms rice plants by directly feeding on them and transmitting many serious diseases such as ragged stunt virus and grassy stunt virus. This leads to serious losses of rice fields. As a result, BPH is causing serious damage on Vietnamese agriculture as well as other rice-growing countries [7, 8, 13, 14]. For example, in the Mekong Delta of Vietnam, the BPH outbreak caused the loss of approximately 1 million tons of rice in 2007, which resulted in a government freeze on the export of rice. The Office of Agricultural Economics in the Ministry of Agriculture and Cooperatives of Thailand reported that the outbreaks caused losses worth $52 million during the dry season of 2010 [8]. In early 2012, the PRC’s southwestern provinces lost about 10 million tons of rice due to heavy BPH outbreaks [8].
Therefore, reducing damage of BPH is a critical problem for these regions to maintain the food supply safety, not only for these regions but also for our whole world as they are the main rice suppliers for the world. Much research has been conducted to introduce several approaches focusing on different perspectives, including engineering or bio technologies. In this paper, we will propose an approach to counting BPH in light-trap images, which is able to deal with the overlapped BPHs in the images.
Section 2 discusses related studies, which is followed by the introduction of the BPH morphology and morphological operations in Section 3. Then, the proposed approach to identifying and counting BPH in images based in morphological operations is described in Section 4.2 and 4.3 respectively. Section 4.4 describes our method to tackle with noises in images. Section 4.5 presents the complete proposed algorithm. Finally, Sections 5 and 6 provide the experimental results, conclusions and future works.
2. Related Works
Monitoring BPHs can help to identify the appropriate time for starting the crop to reduce their damage on rice plant, which is the main focus of this research line. In fact, several approaches have been proposed to eliminate the damage of BPH on rice plants. One of them is to create new rice varieties that have the BPH resistance capability. Many rice varieties that are resistant to the brown plant hopper are representative their long history of breeding and successful application in the field [11-13]. More than 20 resistance genes to BPH have been identified and they have been used to create rice varieties resistant to BPH such as Mugdo, ASD 7, etc. [11, 13]. However, adaptation of BPH to resistance limits the effectiveness of resistant rice varieties. In addition, changing the genes of rice plant may effect on its quality. Therefore, it is needed to find out more approaches to dealing with this problem.
Another approach to detecting BPH infestation is based on SPAD (Special Products Analysis Division) reading and reflectance of the rice. The results in [9, 21] show that SPAD reading and reflectance from rice are significantly effected by BPH infestation. The spectral reflectance from rice canopy significantly decreased in the near-infrared wavelength range as BPH infestations increased. The ratio indices of SPAD readings are also significantly related to BPH infestations. The main effects of BPH infestations on SPAD reading and reflectance are consistent regardless of nitrogen application rates. Therefore, the factors have potential to detect BPH infestation in rice fields. The results of these researches show a potential approach to detecting BPH infestation in rice fields. However, reflection and SPAD values from the leaves are not only affected by BPH infestation but also many other factors such as nitrogen-fertilizer and the kind of leaves.
Similarly, Prasannakumar N.R. and Chander Subhash also proposed a regression pest-weather model to describe the relation between BPH light trap catches and weather parameters [16]. The empirical results show that weather parameters such as maximum/minimum temperature, rainfall, humidity and sunshine hours are closely correlated with BPH light trap catches. Although empirical pest-weather model had significantly contributed in understanding pests population dynamics, it is influenced by local conditions and thus behaves in a location-specific manner. The pest population is thus shown to be affected by different factors at various locations.
Another approach to this problem is to apply the information techniques such as image processing [10, 17] and digital signal processor [22]. In these studies, the authors proposed several approaches to detecting BPH in images based on machine learning (e.g. AdaBoots, SVN, etc.) and image processing techniques (e.g. single-threshold segmentation, wavelet transform) to detect BPH. In addition, in [22], the mathematical morphology de-noising operations were also used to remove noises from the images. Basically, these studies can detect the BPH in the image automatically. However, they still have limitation: i) some of them have not been well-investigated [22]; ii) the
pre-ineffective, this leads to the detection accuracy was only about 70% - 85% [15, 17]; iii) some of them cannot count the BPH in images [10]. In addition, the morphological operations have not been used effectively. They were mainly used for de-noising and removing the redundant details in the images while their capability is beyond this task.
An approach to removing BPHs in light-trap images was proposed [1]. In this research, the authors used the morphological operations to identify and combined some other algorithms to count BPHs. The authors also introduced some techniques to remove noise in the images based on colour and size of the BPHs. These techniques are able to reduce the true negative counting in case there exists other insect in the images. However, their approach may produce false positive counting when the BPHs are overlapped in the images, which is very popular in practice due to the layout of light traps.
Therefore, in this paper, we propose an approach to counting BPH in images based on the morphological operations. These operations are used to identify the morphological characteristics of the BPH in images. The result of this task will be combined with the well-studied morphological characteristic of the BPH to detect and count them. In addition, we also use these operations in conjunction with the colour of the BPH in the pre-processing step to remove noises in the images to increase the accuracy of the detection. In addition, we also introduce a technique to deal with the overlapped BPHs in images based on their size.
3. BPH Morphology & Morphological
Operations
To detect and count BPHs based on the morphological operations, we identify their morphological characteristics and examine the possible morphological operations. These two aspects are the basics for our approach.
3.1. Brown Plant Hopper Morphology
shape and size of the BPHs. Their colour will be used to remove the insects other than BPHs. Figure 1 describe figure of some stages of BPH life.
Figure 1. Eggs, nymphs and adult BPHs
3.2. Morphological Operations
Mathematical morphology is a theory and technique for analysing and processing geometrical structures, based on set theory, lattice theory, topology and random functions [6, 18, 19]. It contributes a wide range of operators to image processing that is particularly useful for the analysis of binary images. The common usages of these operators include edge detection, noise removal, image enhancement and segmentation.
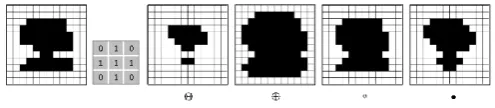
Morphological operators often take a binary image and a structuring element as input and combine them using a set operator. They process objects in the input image based on characteristics of its shape, which are encoded in the structuring element (also known as kernel). The two most basic operations in mathematical morphology are erosion and dilation. Other morphological operators are defined based on these operators including the opening and closing operators. In this section, we will introduce these operators applying to binary images only. A binary image I is generally considered as an array of values I(x, y) such that I(x, y) = 1 | 0 for the pixel location (x, y). Alternatively, a binary image can be represented as a set of all the foreground pixels, i.e. pixels that have the 1-value [2].
Structuring element. The structuring element consists of a pattern specified as the coordinates of a number of discrete points relative to some origin. For the binary image, a structuring element H is a small image in which each pixel has a value of 0 or 1: H(i, j) ∈ {0, 1}. Some basic structuring elements are square, diamond, cross, diagonal cross, horizontal line, vertical line.
Figure 2 shows some structuring elements that are widely used for binary image processing with the origins are circled.
Figure 2. Basic structuring elements for binary image processing
Erosion. The erosion of a binary image B by a structuring element S, denoted by B ⊖ S, is a set of points x such that H is included in B when its origin is placed at x: B ⊖ S = {x | Hx ⊆ B}. The basic effect of the operator on a binary image is to erode away the boundaries of regions of foreground pixels (i.e. white pixels, typically). Thus, area of foreground pixels shrinks in size, and holes within those areas become larger.
The erosion removes small-scale details from the binary image but also reduce the size of region of interest. This operator can be used to find the boundaries of each region in the images by subtracting the eroded image from the original one.
Dilation. The dilation of a binary image B by a structuring element S, denoted by B ⊕ S, is a set of points x such that H hits B when its origin coincides with x: B⊕S = {x | Sx ∩ B ≠∅}. The basic effect of the operator on a binary image is to gradually enlarge the boundaries of regions of foreground pixels (i.e. white pixels, typically). Thus, areas of foreground pixels grow in size while holes within those regions become smaller.
Opening. The opening operators of a binary image B by a structuring element S, denoted by B ◦ S, is defined as the erosion of B by S followed by the dilation by S: B ◦ S = (B ⊖S) ⊕S. This operator makes stray foreground structures that are smaller than the S structure element will disappear while larger structures will remain. The structures that are survived after the erosion are restored to their original size by the dilation. This is an idempotent operator: once the image has been opened, subsequence openings with the same structure have no further effect.
Closing. This operator is also derived by the erosion and dilation operators. The closing operator of a binary image B by a structuring element S, denoted by B • S, is defined as the dilation followed by the erosion operators: B • S = (B ⊕ S) ⊖ S. This operator preserves background regions that have a similar shape to the structuring element, or that can completely contain the structuring element, while eliminating all other regions of background pixels. Like opening, this is also an idempotent operator.
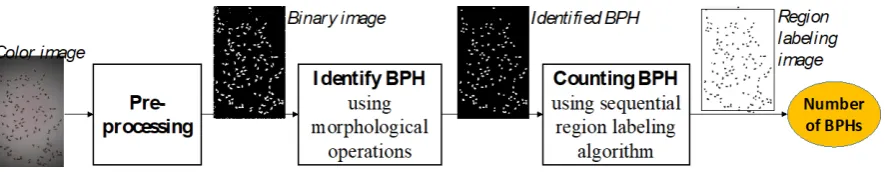
Effect of the above operations is demonstrated in Figure 3. We also borrow an example from Wolfram2 to demonstrate the application of these operators, which is shown in Figure 4.
Figure 3. Effect of the morphological operations
Figure 4. Demonstration of the morphological applications (Source: Wolfram)
Figure 5. A model for detecting and counting BPH in images
4. Counting BPHs Based on
Morphological Operations & Sequential
Region Algorithm
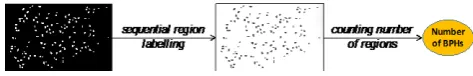
In this section, we will propose a model for detecting and counting BPHs in images based on morphological operations and the sequential region labelling algorithm. The model is shown in Figure 5 which includes three steps: i) pre-processing, ii) identifying BPHs in image, and iii) counting number of BPHs.
4.1. Pre-processing
The objective of this step is to increase the input image quality and convert it into binary image. Images taken by the light trap usually have unbalanced brightness and noise. Therefore, it is necessary to take the pre-processing step to reduce noise and increase quality of the input image to improve the accuracy of the proposed system. In addition, the input image will be converted into binary form so that we can use binary morphological operations in the image to improve performance of the system. This step includes 3 tasks:
1. Convert the input RGB image into gray image using the approach proposed in [5] as follow:
(1)
in which, R(x, y), G(x, y), and B(x, y) are the red, green and blue level of the pixel at (x, y) in the RGB image; I(x, y) is the gray level of the pixel at (x, y) in the output gray image.
2. Increase image contrast using the linear transform histogram algorithm [5]:
(2)
in which, I′(x, y) is the grey level of the pixel at (x, y) in the output image; I(x, y) is the grey level of the pixel at (x, y) in the input image; max and min are the maximum and minimum gray level of the input image respectively.
3. Convert grey image into binary image using adaptive threshold method [3]:
(3) in which, B(x, y) is the binary value of the pixel at (x, y); I′(x, y) is the grey value of the input image at (x, y); T(x, y) is the local threshold value of I′(x, y).
4.2. Identifying Brown Plant Hoppers
morphological two times to highlight the BPHs appearing in the image based on their size.
First, we use the opening operation on the input pre-processed image by the 3 × 3 diamond structuring element to reduce the small noisy pixel in the image. The structuring element used in this step was selected based on the size morphology of BPH and our experimental result on different type of structuring elements and BPH images.
Next, we apply the opening operation again on the image produced by the above step to remove the objects other than BPHs based on the BPH shape morphology. Several experiments had been conducted to find out an appropriate structuring element for the opening operation in this step. Due to the limitation on the paper’s length, detail of the experiments is not presented. Our experimental result suggests the most suited structuring element is the square one. It was produced by combining the different shapes of the BPHs observed in the images as described in Figure 6. The opening operation in this step not only helps to remove the object other than BPHs but also helps to separate the remained BPHs in the image.
Result of this step is demonstrated in Figure 7.
Figure 6. Finding structuring element for identifying BPHs
Figure 7. Identifying BPHs using the opening operation
4.3. Counting Brown Plant Hoppers
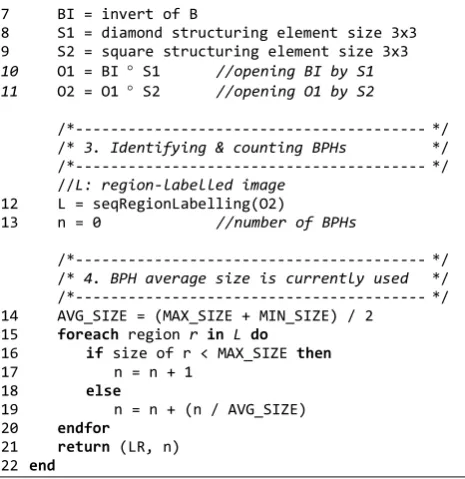
To count BPHs in the processed image, we use the sequential region labelling algorithm with the 4- connected neighbourhood. The number of BPHs is the number of labelled areas. Figure 8 demonstrates the result of applying the sequential region labelling algorithm on the image produced by the BPHs identifying steps in Figure 7.
Figure 8. Counting BPHs based on sequential region labelling algorithm
4.4. Dealing with overlapping BPHs
Due to the light trap layout, BPHs tends to be overlapped in some regions of the trap. Therefore, to increase the accuracy of our counting algorithm, we introduce a further step in our algorithm based on the size morphology of BPH.
From our investigation into BPH morphological characteristics, adult and nymph BPH size is often from 3.6mm to 5.0mm. Support that the distance between camera and the base of light trap is 20cm (a typical distance), size of the BPH in images will be about 9 to 40 pixels. Therefore, the regions whose area are greater than 40 pixels are likely invalid areas of normal BPHs. In our research, these regions are supposed the overlapped BPHs.
To count the overlapped BPHs, we will recognise such regions in the image and compute their area. The average size of BPHs is used to estimate the number of overlapped BPHs in those regions. This step is combined in the BPH counting algorithm presented in Section 4.3.
4.5. The Algorithm
Algorithm 1 implements our proposed approach for counting BPHs in images described in Section 4. This algorithm takes an RGB image as the input and returns a region-labelled image and the number of BPHs in the image.
Algorithm 1. Morphological-Based BPH Detection Agl. Input: An RGB-image I.
Output: A region-labelled image L and the number of BPHs in the image L.
1 begin
2 MAX_SIZE = 40 pixels //BPH max size
3 MIN_SIZE = 9 pixels //BPH min size
/*--- */
/* 1. pre-processing step */
/*--- */ //convert I to gray using Eq. 1
4 G = convertToGray(I)
//increase contrast of G using Eq. 2
5 GL = linearTransform(B)
//convert GL to binary using Eq. 3
6 B = toBinary(GL)
/*--- */
/* 2. Analysing BPH structure */
/*--- */
8 S1 = diamond structuring element size 3x3 9 S2 = square structuring element size 3x3
10 O1 = BI ° S1 //opening BI by S1 11 O2 = O1 ° S2 //opening O1 by S2
/*--- */ /* 3. Identifying & counting BPHs */ /*--- */ //L: region-labelled image
12 L = seqRegionLabelling(O2)
13 n = 0 //number of BPHs
/*--- */ /* 4. BPH average size is currently used */ /*--- */ 14 AVG_SIZE = (MAX_SIZE + MIN_SIZE) / 2
15 foreach region r in L do
16 if size of r < MAX_SIZE then
17 n = n + 1
18 else
19 n = n + (n / AVG_SIZE)
20 endfor
21 return (LR, n)
22 end
The algorithm includes 4 steps as described above. To count the number of BPHs in overlapping region, the BPH average size currently used is the average value of the smallest (3.6mm) and the biggest (5mm) BPH size [4]. Projection of this size from the distance about 20cm from the light trap to the trap-base will be 9 and 40 pixels correspondingly. This may not be the only choice for identifying this value. However, in the scope of this paper, we have not taken further investigation and leave it for future work.
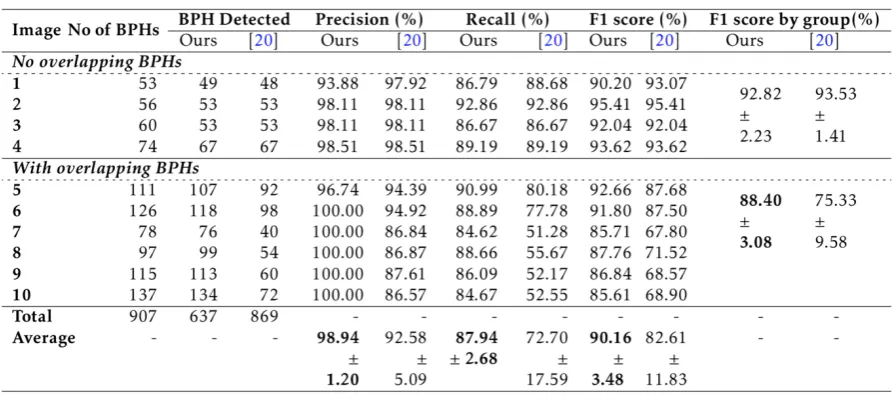
5. Evaluation
To evaluate the proposed approach, we chose 10 images in our light trap BPH dataset that contain totally 907 BPHs. Four of the 10 images (numbered 1 to 4) do not contain overlapping BPHs while the remaining ones (numbered 6 to 10) contain different level of overlapping. This dataset had been created by a light trap simulated system in which the BPHs were intentionally dropped into the light trap base. This method enables us to count the number of BPHs in each image so that we can calculate the accuracy of the proposed algorithms. The camera used in the light trap is Pixy1 with the resolution is 320 x 200px. Figure 9 demonstrates two images in our dataset.
Figure 9. Example of the images in the dataset
We employed three measurements to evaluate the proposed approach, which are the precision, recall and F1 score. These evaluation metrics are defined as follows:
(4)
(5)
(6)
in which, true positive is number of BPHs correctly detected, false positive is the numbers of wrong detections, and false negative is the number of BPHs missed detection.
Only 10 images are chosen for the evaluation because counting the true positive, false positive and false negative values to calculate F1 score must be performed manually and this is a complex and time consumed task. For examples, we have to compare each region, which is detected containing BPHs, with the corresponding region in the original images to check whether the detection is correct (true positive) or not (true negative). In addition, for regions that contain overlapping BPHs, the task is more complicated. Therefore, in this case, the number of images chosen for this evaluation is sufficient to evaluate the proposed approach.
Our proposed algorithm is compared with another algorithm introduced in [20]. The algorithm in [20] is chosen to compare with our algorithm as it is also based on morphological operations but it does not concern the overlapping BPHs. Therefore, a t-test rejected the null hypothesis at the 95% confidence level is used to test the statistically significant difference between experimental results.
The experimental result is shown in Table 1. The average F1 score of our algorithm on the 10 evaluated images is 90.16% ± 3.48% (average value ± standard deviation) while the F1 score achieved by the algorithm proposed in [20] is only 82.61% ± 2.68%. The paired t-test on this result shows that the F1 score achieved by our algorithm is statistically significantly better than that of the compared algorithm. This means that in general case, on the dataset that contains both overlapped and non-overlapped BPHs, our algorithm improves the accuracy significantly.
as overlapping BPHs. This is a true negative case and thus it causes reduction of both precision and recall. As the result, F1 score also reduces. However, the t-test shows that the results on this group are not statistically significantly different at 95% confidence level (the two-tailed p-value is around 0.391). This means that the reduction of F1 score for this group of images is not significant.
On the other hand, our algorithm achieves 88.4% ± 3.08% of F1 score on the second group of images (images
with overlapping BPHs) while the compared algorithm achieves only 75.33% ± 9.58%. This result shows that our approach to deal with overlapping BPH helps to increase the accuracy about 13.1% in which the precision increases about 9.9% and the recall increases about 25.7%. The t-test shows that all F1 score, precision and recall achieved by our results are statistically significantly better than that of the compared algorithm at more than 99% confidence level.
Table 1. Experimental result (The numbers after ± sign: standard deviations). Bold values: statistically significantly better than the corresponding unformatted values at 95% confidence level
6. Conclusion and Future Work
Our approach to counting BPHs in light trap images containing overlapping individuals shows a promising result on the dataset used in the evaluation. By taking the BPH size morphology into the consideration, our approach significantly improved the counting accuracy, particularly on the images that contain overlapping BPHs. However, our investigation also reveals that this approach can also work well on the images that do not contain the overlapping individuals. Results of our experiment were found statistically significant in comparison with the compared algorithm at at-least 95% confidence level.
To avoid the distraction from noise, we did not use the noisy images, which contain other insects or images with bad lighting condition, in the evaluation. Thus, more experiments on this algorithm may be needed to have a more thoughtful investigation on this approach. Techniques to deal with noise data may need to be employed to the current implementation to make the algorithm more durable. In addition, as described in Section 4, we used the average size of the smallest and the biggest BPH to computer the number of BPHs in overlapping regions. However, this may not be an optimal
strategy as the average size of BPHs may depend upon a particular circumstance such as the time, the area, and the like. There may be some other strategies such as using the average size of the BPHs in the image, which can be computed from the size of separated BPHs. We leave those problems for the future work.
References
[1] An C. Tran, Nghi C. Tran, H.X.H. (2016) An approach to detecting brown plant hopper based on morphological operations. In The 2nd EAI International Conference on Nature of Computation and Communication (ICTCC 2016). [2] Birchfield, S. (2016) Image Processing and Analysis
(Cengage Learning).
[3] Bradley, D. and Roth, G. (2007) Adaptive thresholding using the integral image. Journal of graphics, GPU, and game tools12(2): 13–21.
[4] Capinera, J.L. (2008) Encyclopaedia of entomology, 4
(Springer Science & Business Media).
[5] Gonzalez, R.C., Woods, R.E. and Eddins, S.L. (2004)
operators on the unit circle. IEEE Transactions on Image Processing10(12): 1842–1850.
[7] Heong, K.L. and Hardy, B. (2009) Planthoppers: new threats to the sustainability of intensive rice production systems in Asia (International Rice Research Institute). [8] Heong, K.L., Wong, L. and Reyes, J.H.D. (2013)
Addressing planthopper threats to Asian rice farming and food security: fixing insecticide misuse. In Rice Planthoppers (Springer), 65–76.
[9] Huang, J.R., Sun, J.Y., Liao, H.J. and Liu, X.D. (2015) Detection of brown planthopper infestation based on SPAD and spectral data from rice under different rates of nitrogen fertilizer. Precision Agriculture16(2): 148–163.
[10] Huynh, H.X. (2013) Identifying the effects of brown plant hopper based on rice images. In Statistics & its Interactions with Other Disciplines-2013.
[11] Jena, K.K. and Kim, S.M. (2010) Current status of brown planthopper (BPH) resistance and genetics. Rice 3(2-3): 161–171.
[12] Khush, G.S. (2005) IR varieties and their impact
(International Rice Research Institute).
[13] Kobayashi, T., Yamamoto, K., Suetsugu, Y., Kuwazaki, S., Hattori, M., Jairin, J., Sanada-Morimura, S. et al. (2014) Genetic mapping of the rice resistance-breaking gene of the brown planthopper nilaparvata lugens. In Proceedings of the Royal Society of London B: Biological Sciences
281(1787): 20140726.
brown planthopper management II-after green revolution era. Molecular Entomology5(1).
[15] Mongkolchart, N. and Ketcham, M. (2014) The mea- surement of brown planthopper by image processing. In
International Conference on Advanced Computational Technologies & Creative Media (ICACTCM’2014). [16] Prasannakumar, N. and Chander, S. (2014) Weather-based
brown planthopper prediction model at mandya, karnataka.
Journal of Agrometeorology16(1): 126–129.
[17] [17] Qing, Y., XIAN, D.x., LIU, Q.j., YANG, B.j., DIAO, G.q. and Jian, T. (2014) Automated counting of rice planthoppers in paddy fields based on image processing.
Journal of Integrative Agriculture13(8): 1736–1745. [18] [18] Serra, J. and Soille, P. (2012) Mathematical
morphology and its applications to image processing, 2
(Springer Science & Business Media).
[19] [19] Serra, J. and Vincent, L. (1992) An overview of morphological filtering. Circuits, Systems and Signal Processing11(1): 47–108.
[20] Tran, C.N. (2015) Detecting BPH based on morphological image processing, Master thesis.
[21] Yang, C.M., Cheng, C.H. and Chen, R.K. (2007) Changes in spectral characteristics of rice canopy infested with brown planthopper and leaf-folder. Crop science 47(1): 329–335.