UNIVERSITY OF GONDAR
FACULITY OF INFORMATICS
DEPARTMENT OF INFORMATION TECHNOLOGY
POSTGRADUATE PROGRAM
Thesis Title:
Discovering the Pattern and Key Determinant Factor of Cereal
Crop Production: By Using Association Rule Mining
By Gizealew Alazie
A Thesis Submitted to the Department of Information Technology,
Uni-versity of Gondar in Partial Fulfillment of the Requirements for the
De-gree of Master of Science in Information Technology (MSCIT)
Advisor:
Dejen Alemu
Gondar, Ethiopia
DECLARATION
I declare that this thesis is my original work and has not been presented to any other university for achieving any academic degree or diploma awards and all sources of materials used for this work have been duly acknowledged.
Declared by:
Student Name: Gizealew Alazie
Signature: _______________________
Submitted to: Department Information technology, University of Gondar
Date: ____/_____/____ Advisor Name: Dejen Alemu
Signature:
_______________________________________________________________________ Date ____/_____/____
Examiner
ACKNOWLEDGMENTS
I would like to thank my God and his mother St. Marry for helping me in my life and getting the chance to pursue my graduate education at the University of Gondar.
Table of Contents
LIST OF ABBREVIATIONS ... vi
List of figures ... vii
List of tables ... viii
Abstract ... ix
1. CHAPTER ONE ... 1
Introduction ... 1
1.1 Background of the study ... 1
1.2 Statement of the problem ... 2
1.3 Objective ... 3
1.3.1 General objective ... 3
1.4 Scope the study ... 3
1.5 Significance of the Study ... 4
1.6 Structure of the Paper ... 4
CHAPTER TWO ... 6
2. LITERATURE REVIEW AND CONCEPTUAL FRAMEWORK ... 6
2.1. Overview of Data Mining ... 6
Data Mining Methods ... 6
Data mining process ... 7
2.1.3. Data Mining Knowledge Discovery Process Models ... 7
Hybrid-DM process ... 11
Comparison of association rule mining algorithms without candidate generation ... 16
Evaluating the Performance of Association Rule Mining ... 16
Algorithms ... 16
Using Apriori with WEKA for Frequent Pattern Mining ... 16
Foundation for Frequent Pattern Mining Algorithms‟ Implementation ... 17
Data Mining and Statistics ... 17
Data Mining in Agriculture ... 17
Related Works on Agricultural Problem Domain ... 18
Comparison of the Study with Other Related Works... 26
3. METHDOLOGY ... 27
3.1. Research design ... 27
3.1.1. Understanding Agricultural domain approach ... 28
3.1.2. Understanding agricultural data ... 29
3.1.3. Data Preparation ... 29
3.1.3.3. Data Integration... 33
3.1.4. Mining (modeling) techniques ... 39
3.1.4.1. Association rule Modeling ... 39
3.1.4.1.1. Apriori algorithm ... 39
3.1.4.1.2. Comparing Different Algorithms ... 40
CHAPTER FOUR ... 41
4. Result and Discussion ... 41
4.1. Attributes during the analysis ... 41
4.2. Discovering the rules ... 42
4.2.1. Experimental setup to discover the rules ... 42
4.3. Evaluation of the discovered knowledge ... 43
4.4. Discussion of the Finding ... 46
CHAPTER FIVE ... 49
CONCLUSION, CONTRIBUTION, AND RECOMMENDATION ... 49
Contribution of the Study ... 49
Recommendation ... 50
Reference ... 52
ANNEXES ... 56
ANNEX I: Sample rules discovered using Minimum support: 0.1 (29221 instances) Minimum metric <confidence>: 0.9 ... 56
ANNEX II: Sample rules discovered using Minimum support: 0.15 (5844 instances) Minimum metric <confidence>: 0.7 ... 57
ANNEX III: Sample rules discovered using Minimum support: Minimum support: 0.25 (9740 instances) Minimum metric <confidence>: 0.25 ... 59
LIST OF ABBREVIATIONS
AI- Artificial Intelligence
ARM- Association Rule Mining
AARM-Apriori Association Rule Mining
CRISP-CRoss-Industry Standard Process
DM- Data Mining
ADM- Agricultural Data Mining
KDD- Knowledge Discovery in Database
RMS-Rapid Miner Studio
ECSA-Ethiopian central statistics agency
WEKA-Waikato Environmental Knowledge Analysis
CSV-comma separated version
ARFF-Attribute relation file format
List of figures
Figure 1 :the data mining process[14]... 7
Figure 2 knowledge discovery in database[15] ... 8
Databasehematic of SEMMA (original for [m SAS Institute) [16] ... 9
Figure 4:The CRISP-DM life cycle[19] ... 11
Figure 5: The six-step KDP model [20] ... 13
List of tables
Table 1 Data Mining Tasks ... 13
Table 2: related work discussion... 25
Table 3: Data summery ... 29
Table 4: List of the Selected Attributes and their Description ... 36
Table 5: Descriptions of the Selected Attributes with Their Possible List of Values... 38
Table 6: Attribute Evaluator: Correlation Ranking Filter ... 41
Table 7: Configuring minimum support 0.10, and minimum confidence of 0.9 ... 42
Table 8: Configuring minimum support of 0.15 and minimum confidence of 0.7 ... 43
Table 9: Configuring Minimum support 0.25 and minimum confidence 0.25 ... 43
Abstract
Agriculture is the major source of Ethiopian economy due to this the amount of agriculture
da-tabase are increasing on a daily basis. The wide availability of huge amounts of agriculture data
has generated an urgent need for the research of data mining. Although different approaches of
statistic, technology, metrology and geology were applied to identify factors contributing to
im-provement of cereal crop productivity, there remains a lot of work to bring overall change in the
productivity of cereal crop. This research focused on identifying relationships between attributes
of agriculture productivity survey data of cereal crop with input mechanisms and techniques to
clearly understand the nature of production of cereal crop in Ethiopia. The study uses a hybrid
data mining model since it is a research oriented model and WEKA 3.8.0, Microsoft Excel 2013
and SPSS tools are used for data mining, for data integration and for data exploration
respec-tively. Finally, 38961 instances and 14 attributes are selected for analysis. Additionally, the
val-ues of the yield of the attribute are discretized using domain expert ideas which are categorized
as Excellent, Very good, Good, satisfactory, and Bad. Association rule mining methods such as
Apriori and FP Growth algorithm compared and Apriori algorithm is applied in order to get the
results. By configuring different thresholds, different rules are achieved. The discovered rules
are then evaluated using the interestingness measure lift or correlation and domain experts.
Fi-nally, generating strong rule by satisfying both a minimum support threshold and a minimum
confidence threshold and identify the most detrimental factor behind for occurring frequently
and which crop is more correlate what crop by what factor they correlate. Finally, identify the
relationship between factors for improving cereal crop production in Ethiopia. Then non-
im-proved seed is affected by non –chemical damage, as well as occur in private owners and non-
irrigated land the region those occur frequently in Oromia. Use of non-improved seed and not
properly using fertilizer, not using the extension and irrigation as well as the region and male
household are showing a strong positive relationship with wheat, crop production (Yield) and
this observation lead to conclude that fertilizer, improved seed and irrigation are important
var-iables for cereal crop production. In this study maize and wheat is highly associated based on
their determinate factors.
1.
CHAPTER ONE
Introduction
1.1 Background of the study
Agriculture is the main source of income and employment for the majority of people in this world, especially in rural areas[1].Ethiopian government has focused its agricultural develop-ment policy on ensuring food security by allocating more resources to increase agricultural pro-duction so as to ensure continuous and adequate supply of food . To monitor and evaluate the performance of the policy and the trends in the changing patterns of agricultural production, val-uable information on agriculture is required as an input[3].
Agriculture is a unique business crop production, which is dependent on many climate and econ-omy factors. Some of the factors on which agriculture is dependent are soil, climate, cultivation, irrigation, fertilizers, temperature, rainfall, harvesting, pesticide weeds and other factors. Histori-cal crop yield information is also important for supply chain operation of companies engaged in industries. These industries use agricultural products as raw material, livestock, food, animal feed, chemical, poultry, fertilizer, pesticides, seed and pepper. An accurate estimate of crop pro-duction and risk helps these companies in planning, supply chain decision like propro-duction sched-uling. Business such as seed, fertilizer, agrochemical and agricultural machinery industries plan production and marketing activities based on crop production estimates[4].
Data mining in agriculture could be a terribly recent analytical topic. It consists within the appli-cation of information mining techniques to agriculture. Recent technologies square measure to-day able to offer plenty of data on agricultural related activities, which may then be analyzed so as to search out vital data. Carrying out effective and property, agriculture has become a crucial issue in recent years[5].
Thus, the results of this study may help the decision makers to make quick adjustments in agri-cultural policy as well as development programs to ensure food security of the country. In addi-tion, this[6], research would aim to highlight the important role of data mining in analyzing the agricultural statistical data items on crop production and to explore useful knowledge based on data mining methods. The study will have benefits to the agriculture professionals specifically experts on crop production and farmers.
1.2 Statement of the problem
The agricultural sector is the country‟s major source of economic growth under Ethiopia‟s Growth Transformation Plan (GTP), with attention given to productivity and production in-crease, which is crucial for the country's effort to attain food security and increase export earn-ings[7]
Ethiopia‟s agriculture sector policy and investment framework 2010-2020 provides a strategic framework for the prioritization and planning of investments that will drive Ethiopia‟s agricul-tural growth and development. The framework is anchored to, and aligned with, the national vi-sion of becoming a middle income country [8].
commodity prices have made it all the more relevant for farmers to use information and get help to make critical farming decisions. This paper focuses on the analysis of the agriculture data and finding optimal parameters to maximize the crop production using data mining tech-niques[4].The wide availability of huge amounts of agriculture data has generated an urgent need for the research of data mining. Generating rules with higher accuracy of agriculture databases can be done using different techniques of data mining[11].Due to these the study drives the fol-lowing research questions:
What are the possible determinant factors limits crop production in Ethiopia?
What are the most interesting patterns or rules generate degrading the determinantfactors correlation?
Which association rule algorithm is more appropriate in discovering an interesting pattern?1.3 Objective
1.3.1 General objective
The general objective of this research work is to explore determinant factors for crop productivi-ty from the existing statistical survey datasets for cereal crop production and to discover im-portant and interesting rules from the generated knowledge by applying data mining techniques and tools. And specifically to:
Explore determinant factors or variables that have significant impact on crop produc-tivity from the existing statistical survey datasets;
Use data mining methodologies to identify the factor of crop production;
Discover the hidden knowledge (patterns);
Evaluate the performance of the discovered association rule;
Determine important rules of the generated knowledge;
Insight into future research direction.
1.4 Scope the study
problem, understand the dataset and preprocessing, data mining, evaluating discovered knowledge and use discovered knowledge for discovering an interesting pattern. The study is also limited in Amhara and Oromia region.
1.5 Significance of the Study
It is expected that the outcome of this study will have contributions in reducing government ex-penses and the time required for conducting agricultural production forecasting survey in the tra-ditional way. Thus, the results of this study may help the decision makers to make quick adjust-ments in agricultural policy as well as development programs to ensure food security of the country. In addition, this research would aim to highlight the important role of data mining in analyzing the agricultural statistical data items on crop production and to explore useful knowledge based on data mining methods. The study would have benefited to the agriculture professionals specifically experts on crop production and mainly for farmers. Hence, the signifi-cance of this study will contribute to the following benefits:
Increase the productivity and quality of crops produced.
Helps to simplify a decision making process in order to support crop production strate-gies as domain knowledge or expertise.
Disseminate appropriate information for farmers at the right time from the government.
1.6 Structure of the Paper
This thesis report is structured into five chapters. The first chapter is an introduction part, which contains background to the study (i.e. Crop production correlation in Ethiopia and tries to give insights into the data mining technology that were applied in this study, explains the statement of the problem that lead to this research work, objectives to be attained, scope and limitation of the study, the significance of the study. Chapter two deals with literature review and conceptual framework about data mining techniques and different types of algorithms implemented in the data mining tasks and conceptual framework. It includes a detailed discussion on the related works of the application of data mining in the area of crop production correlation and determinant
CHAPTER TWO
2. LITERATURE REVIEW AND CONCEPTUAL FRAMEWORK
IntroductionThis chapter discusses background concepts of data mining and their relationship, including; ex-plain the meaning of data mining, data mining tasks and what Agricultural Data Mining (from now onwards ADM) means, major tasks and algorithms used in ADM. In addition, review of re-lated literature is discussed in the application of data mining tools and techniques of agriculture.
2.1. Overview of Data Mining
Thanks to advances in computers and data capture technology, huge data sets containing giga-bytes or even teragiga-bytes of data have been and are being collected. These mountains of data con-tain potentially valuable information. The trick is to extract that valuable information from the surrounding mass of uninteresting numbers, so that the data owners can capitalize on it[12]. Data mining is a new discipline that seeks to do just that: by sifting through these databases, summa-rizing them, and finding patterns. Data mining should not be seen as a simple one-time exercise. Huge data collections may be analyzed and examined in an unlimited number of ways. As time progresses, so new kinds of structures and patterns may attract interest, and may be worth seek-ing in the data. Data minseek-ing has, for good reason, recently attracted a lot of attention. It is a new technology, tackling new problems, with great potential for valuable commercial and scientific discoveries. However, we should not expect it to provide answers to all questions. Like all dis-covery processes, successful data mining has an element of serendipity. While data mining pro-vides useful tools that does not mean that it will inevitably lead, to important, interesting, or val-uable results. We must beware of over exaggerating the likely outcomes[13].
Data Mining Methods
of a number data mining tasks including: classification, regression, clustering, summarization, dependency modeling, and change and deviation detection[13]
Data mining process
For databases containing a huge amount of data, appropriate sampling techniques can first be applied to facilitate interactive data exploration. Interactive mining allows users to focus the search for patterns, providing and refining data mining requests based on returned results. Spe-cifically, knowledge should be mined by drilling down, rolling up, and pivoting through the data space and knowledge space interactively[14].
Figure :the data mining process[14].
2.1.3. Data Mining Knowledge Discovery Process Models
Knowledge discovery in database (KDD) Process
unifying goal of the KDD process is to extract knowledge from data in the context of large data-bases. It does this by using data mining methods (algorithms) to extract (identify) what is deemed knowledge, according to the specifications of measures and thresholds, using a database along with any required preprocessing, sub sampling, and transformations of that database[15].
Figure 1 knowledge discovery in database[15]
The SEMMA-DM Process
The acronym SEMMA stands for Sample, Explore, Modify, Model, Assess, and refers to the process of conducting a DM project. The SAS Institute considers a cycle with 5 stages of the process: [16].
Sample- this stage consists of sampling the data by extracting a portion of a large data set big enough to contain the significant information, yet small enough to manipulate quickly.
Explore- this stage consists of the exploration of the data by searching for unanticipated trends and anomalies in order to gain understanding and ideas.
Modify- this stage consists of the modification of the data by creating, selecting, andtransform-ing the variables to focus the model selection process.
Model- this stage consists of modeling the data by allowing the software to search automatically
Assess- this stage consists of assessing the data by evaluating the usefulness and reliability of the findings from the DM process and estimate how well it performs.Figure 2:Schematic of SEMMA original from SAS Institute)[16]
The SEMMA process offers an easy to understand process, allowing an organized and adequate development and maintenance of DM projects. It thus confers a structure for his conception, cre-ation and evolution, helping to present solutions to business problems as well as to find the DM business goals.
The CRISP-DM Process
Business understanding: This initial phase focuses on understanding the project objectives and
requirements from a business perspective, then converting this knowledge into a DM problem definition and a preliminary plan designed to achieve the objectives;
Data understanding: The data understanding phase starts with an initial data collection and
pro-ceeds with activities in order to get familiar with the data, to identify data quality problems, to discover first insights into the data or to detect interesting subsets to form hypotheses for hidden information.
Data preparation: The data preparation phase covers all activities to construct the final dataset
from the initial raw data.
Modeling: In this phase, various modeling techniques are selected and applied and their
parame-ters are calibrated to optimal values.
Evaluation: At this stage the model (or models) obtained are more thoroughly evaluated and the
steps executed to construct the model are reviewed to be certain it properly achieves the business objectives.
Deployment: Creation of the model is generally not the end of the project. Even if the purpose of
the model is to increase knowledge of the data, the knowledge gained will need to be organized and presented in a way that the customer can use it.
Figure 3:The CRISP-DM life cycle[19]
Hybrid-DM process
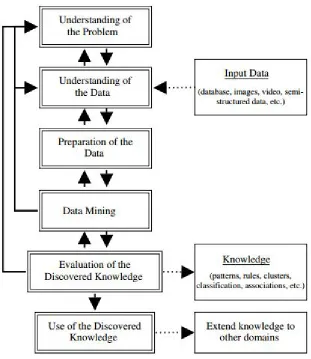
The development of academic and industrial models has led to the development of hybridmodels i.e., Models that combine aspects of both. One such model is a six-step KDP model. It was de-veloped based on the CRISP-DM model by adopting it to academic research. A description of the six steps follows :
1. Understanding of the problem domain.
includ-ing its restrictions, is prepared. Finally, project goals translate into DM goals, and the initial se-lection of DM tools to be used later in the process is performed.
2. Understanding of the Data
This step includes collecting sample data and deciding which data, including format and size, will be needed. Background knowledge can be used to guide these efforts. Data are checked for completeness, redundancy, missing values, the plausibility of attribute values, among others. Fi-nally, the step includes verification of the usefulness of the data with respect to the DM goals. 3. Preparation of the data
This step concerns deciding which data will be used as input for DM methods in the subsequent step. It involves sampling, running correlation and significance tests, and data cleaning, which includes checking the completeness of data records, removing or correcting for noise and miss-ing values, etc. The cleaned data may be further processed by feature selection and extraction algorithms (to reduce dimensionality), by derivation of new attributes (say, by discretization), and by summarization of data (data granularization). The end results are data that meet the spe-cific input requirements for the DM tools selected in Step 1.
4. Data mining
Here the data miner uses various DM methods to derive knowledge from preprocessed data.
5. Evaluation of the discovered knowledge
Evaluation includes understanding the results, checking whether the discovered knowledge is novel and interesting, interpretation of the results by domain experts, and checking the impact of the discovered knowledge. Only approved models are retained, and the entire process is revisited to identify which alternative actions could have been taken to improve the results. A list of errors made in the process is prepared.
6. Use of the discovered knowledge
Figure 4: The six-step KDP model [20]
Data Mining Tasks
According to Fayyad[21] data mining can be divided into two tasks: predictive tasks and descrip-tive tasks. Table 1 provides examples of descripdescrip-tive and predicdescrip-tive modeling paradigm pairs. The descriptive models reveal the suitability of the corresponding predictive model and guide the search.
Table 1:Data Mining Tasks
Descriptive paradigm Predictive paradigm
Correlation analysis Linear regression
Associative rules
Probabilistic rules
Clustering Classification
Descriptive Modeling
A model is a high-level description, summarizing a large collection of data and describing its important features. Often a model is global in the sense that it applies to all points in the meas-urement space. The goal of a descriptive model is describing all of the data (or the process gen-erating the data). Examples of such descriptions include models for the overall probability distri-bution of the data (density estimation), partitioning of the p-dimensional space into groups (clus-ter analysis and segmentation), and models describing the relationship between variables (de-pendency modeling)[6]. Clustering is similar to the classification except that the groups are not predefined, but are defined by the data alone[12]. The association rule finds the association be-tween the different attributes
Association Rules Discovery
Association rule mining, one of the most important and well researched techniques of data min-ing, was first introduced in [22]. It aims to extract interesting correlations, frequent patterns, as-sociations or casual structures among sets of items in the transaction databases or other data re-positories. Association rules are widely used in various areas such as telecommunication net-works, market and risk management, inventory control etc. Hegland [23], reviews the most well-known algorithm for producing association rules. Apriori and discuss variants for distributed da-ta, inclusion of constraints and data taxonomies. The review ends with an outlook on tools which have the potential to deal with long item sets and considerably reduce the amount of (uninterest-ing) item sets returned [24].
Clustering
One of the best known problems in the data mining is the clustering. Clustering is the task of cat-egorizing objects having several attributes into different classes such that the objects belonging to the same class are similar, and those that are broken down into different classes are not. Clus-tering is the subject of active research in several fields such as statistics, pattern recognition, ma-chine learning and data mining. A wide variety of clustering algorithms have been proposed for different applications [25].
Clustering tools assign groups of records to the same cluster if they have something in common, making it easier to discover meaningful patterns from the dataset. Clustering often serves as a starting point for some supervised DM techniques or modeling.
Sequential pattern mining methods have been found to be applicable in a large number of do-mains. Sequential data are omnipresent. Sequential pattern mining methods have been used to analyze this data and identify patterns. Such patterns have been used to implement efficient sys-tems that can recommend based on previously observed patterns, help in making predictions, improve usability of systems, detect events, and in general help in making strategic product deci-sions. They discussed also the applications of sequential data mining in a variety of domains like healthcare, education, Web usage mining, text mining, Bioinformatics, telecommunications, in-trusion detection, et cetera[26]. Sequential pattern mining is an important data mining problem with broad applications. However, it is also a difficult problem since the mining may have to generate or examine a combinatorial explosive number of intermediate subsequences [27]. Predictive Modeling
Predictive modeling the main point is that prediction requires the data to include a special re-sponse variable. The rere-sponse may be categorical or numb, thus further classifying predictive data mining as, respectively, classification and regression and are called supervised learning al-gorithm intend to obtain a classifier by learning from training examples [24].
Classification
Classification is to build (automatically) a model that can classify a class of objects so as to pre-dict the classification or missing attribute value of future objects (whose class may not be known). It is a two-step process. In the first process, based on the collection of training data sets, a model is constructed to describe the characteristics of a set of data classes or concepts. Since data classes or concepts are predefined, this step is also known as supervised learning (i.e., which class the training sample belongs to is provided). In the second step, the model is used to predict the classes of future objects or data. There are handful techniques for classification [3].
Discovering Patterns and Rules
task is connected with pattern discovery. Association rule is a typical method which is appropri-ate for such type of knowledge discovery task[12].
Comparison of association rule mining algorithms without candidate generation
Association rule mining techniques play an important role in data mining research where the aim is to find interesting correlations between sets of items in databases. Although the apriori algo-rithm of association rule mining is the one that boosted data mining research, it has a bottleneck in its candidate generation phase that requires multiple passes over the source data. FP-growth and matrix apriori are two algorithms that overcome that bottleneck by keeping the frequent item sets in compact data structures, eliminating the need of candidate generation. To our knowledge, there is no work to compare those two similar algorithms focusing on their performances in dif-ferent phases of execution. This study compares matrix apriori and FP-growth algorithms. Two case studies analyzing the algorithms carry out phase by phase using two synthetic datasets gen-erated in order i) to see their performance with datasets having different characteristics, ii) to un-derstand the causes of performance differences in different phases. Our findings are i) perfor-mances of algorithms are related to the characteristics of the given dataset and threshold value, ii) Matrix Apriori outperforms FP-growth in total performance for threshold values below 10%, iii) although building matrix data structure has higher cost, finding item sets is faster[28].
Evaluating the Performance of Association Rule Mining Algorithms
Association rule mining is one of the most popular data mining methods. However, mining asso-ciation rules often results in a very large number of found rules, leaving the analyst with the task to go through all the rules and discover interesting ones. In this paper, we present the perfor-mance comparison of apriori and FP-growth algorithms. The perforperfor-mance is analyzed based on the execution time for different number of instances and confidence in super market data set. These algorithms are presented together with some experimental data. Our performance study shows that the FP-growth method is efficient and scalable and is about an order of magnitude faster than the apriori algorithm[29].
Using Apriori with WEKA for Frequent Pattern Mining
candidate generation and pruning techniques for the satisfaction of the desired objective. This paper shows how the different approaches achieve the objective of frequent mining along with the complexities required to perform the job. This paper demonstrates the use of WEKA tool for association rule mining using apriori algorithm[30].
Foundation for Frequent Pattern Mining Algorithms’ Implementation
As with the development of the IT technologies, the amount of accumulated data is also increas-ing. Thus the role of data mining comes into picture. Association rule mining becomes one of the significant responsibilities of descriptive technique which can be defined as discovering mean-ingful patterns from large collection of data. The frequent pattern mining algorithms determine the frequent patterns from a database. Mining frequent item set is very fundamental part of asso-ciation rule mining. Many algorithms have been proposed from last many decades including ma-jors are apriori, direct hashing and pruning, FP-growth, ECLAT etc. The aim of this study is to analyze the existing techniques for mining frequent patterns and evaluate the performance of them by comparing apriori and DHP algorithms in terms of candidate generation, database and transaction pruning. This creates a foundation to develop newer algorithm for frequent pattern mining[31].
Data Mining and Statistics
The disciplines of statistics and data mining both aim to discover structure in data. So much do their aims overlap, that some people regard data mining as a subset of statistics. But that is not a realistic assessment as data mining also makes use of ideas, tools, and methods from other areas particularly database technology and machine learning, and is not heavily concerned with some areas in which statisticians are interested [32]. Statistical procedures do, however, play a major role in data mining, particularly in the processes of developing and measuring models. Most of the learning algorithms use statistical tests when constructing rules or trees and also for correct-ing models that are over fitted. Statistical tests are also used to validate machine learncorrect-ing models and to evaluate machine learning algorithms. Some of the commonly used statistical analysis techniques are discussed below. For an extensive review of classical statistical algorithms see Johnson [32].
Data Mining in Agriculture
problem, disease detection, optimizing the pesticide and so on. Recent technologies are nowa-days able to provide a lot of information on agricultural-related activities, which can then be ana-lyzed in order to find important information and to collect relevant information[1]. Agricultural organizations store huge amounts of data in the form of crop databases. Trends in these databases can be identified using data mining practices, which sort and model the data in order to arrive at a conclusion. The data mining applications present the data in the form of data marts. In the agri-cultural industry, however, the lack of standard vocabulary has hindered the process of data ing to a certain extent. This could lead to unnecessary problems, during the process of data min-ing. The increase in the use of standardized terms will reduce the percentage of errors in the data mining process[33].
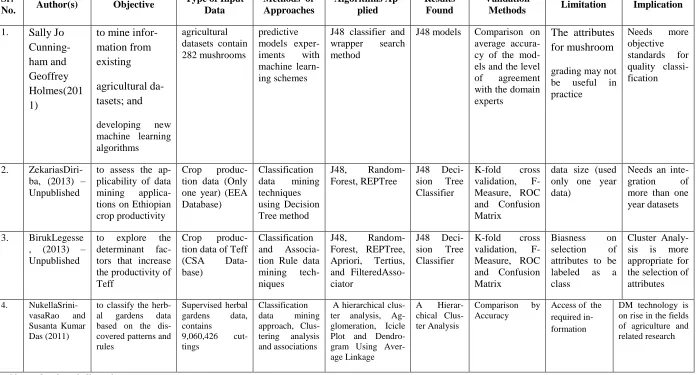
Related Works on Agricultural Problem Domain
Sr.
No. Author(s) Objective
Type of Input Data
Methods or Approaches Algorithms Ap-plied Results Found Validation
Methods Limitation Implication
1. Sally Jo Cunning-ham and Geoffrey Holmes(201 1)
to mine infor-mation from existing
agricultural da-tasets; and
developing new
machine learning algorithms
agricultural datasets contain 282 mushrooms
predictive models
exper-iments with
machine learn-ing schemes
J48 classifier and
wrapper search
method
J48 models Comparison on
average accura-cy of the mod-els and the level
of agreement
with the domain experts
The attributes for mushroom
grading may not
be useful in
practice
Needs more
objective standards for quality classi-fication
2.
ZekariasDiri-ba, (2013) – Unpublished
to assess the ap-plicability of data
mining
applica-tions on Ethiopian crop productivity
Crop
produc-tion data (Only one year) (EEA Database)
Classification
data mining
techniques using Decision Tree method
J48,
Random-Forest, REPTree
J48
Deci-sion Tree
Classifier
K-fold cross
validation,
F-Measure, ROC and Confusion Matrix
data size (used only one year data)
Needs an
inte-gration of
more than one year datasets
3. BirukLegesse
, (2013) – Unpublished
to explore the
determinant
fac-tors that increase the productivity of Teff
Crop
produc-tion data of Teff (CSA Data-base)
Classification
and
Associa-tion Rule data
mining
tech-niques
J48,
Random-Forest, REPTree, Apriori, Tertius, and FilteredAsso-ciator
J48
Deci-sion Tree
Classifier
K-fold cross
validation,
F-Measure, ROC and Confusion Matrix
Biasness on
selection of
attributes to be
labeled as a
class
Cluster
Analy-sis is more
appropriate for the selection of attributes
4. NukellaSrini-vasaRao and Susanta Kumar Das (2011)
to classify the herb-al gardens data based on the dis-covered patterns and rules
Supervised herbal gardens data, contains
9,060,426 cut-tings
Classification data mining approach, Clus-tering analysis and associations
A hierarchical clus-ter analysis, Ag-glomeration, Icicle Plot and Dendro-gram Using Aver-age LinkAver-age
A Hierar-chical Clus-ter Analysis
Comparison by Accuracy
Access of the required in-formation
DM technology is on rise in the fields of agriculture and related research
Comparison of the Study with Other Related Works
As discussed on literature review part of the study report one of related research works is a study conducted by Legesse [6] whose main objectives were discovering the determinant factors that increase Teff productivity. His study focused on the application of data mining techniques by applying classification and association rule mining techniques by using CRISP-DM model. For association, he applied algorithms such as Apriori, Tertius, and Filtered Associator. Besides, for classification he selected the decision tree algorithms such as J48, RandomForest, and REPTree. His experiments results showed that J48 Algorithm performed with highest accuracy which is 80.3267%. The results of his experiments indicated that high productivity of Teff was associated with area in hectare, type of measures taken to prevent damage, use of the extension service, use of fertilizer, type of seed, sample weight of seed, and Male household head.
The other research work was done by Diriba[23],whose main objective was to assess the ap-plicability of data mining techniques on agricultural crop productivity prediction using decision trees classification data mining techniques. His experiments were done by using decision tree method applying three algorithms: namely J48, Random Forest and REPTree. His experiments results showed that REPTree Algorithm performed with higher accuracy than others, which is 83.39%, and „Fertilizer used‟ is the major determinant factor which has the highest predictable
CHAPTER THREE
3. METHDOLOGY
The goal of this work is to explore a number of standard data mining techniques to agricultural data set for discovering cereal crop patterns and detecting strong association between attributes. So before applying the data mining techniques on the data set, there should be a methodology that governs a given work. Methodology is more than method of data collection; rather it is fur-ther of the concepts and theories which underlie the methods. So it is important to understand the fundamental concepts of the methodology to highlight a specific feature of a sociological theory test an algorithm for information retrieval or test the validity of a particular system.
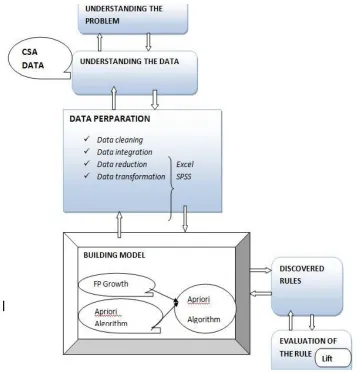
3.1. Research design
Based on the figure the first step of the study understands the problem domain. This step in-cludes an overview of the agriculture, factors of cereal crop determinates. In understanding the data step domain specific terminologies, data description and attribute selection is included. In data preparation step, data cleaning, data integration and data reduction steps are applied. The next step is building the model based on the selected algorithm which is apriori algorithm. Using apriori algorithm the rules are discovered then the rules are evaluated using the lift.
Figure 5: Research design
3.1.1. Understanding Agricultural domain approach
3.1.2. Understanding agricultural data
Initial data set for this research work, which is the last three years‟ survey data of cereal crop production ranging from 2013 up to 2016 G.C, was collected from the CSA‟s database. The sur-veys were conducted to provide data on farmland area and production of crops on the private peasant holdings for BELG season. The empirical data from the CSA‟s statistical reports, which provide basic quantitative information on total cultivated land area and cereal crop production, contain major attributes that have relation to crop production for all major crops in Ethiopia.
3.1.2.1. Data collection method
Crop production and land use data sets are taken from the central statistics agency as well each branch of the agency collects the data at different areas of the country and this data is stored cen-trally at the agency level with their data processing software or (SPSS). Therefore, to conduct this study, the researcher will take the data set from the central statistics agency.
3.1.2.2. Description of the Data
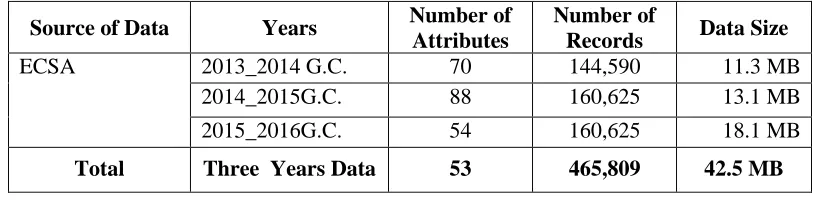
As described above, the initial cereal crop production dataset that was taken from the ECSA‟s database contains many attributes together with their instances. The summary of the data sources and general description of the collected data are illustrated in the table below
According to[34]data quality can be verified in terms of its accuracy, completeness, consistency, timeliness, believability and interpretability which are helpful to examine the quality of the data before conducting the experimentation.
In this regard, the initial dataset has been statistically described and visualized using SPSS pack-age and Microsoft excel to examine the properties of the whole dataset records and to obtain high level information regarding the data mining questions. Simple statistical analysis has been
per-Source of Data Years Number of
Attributes
Number of
Records Data Size
ECSA 2013_2014 G.C. 70 144,590 11.3 MB
2014_2015G.C. 88 160,625 13.1 MB
2015_2016G.C. 54 160,625 18.1 MB
Total Three Years Data 53 465,809 42.5 MB
formed to verify the quality of the dataset, addressing questions such as: do the data cover all cases required? Is the data correct or does it contains errors? Are there missing values in the da-ta?
3.1.2.3. Exploration of the data
Exploration of the data includes surveying the data that is taking a high-level overview to dis-cover what is contained in the dataset and to gain over all insight into the nature of the data. Sur-veying the data, therefore, looks at the general structure of the data and reports to identify wheth-er thwheth-ere is a useful information contained in the dataset about various areas of the business or not. The particular purpose of the data survey is to find out if the answer to the problem to be mod-eled actually exists in the dataset prior to investing much time, money, and resource in building the model. Consequently, data surveying and analysis address directs the data mining goals[35].
According to[36],exploring the nature and the relationships of the information contained in a da-taset is the task of the data survey. In addition, finding the places, defining the limits, and under-standing the structures of the dataset is the purpose of data surveying. Thus, the whole purpose of the data survey is to help the miner to draw a high-level map of the business territory. With the help of this map, a data miner discovers the general nature or characteristics of the data, as well as area of gaps, limitation, and usefulness of the data.
As a result, the researcher has performed basic statistical data analysis on the initial dataset to clarify the data mining goals or to make them more precise. In this task, basic statisticalexercise has been conductedto identify the characteristics of interesting sub-populations using SPSS and MS Excel software. Then, we have analyzed the properties of major attributes that indicate the data characteristics or lead to interesting data subsets for further examination. Accordingly, in the following section we describe the first findings of the primary data analysis andevaluate this information regarding their impact on the remainder of the study.
3.1.3. Data Preparation
since these decisions affect how the data is prepared, while the inputs to and outputs from the process are not affected[36].
In this study, the major activities done during data preparation phase included data selection, da-ta cleaning, attribute or feature selection, data transformation and aggregation, data integration
and formatting of the dataset. The purpose of these activities was to produce best model that can correlate cereal crops production in efficient and cost-effective ways. The following sub sections elaborate on these tasks in detail.
3.1.3.1. Data Selection
According to[37], one of the major activities that would be carried out during data preparation phase is data selection, which deals with decision on the target data set, by focusing on a subset of variables and data samples, on which the knowledge discovery task is to be performed. The criteria used for data selection include: relevance of the data items to the data mining goals, data quality and technical constraints such as limitations on data size or data types. Besides, the crite-ria for excluding data may include resource constraints, cost, restrictions on data use, or other data quality problems.
Sometimes, the whole collected dataset may not be taken for the experiments. Thus, the relevan-cy of each data to the overall research goals and objectives need to be checked. When plenty of data is available the miner has to select sufficient amount of sample to meet some degree of con-fidence in building association models[35].Hence, before selecting the target data set on which discovery is to be performed, basic issues that have relevance to the data mining goals have been dealt with as follows:
Therefore, for the purpose of this research, Amhara and Oromia regions, which have more rele-vance to the overall goal and objectives of the research work, were selected. However, the total data size is still very large i.e. 465,809 records that require 42.5MB for storage. This fact forced us to select a sample for the experimentation to reduce the data to manageable size. The major reason that obliged us to reduce the sample size for the experimentation was that the limitation of WEKA heap size (virtual memory size) when running the whole datasets, since virtual memory size is dependent on the capability of the hardware and type of the operating system loaded on it.
As a result, 9% of the total records are taken using proportional sampling technique, which are available in SPSS software that enabled us to generate the sample based on the specified per-centage of cases. Sampling was performed without replacement; so the same case cannot be se-lected more than once. Hence, the huge data size was reducedto38961records which require only 1.78MB storage space.
3.1.3.2. Data Cleaning
Usually, real world databases contain incomplete, noisy and inconsistent data and such unclean-ness data may cause confusion in the data mining process. Thus, data cleaning has become a very important activity during data preparation phase in order to assure the quality of data so as to im-prove the accuracy and efficiency of the data mining techniques.
Data cleaning task deals with all the data quality issues until the targeted dataset reaches the level required by the selected analysis techniques. This may involve selection of clean subsets of the data, insertion of suitable defaults or more ambitious techniques such as the estimation of miss-ing data by modelmiss-ing. Generally, data cleanmiss-ing is a process which fills missmiss-ing values, removes noise (invalid data), and corrects data inconsistency[36].
3.1.3.2.1. Missing Value Handling
Missing value refers to the values of one or more attributes in a data that do not exist. Sometimes missing value may be significant by itself and has to be properly handled. Theoretically, there are several methods suggested in the data mining literature to handle missing values, such as: calculating the average of continuous attribute values and filling this mean value for missing at-tribute values, removing the tuple, using the global constant value i.e. question mark (?), and fill-ing in the missfill-ing value manually[36].
The statistical summary of the initial dataset shows that some attributes in the original dataset contain missing values, ranging from 0.1% to as high as 100%, which are difficult to predict, re-place or fill. Thus, the researcher has decided to ignore those attributes that have large amount of missing values from the dataset to assure the quality of the data. This is because, the research believes that trying to fill these missing values using any accepted method will result in changing the original input data with artificial data.
As stated in the data description and data quality verification tasks, that are shown above in ta-bles out of the total 53 attributes of the original dataset, 19attributes were ignored because of their large amount of missing values, and 20 attributes that have no relation with the research goals have been removed. Out of these 20 attributes, 8 attributes hold area identification infor-mation i.e., Code of Zone, Wereda, District, Farmers Association, Enumeration Area, Household Id, Land Holder Id and Field ID, and 4 attributes hold information about the enumerator identifi-cation like name, id, title, etc., which have no relevance for the research since the scope of the study is limited to regional level,
3.1.3.2.2. Outlier Detection and Removal
The data stored in a database may reflect outlier noise, exceptional case, incomplete data object and random error in a measure of attribute values. These incorrect attribute values may occur due to data entry problems, faulty data collection, inconsistency in naming convention or technology limitation. According to[34], there are four basic noise handling methods for a given dataset such as: binning, clustering, regression and combined computer and human inspection methods.
There are also other outliers handling methods that have been developed to handle noise for a given dataset. Some of these methods are sensitive to extreme values, like the standard deviation (SD) method, and others are resistant to extreme values. The SD method is a simple classical ap-proach, which uses less robust measures such as the mean values, to identify outliers in a dataset. Mean value is the most common labeling method that detects how much distance the data has from the average, since mean value describes the average value of the global data[38].
Consequently, the researcher has identified and detected some noise or outlier value from the target dataset, as discussed in the data quality verification task, through analysis of statistical measure of variables available in SPSS. SD method was applied for handling outliers from the dataset for those attributes containing continuous numeric values such as: Production in Quintal (PRODQ) and Area in Hectare (AREAH). Then, high and low extreme values were replaced with mean value for those data instances which have values greater than(Mean + 2*SD) or less than (Mean - 2*SD) value, since values that do not lie within this range are extreme values and considered as outliers[38]. The following operations were applied in handling outliers:
1. Take the Mean and Standard Deviation value for each attribute.
2. Identify the outliers (extreme values) for each attribute using the SD method. 3. Replace the outliers with mean values.
3.1.3.3. Data Integration
Accordingly, to integrate the three years crop production data it was required to create new vari-able known as „YEAR‟ to hold values of different years. This attribute was included to make ag-gregation of the three years data simple and suitable for SPSS software but not used as a decisive factor for model building. In addition, another new attribute known as „YIELD‟ was derived from crop production and cultivated land area where new values are computed and generated. This new attribute helps to aggregate values from the records of attribute „PRODQ‟ (Production in Quintal) and attribute AREAH (Area in Hectare) by summarizing information contained in the data set. Then, after completing basic data pre-processing tasks separately on each file, the three years data files (i.e. from 2013up to 2016 ),that have different information about the selected variable were integrated or merged into one file for further analysis.
Since, it is a time series association the class variable should be the yield in the harvest season of the year while the association are those variable values that affect crop productivity (YIELD) and happen prior to the harvest season.
3.1.3.3.1. Data Construction
Data construction tasks include data preparation operations such as the computation of derived attributes that are derived from one or more existing attributes in the same record, or constructing completely new records or transformed values for existing attributes. According to[36],the basic reasons for constructing derived attributes during the course of data because:
Background knowledge convinces us that some facts are important and should be repre-sented, even though there is no attribute which currently represent it.
The modeling algorithm currently in use handles only certain types of data. In this study, we are using association rule mining algorithm apriori for discovering frequent pattern and discover the relationship between attribute of cereal crops by using data mining tech-niquewhich requires only categorical data values.
When doing the experiments, the outcome of the rule phase may suggest that certain facts are not being covered.
transform ranges to symbolic fields or symbolic fields to numeric values as the algorithms often require them. Therefore, in this study, some new attributes such as: „YIELD‟ and „YEAR‟ were generated since they are very important for the data analysis task. Besides, while preparing the data, attributes that have numeric or continuous values have been changed into nominal attribute values.Furthermore, attribute or feature selection and data transformation were also done based on the above guidelines and discussed in the following sub sections.
3.1.3.4. Attribute or Feature Selection
The ideal practice for variable selection is to take all the variables in the database, feed them to the data mining tool and let it find those which are the best descriptor. But, in practice this doesn‟t work very well. One reason is that the time it takes to build association model increases with the number of variables. The second reason is that blindly including unnecessary columns can lead to incorrect result. Although, in principle some data mining algorithms will automatical-ly ignore irrelevant variables and properautomatical-ly account for related (covariant) columns, in practice it is wise to avoid depending solely on the tool. Often, knowledge of the problem domain helps us to make attributes selection correctly[37].
Consequently, after consultation with the domain experts at CSA about the meaning of the at-tributes, the researcher decided to eliminate some attributes from the target dataset, since their instances are irrelevant for the analysis of this data mining problem domain. Thus, 11attributes that are irrelevant or redundant or already represented by other attributes in the database were excluded from the target dataset. Besides, those attributes with no variation in their value throughout the dataset and attributes which serve to assign sequence number for the records were also eliminated. The selected attributes are indicated below.
At this point, the number of attributes has diminished considerably, and out of the 53 attributes of the original dataset the researcher selected 14attributesthat are found to be more relevant and necessary to meet the research goals
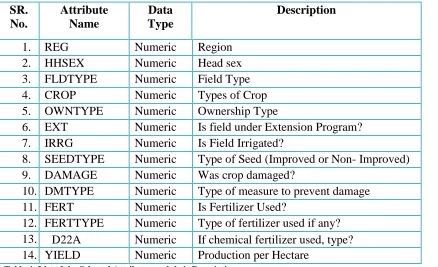
List of the Selected Attributes and their Description
SR. No.
Attribute Name
Data Type
Description
1. REG Numeric Region
2. HHSEX Numeric Head sex
3. FLDTYPE Numeric Field Type
4. CROP Numeric Types of Crop
5. OWNTYPE Numeric Ownership Type
6. EXT Numeric Is field under Extension Program? 7. IRRG Numeric Is Field Irrigated?
8. SEEDTYPE Numeric Type of Seed (Improved or Non- Improved) 9. DAMAGE Numeric Was crop damaged?
10. DMTYPE Numeric Type of measure to prevent damage 11. FERT Numeric Is Fertilizer Used?
12. FERTTYPE Numeric Type of fertilizer used if any? 13. D22A Numeric If chemical fertilizer used, type? 14. YIELD Numeric Production per Hectare
Table 4: List of the Selected Attributes and their Description
3.1.3.5. Transformation and Aggregation
In data transformation and aggregation, the collected data are transformed or consolidated into forms that are appropriate for data mining. This task includes constructive data preparation oper-ations such as the creation of derived attributes, generating new or transformed values for exist-ing attributes, combinexist-ing records and summarizexist-ing fields[36].
or samples are used instead of the actual data)[34]. Generally, discretization reduces significantly the number of possible values of continuous feature since large numbers of possible values con-tribute to slow and ineffective process of inductive machine learning.
Some of the attributes in the targeted dataset like „PRODQ’ (Production in quintal), ‘AREAH’ (Area in Hectare) and ‘YIELD’ (Crop production per Hectare) have numeric data type and con-sist of more than 10,000 unique or continuous values. Hence, these continuous values have been grouped into ranges to have a combined smaller number of group values or intervals, and their data type converted from numeric to nominal. These helped us to reduce the large number of possible values to make the dataset suitable for data mining tools. These tasks were performed using simple ranking methods and sum of case weights approach which are available in SPSS software that allow us to create new or separate ranking variables for such continuous values of numeric attributes. The new attribute values contain values equal to the sum of case weights, which are constant for all cases in the same group. So, the numeric attribute values are grouped into 10constant intervals to secretiveand then, transformed into new distinct values in order to improve performance of the models.
The following tables illustrate the transformed attribute values that were created by grouping their continuous values into a smaller number of categorical data to reduce complexity of the re-sults.
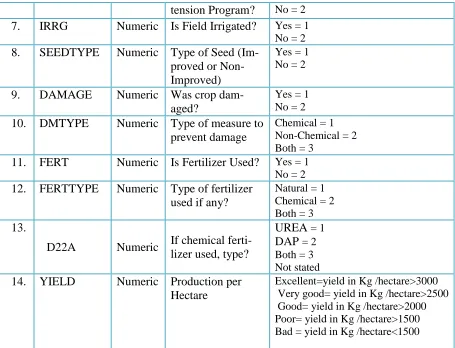
SR. No.
Attribute Name
Data Type
Description Possible Values
1. REG Numeric Region Amhara Region = 3 and
Oromia Region = 4
2. HHSEX Numeric Head sex Male = 1
Female = 2
3. FLDTYPE Numeric Field Type Single or one crop type = 1 Mixed crops= 2
Other land use = 3 4. CROP Numeric Types of Crop Barley = 1
Maize = 2 Sorghum = 6 Teff = 7 Wheat = 8 5. OWNTYPE Numeric Ownership Type Private = 1
tension Program? No = 2 7. IRRG Numeric Is Field Irrigated? Yes = 1
No = 2 8. SEEDTYPE Numeric Type of Seed
(Im-proved or Non- Improved)
Yes = 1 No = 2
9. DAMAGE Numeric Was crop dam-aged?
Yes = 1 No = 2 10. DMTYPE Numeric Type of measure to
prevent damage
Chemical = 1 Non-Chemical = 2 Both = 3
11. FERT Numeric Is Fertilizer Used? Yes = 1 No = 2 12. FERTTYPE Numeric Type of fertilizer
used if any?
Natural = 1 Chemical = 2 Both = 3 13.
D22A Numeric If chemical ferti-lizer used, type?
UREA = 1 DAP = 2 Both = 3 Not stated 14. YIELD Numeric Production per
Hectare
Excellent=yield in Kg /hectare>3000 Very good= yield in Kg /hectare>2500 Good= yield in Kg /hectare>2000 Poor= yield in Kg /hectare>1500 Bad = yield in Kg /hectare<1500
Table 5: Descriptions of the Selected Attributes with Their Possible List of Values
3.1.3.6. Data Formatting
Data formatting task primarily refers to syntactic modification or changes made to the data with-out changing its meaning, but might be required to satisfy the requirements of the specific mod-eling tool[35][40] .Most data mining tools in use can handle only certain types of file format and data types. For instance, WEKA software requires the target dataset to be prepared in the Com-ma Separated Value (CSV) file forCom-mat to run experiments. This software either process the CSV file format itself or a file in the form of Attribute Relation File Format (ARFF). WEKA software allows the conversion of CSV file format into an ARFF file format which is acceptable for run-ning experiments on WEKA software.
3.1.4. Mining (modeling) techniques
As it is stated above the mining tasks is association rule mining analysis. The total experimenta-tion for this research is three experiments. WEKA 3.8 DM using apriori algorithms with differ-ent metrics confidence, support and lift. This experimdiffer-ent conducted on the following machine resource Toshiba Satellite P845t-S4310, 4GB internal memory (RAM), 400 GB Hard disk and window 8 64-bit operating system and Intel(R) Core(TM) i3 3317U CPU @ 1.70GHz processor.
3.1.4.1. Association rule Modeling
The next step of this research is discovering strong crop production patterns using association rule mining techniques. In this association rule modeling different experiments were conducted using WEKA DM tools. As stated primarily three experiments of association rule mining analy-sis were conducted using different metrics support and confidence value. To generate more rules and better understand with different perspectives on the whole data set (38961). Those experi-ments‟ were using WEKA DM tool using apriori algorithm.
3.1.4.1.1. Apriori algorithm
While Confidence is the conditional probability that the transaction containing X and Y also con-tains Y.
According to[37], apriori algorithm is a widely used algorithm for the association rule and it is based on the rule of all sub item sets of a frequent item sets must also be frequent .By using this rule, apriori is able to prune huge amount of item sets. Besides it uses a bottom up approach. The other research which mentioned about apriori algorithm is [41].In this research apriori algo-rithm mentioned as the first and best known for association rule mining .It is one of the most in-fluential Boolean association rule mining for frequent item sets . It is an iterative algorithm to calculate the specific length of item collection of given database to produce frequent item sets. It cut down candidate item sets using the principle that all non-empty subsets of frequent item sets are frequent too. apriori algorithm basically works in two steps. In first step candidate item set is generated using linking process and in next step frequent item set from those candidate item set is found based on minimum support count by scanning the database.
CHAPTER FOUR
4.
Result and Discussion
As presented in the previous chapter the data have been well understood, explored, and correctly prepared to be used for the subsequent model building experiments. In the hybrid data mining method, the next step after data preparation is mining the data. In this case, the selected data min-ing method which is association rule minmin-ing is employed to the prepared agricultural data and test whether it makes the required minimum threshold.
4.1. Attributes during the analysis
Using WEKA 3.8.0 the attributes are selected before the minimum threshold of the confidence is set. Attributes are selected during the analysis using correlation attribute evaluation; since it evaluates the value of an attribute by measuring the correlation between an attribute and the class based on correlation attribute evaluation, the following table illustrates the ranking of the attrib-utes during the analysis that means the attribute is ranked based on correlation value and the value is large there is strong correlation between the attribute and the value is low there is less correlation between the attribute .
Correlation value Attribute Name Ranked order
0.06519 Crop type 1st
0.06073 Region 2nd
0.03883 Fertilizer used 3rd
0.03597 Filed is irrigated 4th
0.03571 Fertilizer type 5th
0.03067 Damage crop 6th
0.01728 Extension 7th
0.01349 Field type 8th
0.01334 Damage type 9th
0.01236 Seed type 10th
0.00609 head sex 11th
0.0054
If chemical fertilizer used 12th
0.00207 OWNTYPE 13th
4.2. Discovering the rules
Depending on the choice of the thresholds, the algorithm can become very slow and generate an extremely large amount of results or generate none or too few results, omitting valuable infor-mation [29][23].
4.2.1. Experimental setup to discover the rules
Configuring minimum support 0.10, and minimum confidence of 0.9; some of the rules are
Rule Support Confi
fi-dence
Lift
Damage type=non-chemical 31456 ==> Seed type=Non-Improved 30757
0.1 0.98 1.12
filed is irrigated=No If chemical fertilizer used=Not Stated 31351 ==>Extension=No 29725
0.1 0.95 1.07
region=Oromia 32071 ==> filed is irrigated=No 30126 0.1 0.94 1.03 filed is irrigated=No 35550 ==> OWNTYPE=Private 33331 0.1 0.94 1.01
Table 7: Configuring minimum support 0.10, and minimum confidence of 0.9
Configuring minimum support of 0.15and minimum confidence of 0.7; some of the following rules are discovered:
Rule support
confi-dence
Lift region=Oromia head sex=Male crop type=Wheat filed is
irrigat-ed=No Seed type=Non-Improved If chemical fertilizer used=NotStated yield production per hectare=Bad 7012 ==> Damage crop=No 5844
0.15 0.84 1.27
region=Oromia head sex=Male crop type=Wheat filed is irrigat-ed=No Damage crop=No If chemical fertilizer usirrigat-ed=Not Stated yield production per hectare=Bad 5898 ==> Seed type=Non-Improved 5844
0.15 0.99 1.13
head sex=Male crop type=Maize Damage type=non-chemical 6909 ==> region=Oromia If chemical fertilizer
used=NotStated5844
0.15 0.85 1.18
region=Oromia head sex=Male crop type=Wheat Damage crop=No If chemical fertilizer used=Not Stated yield production per hectare=Bad 6115 ==> filed is irrigated=No Seed type=Non-Improved 5844
![Figure :the data mining process[14].](https://thumb-us.123doks.com/thumbv2/123dok_us/8397467.1685154/16.612.84.532.248.458/figure-the-data-mining-process.webp)
![Figure 1 knowledge discovery in database[15]](https://thumb-us.123doks.com/thumbv2/123dok_us/8397467.1685154/17.612.76.567.167.413/figure-knowledge-discovery-in-database.webp)
![Figure 2:Schematic of SEMMA original from SAS Institute)[16]](https://thumb-us.123doks.com/thumbv2/123dok_us/8397467.1685154/18.612.138.464.139.492/figure-schematic-of-semma-original-from-sas-institute.webp)
![Figure 3:The CRISP-DM life cycle[19]](https://thumb-us.123doks.com/thumbv2/123dok_us/8397467.1685154/20.612.79.531.75.449/figure-the-crisp-dm-life-cycle.webp)