© 2016, IRJET | Impact Factor value: 4.45 | ISO 9001:2008 Certified Journal
| Page 1367
Performance Evaluation of AODV, DSR and DSDV Protocols Based On
Network Size & Density of Nodes
1
Anil Saini
, 2Rajender Nath
1
Ph.D. Research Scholar,
2Professor
1,2
Department of Computer Science & Applications, Kurukshetra University, Kurukshetra-136119
1[email protected], 2[email protected]
---***---Abstract -
MANET is an emerging approach to wireless communication with potential applications in random and dynamic environments. MANETs do not have central administrator due to mobility of nodes and frequent breakage of links among nodes. Absence of central administrator makes the routing in MANETs a very challenging task. Many routing protocols for MANETs have been developed and reported in the literature but they still lack in performance. With this motivation, three widely used routing protocols viz. AODV, DSR and DSDV protocols are selected for their performance evaluation by considering the variation in network size, routing energy consumption and density of nodes. A simulation model with scenario of (50-500) nodes along with 8 UDP connections is designed and implemented on NS2 simulator to study inter-layer interactions and performance of the protocols are analyzed and experimental results show that DSR performs better as compared to DSDV and DSR.Key Words
:
AODV, DSDV, DSR, End-to-End Delay, Energy Consumption, NRL, MANETs, PDF, Throughput.
1. INTRODUCTION
Ad hoc wireless technology is an emerging approach to wireless communication with potential applications in random and dynamic environments. In contrast to cellular and infrastructure based networks, it does not possess any fixed infrastructure or central administrator such as router. MANET is a set of independent system of mobile nodes that move freely and randomly. Its network topology is dynamic in nature and may change speedily and randomly. Due to this the intercommunications among nodes keep on changing. MANET [2, 10] depends on many other aspects including location of request initiator, topology of network and optimum selection of routers and specific underlying features that could work on finding the path rapidly and efficiently. In MANETs, routing protocols are used to decide the optimal route for packet transfer and make sure that the packets are reached to the desired destination. Several routing protocols for MANETs have been given and their performance under different network situations and traffic constraints has been considered. Routing protocols are categorized as: proactive and reactive. Proactive based routing protocols [8] are also known as table driven routing protocols. It maintains optimal routing information for each
node in the network by spreading route update information at periodic intervals. Many proactive routing protocols have been proposed in the literature such as Wireless Routing Protocol (WRP), Destination-Sequenced Distance Vector (DSDV) routing protocol, Optimized Cluster-Head Gateway Routing (CGSR). In reactive based routing [7, 8] protocols, also known as on-demand routing protocol, takes a different method for routing as compare to proactive protocols. The advantage is that when a path is desired, it is immediately available which reduces the routing overheads. Various Types of reactive based Routing Protocols are: Dynamic Source Routing (DSR) [1, 2], Ad hoc On-demand Distance Vector (AODV) [3, 6], Temporally Ordered Routing Algorithm (TORA). Among these protocols three widely used routing protocols viz. Ad-hoc on demand Distance Vector (AODV), Dynamic Source Routing (DSR) and Destination Sequenced Distance Vector (DSDV) protocols are selected for their performance evaluation by considering the density of nodes. AODV routing protocol uses a reactive approach to discover routes; it uses the destination sequence number to determine fresh path to the destination, which distinguishes it from other reactive based routing protocols; it also uses a broadcast route discovery process to find a path to the target and then target node uses the unicast route reply massage to reply back to the source, whereas DSR is designed mainly to use in multi-hop mobile ad-hoc networks. In DSDV every node in the network maintains a routing table in which all the possible destinations within the network as well as the number of hops to reach each destination are recorded. Each route entry is marked with a sequence number. Nodes periodically transmit routing table updates throughout the network in order to maintain table consistency
This paper analyzes the AODV, DSDV and DSR protocols by considering the variation in network size, routing energy consumption and density of nodes by using performance evaluation metrics such as packet delivery fraction, average energy consumption per received packet, throughput, end-to-end delay, and normalized routing load.
© 2016, IRJET | Impact Factor value: 4.45 | ISO 9001:2008 Certified Journal
| Page 1368
2. RELATED WORK
There are numerous papers [6, 8, 9, 12, 13, 20, 21] related to the performance evaluation of routing protocols in MANETs. Khattak, M. A. H. et al [6] analyzed various routing protocol by changing the mobility and density of nodes with TCP and UDP traffic. They show that all routing protocols did well under TCP traffic type whereas PDR was less in case of UDP due to unreliable transmission.
Chenna R. et al. [8], Gaiwak, L. G. et al [9] presented a detailed simulation of DSDV, AODV and DSR with 40 wireless nodes forming ad hoc networks and the author concluded that DSDV and TORA indicate decent performance in a network with low mobility whereas AODV and DSR maintain comparatively better performance in all mobility situations. Dadhania, P, et al. [12] observe that, for application oriented metrics such as delay and throughput, DSR outperforms AODV when the numbers of nodes are smaller. AODV outperforms DSR when the number of nodes is very large. The authors show that DSR consistently generates less routing load than AODV.
Gupta, S. et al. [13] compared the performance of AODV and DSR protocols considering three different scenarios by using network routing load, packet fraction rate and end-to-end delay metrics. They found DSR started losing data packets when mobility of nodes and network resource were increased.
Kanungo, P. et al. [20], Performances of AODV, DSR, OLSR and DSDV are analyzed on randomly generated traffic pattern and mobility with different number of nodes and size of network. As a result, OLSR gives better solution for high mobility with high number of nodes on the network than other objective routing protocols (AODV, DSR, and DSDV). But in small size of network (600m X600m) with small mobility of node, DSR gives highest performance on PDR parameters.
Grover, J. T. et al. [21], several routing protocols (AODV, DSDV, and DSR) is analyzed on different transmission range with different number of node and mobility of nodes. In this simulation, AODV has maximum packet delivery ratio and maximum throughput compare to DSDV and DSR. And this paper shows performance of routing protocol could be enhanced in higher transmission range and higher mobile environment.
3. PERFORMANCE EVALUATION OF AODV, DSR
AND DSDV PROTOCOLS
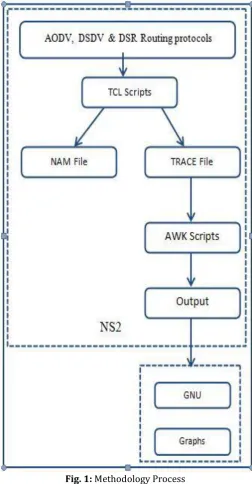
As discussed in the forgoing section, AODV, DSDV and DSR protocols have not been studied in high mobility case under low, medium and high density scenario. Hence, this paper focuses on evaluating AODV, DSDV and DSR protocols by considering network size, energy consumption and density of nodes. For evaluation following metrics are used - Throughput, Average Energy Consumption, PDF, NRL and End-to-End Delay. Fig. 1 shows the methodology of studying the performance of the protocols. A TCL script with wireless scenario & traffic pattern of mobile nodes is created, which is run on the network simulator. The outcomes of the
[image:2.595.308.561.135.620.2]simulation are trace file & the awk script, which are used for analysis.
Fig. 1: Methodology Process
The following five metrics are used to evaluate the performance of the protocols:
Throughput: Throughput is defined as the number of packets successfully transferred from sender to the receiver per unit time.
© 2016, IRJET | Impact Factor value: 4.45 | ISO 9001:2008 Certified Journal
| Page 1369
Packet Delivery Fraction (PDF): This is the ratio of the number of data packets successfully delivered to the receiver to those generated by the sender.
End-to-End Delay: It is average time required to transfer the data packets from source to destination.
Normalized Routing Load (NRL): The number of routing packets transmitted per data packet delivered at the destination.
4. SIMULATION AND RESULTS DISCUSSIONS
[image:3.595.304.562.79.284.2]The experiment was performed using Network Simulator NS2.35 by using the parameters shown in Table 1. The traffic sources were UDP Constant Bit Rate (CBR). The source destination pairs were spread randomly over the network. The model used for mobility was ‘random waypoint model’ in a rectangular field of 670m x 670m with (50-500) nodes as shown in table 1.
TABLE 1: Simulation Scenario Parameters Values
Simulator NS 2.35
Media Access Control 802.11 Simulation Period 500 sec.
Channel Wireless Channel
Protocols AODV, DSDV, DSR
Antenna Model Omnidirectional Simulation Range 670m × 670m
Traffic Type CBR (UDP)
Radio Propagation TwoRay Ground
Interface Queue Type DropTailPriQueue (AODV & DSDV), CMUPriQueue (DSR)
Number of Nodes 50,100,200,300,400,500 Mobility Model Random Way Point
Packet Size 512 Bytes
Number of Connections 8
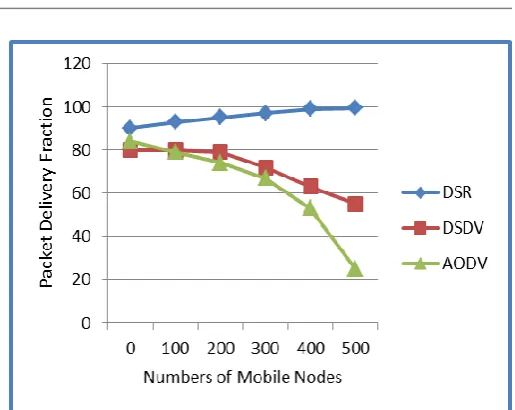
Fig.-2: Packet Delivery Fraction Vs Number of Mobile Nodes
Fig. 2 shows the PDF of AODV, DSDV and DSR protocols with constant pause time 0 second and varying number of mobile nodes 50 to 500. X-axis represents number of mobile nodes &Y-axis represents PDF. Experiment results shows that PDF of DSR is much better than AODV & DSDV when number of mobile nodes are increased. Results further shows that PDF of AODV & DSDV sharply decline when number of mobile nodes are increased indicating that these protocols cannot cope up with excessive traffic generated in the network and hence are not suitable in such scenario. The second remarks about the good performance of DSR is due to because the DSR protocol knows all cache routes so probability of choosing stale route is less. This strategy ultimately save the network bandwidth, which leads to improve the performance of DSR protocol, especially when the number of node increased.
[image:3.595.51.557.518.757.2]© 2016, IRJET | Impact Factor value: 4.45 | ISO 9001:2008 Certified Journal
| Page 1370
Fig. 3 shows the average energy consumption of AODV, DSDV and DSR protocols with constant pause time 0 second and varying number of mobile nodes 50 to 500. X-axis represents number of mobile nodes & Y-axis represents Average Energy Consumption. Experimental results shows that DSR performed more efficient than DSDV and AODV in high mobility conditions and also shows that the energy consumption is increasing with the increase in the number of mobile nodes. The results also indicates that AODV consumes the highest energy with increasing the number of mobile nodes.
Fig.-4: Average End-to-End Delay Vs Number of Mobile Nodes
Fig. 4 shows the average End-to-End Delay of AODV, DSDV and DSR protocols with constant pause time 0 second and varying number of mobile nodes 50 to 500. X-axis represents number of mobile nodes & Y-axis represents average End-to-End Delay. Experiment results show that the best average End-to-End Delay is exhibited by DSR and DSDV protocols. It is also observed that AODV is the worst protocol in terms of delay due to increase in the number of broken routes and the extra transmission of control messages used by AODV. The results also shows that the best average end-to-end delay for DSDV protocol is lesser than both DSR and AODV.
Fig.-5: Throughput Vs Number of Mobile Nodes
Fig. 5 shows the throughput of AODV, DSDV and DSR protocols with constant pause time i.e. 0 second, and varying number of mobile nodes 50 to 500. X-axis represents number of mobile nodes & Y-axis represents Throughput. Experimental results show that AODV has lowest throughput as compared to DSDV and DSR. This decline in the performance indicates that AODV cannot cope up with the excess traffic generated in the network and the results indicate that the DSDV has the highest throughput amongst the three protocols.
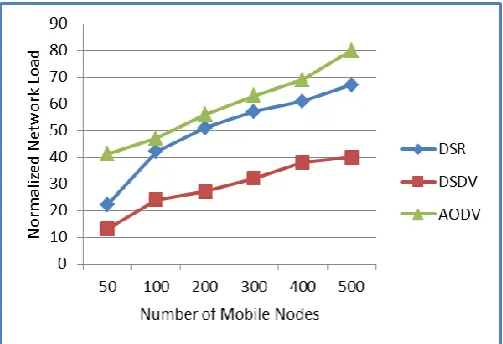
Fig.-6: Normalized Routing Loads Vs Number of Mobile Nodes
Fig. 6 shows the normalized routing loads of AODV, DSDV and DSR protocols with constant pause time 0 seconds and varying number of mobile nodes 50 to 500. X-axis represents number of mobile nodes & Y-axis represents normalized routing loads. Experimental results show that the normalized routing load of AODV and DSR is much higher than the DSDV when the number of mobile nodes are increased. Due to requirement of more routing packets to maintain transmission of data packet by AODV, it has inconsistent and worse normalized routing loads than DSR and DSDV.
From the results discussed above the authors makes the following observations:
(i). For AODV and DSDV the PDF start to decline quickly when the number of mobile nodes grows beyond 200 nodes
(ii). The performance of AODV and DSDV cannot be guaranteed for large networks of mobile nodes. (iii). The DSR protocol demonstrates a significant lower
routing overhead as compared to DSDV and AODV large networks.
5. CONCLUSIONS
[image:4.595.37.288.233.402.2]© 2016, IRJET | Impact Factor value: 4.45 | ISO 9001:2008 Certified Journal
| Page 1371
basis of nodes density and constant pause time. The experimental results have shown that DSDV and DSR protocols have outperformed AODV in terms of Throughput when the number of mobile nodes in the network are increased. Average End-to-End Delay is least for DSDV and is not changing when the number of mobile nodes are increased. It has also been found that the DSR & AODV have given better results as compared to DSDV in terms of normalized routing loads. On the other side DSR is better in terms of PDF when number of mobile nodes are increased. Overall it has been observed that DSR has performed better than AODV and DSDV protocols.
REFERENCES
[1]Hakak, S., “Impact of packet size and node mobility pause time on average end to end delay and jitter in MANETs”, IEEE International Conference on Computer and Communication Engineering (ICCCE), pp. 56-59, Sept. 2014.
[2]Khediri, E. S. et al., “Routing protocols in MANET: Performance Comparison of AODV, DSR and DSDV Protocols Using NS2”, IEEE International Symposium on Networks, Computers and Communications, pp. 1-4, 17-19 June 2014.
[3]Kumar, P. et al., “Effect of Pause Time on Performance of AODV and DSR Routing Protocols in Wireless Ad-hoc Networks”, International Journals of Modern Trends in Engineering and Research, Vol. 1, Issue 5, pp. 61-70, November 2014.
[4]Ahmed, A., “A Comparative Study of AODV & DSR with Varying Speed, Pause Time and Node Density over TCP Connections in VANET”, Vol. 2, Issue 12, pp. 3915-3955, December 2014.
[5]Jamalia, A. et al., “Scenario Based Pause Time Analysis of AODV, DSDV and DSR over CBR Connections in MANET”, vol. 1, no. 1, pp. 57-60, February 2013.
[6]Khattak, M. A. H. et al., “Challenging Ad-Hoc Networks under Reliable & Unreliable Transport with Variable Node Density”, Journal of Theoretical and Applied Information Technology, 2008.
[7]Katiyar, S. et al., “Comparative Performance Analysis of MANET Routing Protocols in Military Operations using NS2”, International Conference on Green Computing and Internet of Things (ICGCIoT), pp. 603-609, 2015. [8]Chenna, R. et al., “Performance Analysis of Ad-hoc
Network Routing Protocols”, ISAUHC, pp. 186-187, 2006. [9]Gaiwak, L. G. et al., “Simulation based comparative performance analysis of Ad-hoc routing protocols”, TENCON- 2008, pp. 1-5, 2008.
[10] Royer, E. M., “A Review of Current Routing Protocols for Ad Hoc Mobile Wireless Networks”, University of
California, Santa Barbara Chai-Keong Toh, Georgia Institute of Technology, vol. 2, pp. 1-12, 2004.
[11] The Network simulator ns-allinone 2.35, http://www.isi.edu/nsnam/ns.
[12] Dadhania, P., et al., “Comparative performance analysis of AODV and DSR routing protocols in MANET” International Journal of Emerging Trends and Technology in Computer Science (IJETTCS) ISSN: 2278-6856 vol. 1, no. 3, September – October 2012.
[13] Gupta, S. et al., “Performance comparison of routing protocols using different mobility models”, IJMECS, vol. 4, no. 8, pp.54-61, 2012.
[14] Kaushik, S.S. et al., “Comparison of effectiveness of AODV, DSDV and DSR routing protocols in mobile ad hoc networks”, International Journal of Information Technology and Knowledge Management, vol. 2, no. 2, pp.499-502, 2009.
[15] Bharti, M. et al., “Performance Evaluation of Energy Consumption for AODV and DSR Routing Protocols in MANET”, IEEE International Conference on Computer & Information Science (ICCIS), pp. 636-642, 2012. [16] Upadhyaya, S. et al., “comparison and performance
analysis of reactive type DSR, AODV and Proactive type DSDV routing protocol for wireless mobile ad-hoc network, using NS-2 simulator”, Journal of Engineering and computer innovations, vol. 2, no. 10, pp. 36-47, march 2012.
[17] http://www.isi.edu/nsnam/ns/ns.
[18] Taksande, V. K. et al., “Performance Comparison of DSDV, DSR and AODV protocol with IEEE 802.11 MAC for chain topology for MANET using NS-2”, 2nd National Conference on computing, communication and sensor network, pp. 26-31, CCSN 2011.
[19] Gupta, A. K. et al., “Review of various Routing Protocols for MANETs”, International Journal of Information and Electrical Engineering, vol. 1, no. 4, pp. 251-259, 2000. [20] Kanungo, P. et al., “Performance analysis of AODV, DSR, OLSR and DSDV Routing Protocols using NS2 Simulator”, Procedia Engineering, vol. 23, pp. 229–234, 2011.