Centrality-Based
Paper
Citation
Recommender
System
Abdul
Samad
1,
Muhammad
Arshad
Islam
2,
Muhammad
Azhar
Iqbal
1,∗,
Muhammad
Aleem
1 1Capital University of Science and Technology, Islamabad, Pakistan2FAST-National University of Computer and Emerging Sciences, Islamabad, Pakistan
Abstract
Researchers cite papers in order to connect the new research ideas with previous research. For the purpose of finding suitable papers to cite, researchers spend a considerable amount of time and effort. To help researchers in finding relevant/important papers, we evaluated textual and topological similarity measures for citation recommendations. This work analyzes textual and topological similarity measures (i.e., Jaccard and Cosine) to evaluate which one performs well in finding similar papers? To find the importance of papers, we compute centrality measures (i.e., Betweeness, Closeness, Degree and PageRank). After evaluation, it is found that topological-based similarity via Cosine achieved 85.2% and using Jaccard obtained 61.9% whereas textual-based similarity via Cosine on abstract obtained 68.9% and using Cosine on title achieved 37.4% citation links. Likewise, textual-based similarity via Jaccard on abstract obtained 35.4% and using Jaccard on title achieved 28.3% citation links.
Received on 28 March 2019; accepted on 28 April 2019; published on 13 June 2019
Keywords: Citation Recommendation, Textual Similarity, Topological Similarity
Copyright © 2019 Abdul Samad et al., licensed to EAI. This is an open access article distributed under the terms of the Creative Commons Attribution license (http://creativecommons.org/licenses/by/3.0/), which permits unlimited use, distribution and reproduction in any medium so long as the original work is properly cited.
doi:10.4108/eai.13-6-2019.159121
1. Introduction
Extensive amount of research plethora is being pub-lished every year which ensues complexity in coping up with contemporary trends in a particular domain [5]. Furthermore, it also makes it difficult for researchers to identify relevant research articles of their interest or associate them to the previously published stud-ies. With the digitization of research publications, rec-ommender systems have been introduced to augment the search for related items which are relevant to a researcher0s field of interest. In recommender systems, characteristics of a user (i.e., type of items a user likes) are considered as input parameters, which produce results in the form of recommending most relevant items according to users0
interests. Here, “Item” is an abstract term, which is used to represent what the system recommends to a user.
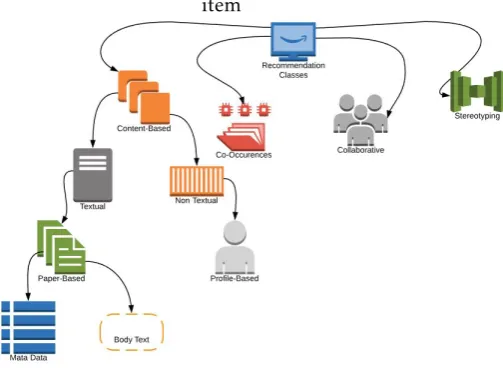
The recommendation techniques are broadly cate-gorized into content-based, collaborative filtering, co-occurrences, and graph-based techniques as shown in Figure1.
∗
Corresponding author. Email:[email protected]
item
Figure 1. Recommendation Classes
Content-based Filtering (CBF)is considered among
the most widely exploited recommendation technolo-gies [19]. CBF infers the interests of users from the items that user has relations with. Relationship is constructed through identification of actions, such as eating, study-ing, writing or teaching.
Collaborative Filtering (CF)approaches [9,15], on the other hand, are dependent on the ratings from the users of the system. The assumption followed in collaborative filtering based approaches is that rating provided by one user regarding a particular item would likely to be closer to the interest of other users as well. For example, most probably a user likes to rate items in similar fashion as other users have provided ratings about those items. Co-Occurrence recommendations focus on the items that frequently co-occur with the selected item. The information pertaining to users behavior in terms of likeness is usually selected using multiple databases.Stereotypingis one of the less used recommendation classes. It relies on the generalized assumptions about users. These stereotypes are then used for making recommendations to other users.
Citation recommendation addresses the task of providing recommendations based on an abstraction of the user0s profile or contents of paper. The first research-paper recommender system was introduced in 1998 by Giles et al. [6] as part of the CiteSeer project. The recommender systems are also used to suggest relevant papers for citation as well as for the topic of interest. However, the excessive amount of research papers on the web poses following problems for new scholars who intend to find relevant research papers to conduct a research study in specific domain. The problems include: (1) which of the items are most relevant? Which recommendation approaches are most promising? Which paper is a notable study in their field of interest? To date, various research papers recommendation techniques have been proposed. To the best of our knowledge, most of the existing paper recommendation techniques only focus on the similarity among papers. These technique do not consider importance of the recommended paper. This situation arises a question that how we can find the worthy papers? The main focus of this paper is to recommend the similar but important papers for citation.
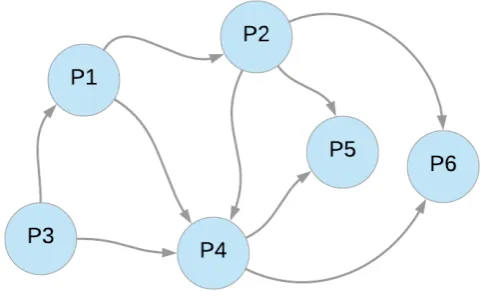
Egghe et al. in [10], explain that documents in a collection C may form a citation network or graph in which vertices represent documents and edges represent citations from one document to the other. Authors elaborate through an example that “when a document di cites a document dj, we can show this by an arrow going from the node representing di to the document representing dj”. Citation network is helpful for the evaluation of publication and authors [14]. Citation network is known as directed network wherein nodes are considered as papers and edges represent the citation relation among them. Consider an example of a citation network shown in Figure 2, where P1 cites P2 and P4, P2 cites
P4, P5, and P6 and so on. For recommendation of worthy papers, centrality metrics are used in this
Figure 2. Citation Network
work, i.e., Degree [29], Closeness [4], Betweeness [29] and PageRank [4]. In this study, we have evaluated bibliography and citations as topological features for finding and recommending similar papers. Moreover, metadata (i.e., title and abstract) of the paper is also considered as a textual feature to find similar papers. To compute similarity between research papers, we have
used jaccard similarity and cosine similarity measures
on textual and topological features. To recommend relevant and similar papers, topological features (i.e.,
citationsandbibliography) are used in citation network.
2. Literature Review
A recommender system can be considered as a black box which takes input in the form of a user profile and matches it against a candidate set of items in order to suggest previously unseen items for a user [2]. A recommender system assists users in decision making under complex information environments [17]. In the research-paper recommender-system community, CBF is the most prevailing approach. Almost 55% of the researcher papers recommender systems have applied the idea of CBF [3] [14]. Relationship between users and item was typically established through authorship [2] having papers in one0s personal collection [3], adding social tags [11], or downloading [22], reading [31], and browsing papers [3] [7].
provide ratings”. A similar problem was reported in [21], which was resolved by creating artificial ratings for the purpose of evaluation. This highlights main problem of CF related to user participation also referred
ascold-startproblem. This problem is arise may occur
in three circumsatnces [26]: (i) new users, (ii) new item, and (iii) new communities. If a new user is introduced to the system and he rates few or no item, it is difficult for the system to find like-minded users. Therefore, system is not able to provide recommendations. If an item is inserted in the system and no user has rated it yet, system is not able to recommend it to other users. If a new community is formed and no users from the community have rated any item, then the system cannot make recommendations. Authors in [27], state that relatedness of two papers is directly proportional to the number of time they are co-cited. Stereotyping which is introduced in 1979 byRich[24], recommends item by determining the characteristics of user. In the domain of research-paper recommender systems, only [1] employed stereotypes based recommendation technique.
Authors in [16] proposed a recommender system calledRfSeer, which recommends papers on the basis of topic as well as context of the citation. This system is very helpful for reviewers to validate references. According to [16], for topic-based model, authors used contents of papers that are parsed. They also extracted sentence in which citation is made. Furthermore, authors extracted sentences before and after the citation sentence and made a citation context using these three sentences. After getting the query, their system picks top 5 topics using topic-based model and recommends a list of citations. According to [16], topic-based citation recommendation is effective because the list of recommended citation is made through topics, and in this way, these recommended citations are clustered. In the citation context method, the context of the citation is the source and all the references are target. In the citation context, according to [16], after getting the query and using words of the query, the system [16] assigns a score to all references. Then authors calculate term-frequency-inverse-context-frequency (TF-ICF) to check the need of citation. In the experiments, they found that citation context recommendation gets 50% recall, whereas precision for both topics-based and citation context-based indicate that 1 recommendation is correct out of 10 recommendations. The global recommendation which is topic-based and local recommendation which is context-based, are able to determine the relevancy among papers; however, it cannot specify importance of a recommended paper.
Most recommender systems are used by editorial managers of the journals for reviewers assignment [14]. For reviewers assignment, reviewers profile
and abstract of the papers are used, whereas for citation recommendation current citations are used to generate relevant citations. In [6], Authors built a prototype of CiteSeerX that requires title, abstract and citation context as input. Here, citation context is a sentence wherein paper has been cited in body of a paper. In their experiments, they found that global recommendation has recall of 0.45 on top 25 recommendations. As the recommendations increased, recall also increased. At 250 documents, the recall was 0.65. Local recommendation results were also like this. The maximum recall was 0.6.
Recommendation of research papers is being consid-ered as the main issue of the current era because a huge amount of research papers are being published and find new items related to your work has also become a challenge. According to [28], from 1998 to 2014, almost 120 recommender systems have been pub-lished. But it still does not know which recommender system gives good results [28]. Authors in [28], also tried to make the recommender system using similarity measures. They used three similarity measures, which are bibliographic coupling, co-citation coupling and two variants of cosine similarity. According to them, content-based similarity measures do not produce good results. Because the content of some papers does not available freely. Therefore, they limit their selection to network-based similarity measures. They compare these network-based similarities [28] on mathematical as well as empirical level. In mathematical compari-son, they found that co-citation similarities produced the results that are less or equal to cosine similar-ity using columns of the adjacency matrix. Similarly, bibliographic similarities produced the results less or equal to cosine similarity using rows of the adjacency matrix. Further, authors concluded that there is a linear relationship in the computed similarity values.
In 2015, Hanyurwimfura [13] proposed a citation recommendation systems for non-profile users. His methodology was helpful to new users having no data to compensate for their profile. They used content-based filtering approach, and considered long queries as well as short queries as input. Long queries were taken from title and abstract, whereas short queries are taken from the body of paper as well as from the title of the paper. The similarity between the query and research paper is calculated using cosine similarity measure and recommendation of research papers are made according to the obtained score. For the evaluation of their recommendation system, recommendations are rated for its relatedness to their field of work of the users. They found that query generation methods are the main reasons for the best performance of their recommendation system.
They split the corpus into two parts based on a time-frame. The older papers were from the training set and the recently published papers were from the validation/test set. The authors employed different features including PageRank for paper, author, venue, the age of the paper, content similarity between titles, abstracts etc. Using these features, they trained a Ranking SVM model. Evaluation was done against a few baseline approaches such as a CF and CBF. In the offline evaluation, which was done on a Social Scholar dataset of 730,605 papers for 10,000 authors, it was reported that PaperTaste system outperformed other contemporary systems in terms of the NDCGk value. Philip [23] uses a keyword-based vector space model to make item recommendations for digital libraries. They built a system with user interactions in order to build a user profile. They model papers by their keywords using a tfidf approach and uses the cosine similarity measure to find relevant items to recommend items based on an input query.
3. Research Methodology
Most of the recommender systems research studies are based on textual similarity. They find similar research papers by analyzing contents of the research papers, however, none of them considers the ranking among the recommended papers. In this paper, we evaluate textual and topological similarity for citation recommendation to address the following research questions.
1. Which aspect of citation analysis (Citation and
Bibliography) is more suitable in identification of
citation links?
2. Which aspect (Title,Abstract) accurately identifies citation links for textual similarity?
3. Are topological similarity measures better than textual similarity measures to predict a citation link?
4. How accurate are topological similarity measures
(Jaccard, Cosine) for correct identification of
citation link?
5. Which centrality measure (Betweeness, Closeness, Degree and Pagerank) is more accurate in identifying citation links?
3.1. Dataset Description
We have used ArXiv HEP-TH (High Energy Physics Theory) [18] dataset in this paper for the experiments. The data was originally released as a part of2003 KDD
Cup [12].KDD Cup 2003, a knowledge discovery and
data mining competition held in conjunction with the 9th Annual ACM SIGKDD Conference. The data set contains a citation graph comprising of 27,770 papers
with 352,807 edges. If a papericites paperj, the graph contains a directed edge fromitoj. The edges related to the citations of papers that do not exist in the dataset are missing. Moreover, this dataset contains profile of every paper. These profiles contained 9 different metadata parameters (i.e., paper id, primary author,
published date,paper title,co-authors,comment,Abstract
and journal reference). In order to computer textual
similarity, we have extracted two parameters (i.e.,Title
andAbstract). For computing topological similarity, we
have extracted citation graph from original citation graph. The extracted citation graph contained 8179 papers and 1438906 edges.
3.2. Centrality Metrics
In this paper, we have employed four commonly used centrality measures which are Degree, Closeness, Betweeness, and PageRank.
• Degree Centrality: Degree centrality is defined as the number of edges that a node shares with others and ultimately signifies the influ-ence/importance of the node in a network. Degree centrality [29] of a nodeidetermines its connec-tivity in the network and is represented as:
CD(ni) =deg(ni) (1) Whereni shows the current paper whose degree is to be computed. For directed networks, two measures of degree centrality are represented i.e. In-degree and Out-degree .
– In-degree:In a network, In-degree represents the count of the number of edges directed towards the node [29].
– Out-degree: In a network, Out-degree repre-sents the number of edges that node directs to other nodes in a network [29].
• Closeness Centrality: The Closeness of a node is measured by the average length of the shortest paths between the node and all other nodes. In a citation network, the value of Closeness indicates the average number of papers to be followed via references of other papers to traverse from single paper to any other paper in the network. The formula to calculate Closeness is as follows [4]:
Cc= N X
i=1 1
• Betweeness Centrality: Betweeness centrality defines the range in which a specific node lies between other nodes in a network. It was introduced by Xue et al. [29]. A node is said to be more influential if it is on the shortest paths joining many node pairs or maybe it is in that position where node acts as a bridge between the pairs. Betweeness of nodeirepresents the ratio of all shortest paths passing through it [29] as shown in Equation3.
g(v) = X s,v,t
σst(v)
σst
(3)
where σst is the total number of shortest paths from nodesto nodetandσst(v) is the number of those paths that pass throughv.
• PageRank Centrality: PageRank is an algorithm
which is generally used to rank web pages. Normally, PageRank is calculated by the number of pages associated with the main website. PageRank of a node determines the node0s comparative importance within the whole set of nodes in the network. The formula to calculate PageRank is as follows [4]:
P R(P i) =1−d
N +d
X
p∈M(pi)P R(P j) L(P j) (4)
In Equation4:
– N represents a number of edges/pages, – drepresents dumping factor and an arbitrary
weighting factor,
– P R(P i) is the PageRank of node/page, – L(P j) is the number of outgoing edges from
the node,
– M(pi) is the set of links.
3.3. Generating Nodes Lists
Further, sorted node list is computed based on Degree centrality. We have picked 4 set of nodes (top10%, top8%, top6%, and top4%) from the top of list and formed another 4 lists. These extracted lists of papers further explored for similarity computation. After applying Betweeness, Closeness, and PageRank, we obtained other 12 lists. The extracted lists are explained in Table1.
Table 1. Lists of Nodes After Applying Centrality Measures (i.e., Degree, Betweeness, Closeness and PageRank)
List Nodes
T otalN odesinDataset 8179
T op10% 818
T op8% 654
T op6% 490
T op4% 327
3.4. Generating Edges Lists
After applying centrality measures, we obtained total 16 set of nodes where 4 sets belong to each centrality measure (as shown in Table1). The next step is to obtain lists of edges in order to compute similarity. For making lists of edges, following steps are performed.
• First we Picked up four lists (i.e., top10%, top8%, top6% and top4%) of Degree centrality measure (as shown in Table2).
• Using top10% list, we randomly pick one indegree edge from each node and formed edge list called top10%-1. Considering Table 2, top10% list contains 818 nodes, so the extracted edge list contains 818 edges.
• To form second edge list, using top10% list, two indegree edges are randomly picked from each node and made another edge list top10%-2. This list contains 1634 edges.
• For the third edge list, we used top8% list, then we randomly picked 3 indegree edges from each node and make top8%-3 edge list. Here, in this list, number of edges are 1962.
• To form the fourth edge list, we used top6% list. Here, 4 indegree edges from every node are randomly picked and formed top6%-4 edge list. This list contained 1960 edges.
• For the fifth edge list , top4% list used. Here, we randomly picked 5 indegree edges from each node. Then formed another list called top4%-5. This list contains 1635 edges.
• Finaly, the 10 iterations are performed on the above 5 steps. In this way, 50 edge lists are computed just for the Degree centrality.
(citation) edges are picked and 200 edge lists (50 for each centrality measure) were made. The same procedure (which is applied on indegree edges) was applied in order to pick outdegree (bibliography) edges. In the end, we have 400 edge lists (200 for each indegree and outdegree). Furthermore, statistics of edges lists are shown in Table2.
Table 2. Edge Lists for Each Centrality Measure (i.e., indegree, outdegree, Betweeness, Closeness and PageRank)
Edge List Edges Nodes
T op10%−1 818 1634 T op10%−2 1634 3268 T op8%−3 1962 3924 T op6%−4 1960 3920 T op4%−5 1635 3270
Table 3. Edge Lists of 10 Different Iterations for Each Centrality Measure i.e., indegree, outdegree, Betweeness, Closeness and PageRank)
Edge List Edges Nodes
T op10%−1 8180 16340 T op10%−2 16340 32680 T op8%−3 19620 39240 T op6%−4 19600 39200 T op4%−5 16350 3270
Sum 80090 160180
After performing 10 iterations for every list, statistics of edge lists are shown in Table3.
3.5. Textual Similarity
Text Similarity is calculated between documents and web pages on the basis of text mentioned in them. In this paper, we computed text similarity between set of papers usingTitle and Abstract. Cosine similarity and Jaccard similarity [25] are used to compute similarity of papers, because these measures are usually used to measure similarity between two vectors[8]. Equation 5 is the Cosine, while Equation 6 represents Jaccard index.
Cos(d1, d2) = d~1˙~d2
|d1|˙|d2| (5) Jac(A, B) = |A
T
B| |AS
B| (6)
Titlesimilarity is calculated between titleof the citing
and cited papers. Moreover, abstract similarity also computed using abstractof citing and cited papers. In Equation 5, d1 andd2 are represent the set of terms. WhileAandBin Equation6represent the set of terms.
3.6. Topological Similarity
Topological similarity is calculated between two pairs of nodes (i.e., Documents) in a graph (i.e., Citation Graph). Topological similarity follows the simple idea of mutual similarity. A score based on the similarity is given to each pair of nodes (n1,n2) that are not connected at the moment. A high score represents that probability ofn1 citing n2 is high, while a low score identifies the low likelihood ofn1citingn2. Therefore, we can predict and recommend citation for a document using the similarity scores. In a citation network, paper can have many cited papers or citing papers. Here cited papers represent the bibliography(i.e.out-degreeof paper) and citing papers represent the citations(i.e.In-degreeof paper). Citation represents the situation where one papers is cited by other papers, while bibliographic occurs when paper cites other papers.
3.7. Evaluation
In order to evaluate the textual similarity, we have checked the percentage of citation links prediction. Moreover, Accuracy measure (ratio of number of correct predictions to the total number of input samples) is used to check the topological similarity. In this paper, the input is edges of the citation graph.
• Accuracy: For evaluation purpose, we introduced accuracy model to compute the score between real graph and predicted graph. Here, accuracy represents the percentage of predicted citation links using topological similarity. The accuracy score for the predicted graphGp and real graph
Gris calculated using the Equation7.
Accuracy= 1−E(G1) +E(G2)−2E(G1
TG
2)
Max(E(G1), E(G2))
(7)
– E represents the Edges of the citation graph,
– G1is the original citation graph, – G2is the predicted citation graph,
– Max function returns the maximum number of edges from original and predicted citation graph.
4. Experiments and Results Discussion
contained a citation graph and profiles of papers published during 1993 to 2003. The citation graph contained 27770 papers and 352807 edges. The initial step was extraction of the dataset. This experiment was performed on the extracted portion of dataset, which contains 8179 papers and 143906 edges. This extracted dataset contained only those papers which have 10 or more than 10 citations. In the second phase, title and
abstractwere extracted. Degree, Closeness, Betweeness
and PageRank centrality metrics were applied on the citation graph. After applying the centrality metrics, nodes lists were formed. In order to compute similarity using co-citation and bibliography, in-degree and out-degree edges were picked to form the edge lists. After picking these edges, we have removed these edges from citation graph and made another citation graph. Finally, textual similarity and topological similarity is computed between papers. Terminology related to results description is explained in Table4.
Table 4. Textual Similarity and Topological Similarity of Documents
Term Description
Tjac Textual Jaccard similarity using Titles Tcos Textual Cosine similarity using Titles Ajac Textual Jaccard similarity using Abstract Acos Textual Cosine similarity using Abstract Topjac Topological Jaccard similarity
Topcos Topological Cosine similarity
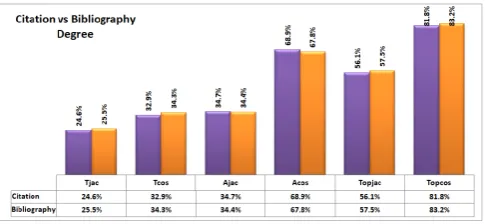
4.1. Comparisons Between Bibliography vs Citation
In this paper, experimentation is performed on 400 edge lists of 5 different kinds, where 200 edge lists belong to citation and 200 are of bibliography. In this Section, the research questions are addressed based on the obtained results.
Q: Which aspect of citation analysis (Citation and Bibliography) is more suitable in identification of citation links?
The answer of this question is shown in Figures3,4, 5and6.
• Textual Similarity(using Title): In case of
bibliography, Tcos succeeds in getting 35.6% citation links, while Tjac obtained 26.7% correct citation links (shown in Figure 6). In case of citation, highest ratio of correct citation edges achieved byTcosis 37.4% whereasTjacidentified 28.3% correct citation edges (shown in Figure 6). In case of textual similarity using title, bibliography is better option than citation.
• Textual Similarity (using Abstract): In case of bibliography, Acos achieved maximum of 68.4% citation links, while Ajacobtained 35.3% (shown
in Figure 3). Likewise, in case of citation, Acos
obtained 68.9% citation links, andAjacachieved 35.4% (shown in Figure 6). In case of textual similarity usingabstract, citation produced better results than bibliography. Overall, textual similar-ity produced better results through bibliography.
• Topological Similarity:In all the Figures (i.e.,3,
4, 5 and 6), Topcos and Topjac performed
well through bibliography. The highest results obtained by Topcos through bibliography are 85.2%, and through citation are 82.4% (shown in Figure3).
Figure 3. Comparison Between Citation and Bibliography Through Betweeness
Figure 4. Comparison Between Citation and Bibliography Through Closeness
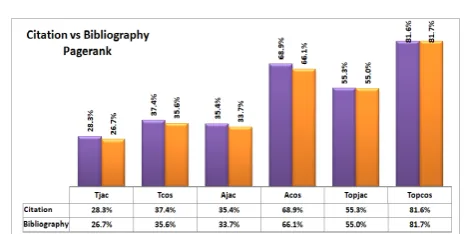
Figure 6. Comparison Between Citation and Bibliography Through Pagerank
4.2. Comparisons Between Textual Similarity vs
Topological Similarity
Q: Which aspect (Title, Abstract) accurately identifies citation links for textual similarity?
From Figures 3, 4, 5 and 6, it can be inferred that textual similarity using abstract (Acos and Ajac) outperformed the textual similarity using title (Tcos
and Tjac). The maximum result obtained by Acos is
68.9%(Figure5), and achvied byAjacis35.4%(Figure
6). Likewise,Tcos obtained37.4% (Figure6), andTjac
obtained28.3%(Figure6). It clearly shows that textual similarity using abstract produced better results than textual similarity usingtitle.
Q: Are topological similarity measures better than textual similarity measures to predict a citation link? Topological Similarity:Topcosproduced better results thanTcosandAcosby obtaining85.2%(shown in Figure 3). Likewise,Topjacscored better thanTjacandAjacby identifying 61.9% correct edges (see Figure3). In this way, topological similarity measures performed better than textual similarity measures.
Textual Similarity: Tjac and Ajac failed in obtaining highest results thanTopjacby getting28.3%and35.4%
(see Figure 6). Likewise, Tcosand Acos also could not perform well, Tcos obtained 37.4% and Acos achieved
68.9%(Figure6).
We can observe a huge difference between textual and topological similarity measures. In case ofjaccard,Tjac
andAjac produced poor results thanTopjac. While, in case ofcosine,TopcosoutperformedTcosandAcos.
4.3. Comparisons Between Cosine Similarity vs
Jaccard Similarity
Q: How accurate are textual similarity measures ( Jac-card,Cosine) for correct identification of citation link? Textual Similarity(using Title): Cosine (Tcos) simi-larity performed better than Jaccard (Tjac) similarity by obtaining 37.4% citation links, whileJaccard (Tjac) obtained 28.3% (shown in Figure6).
Textual Similarity (using Abstract):Cosine(Acos) sim-ilarity obtained 68.9%, while Jaccard (Ajac) similarity achieved 35.4% (see Figure6).
In this way, Cosine similarity outperformed Jaccard
similarity.
Q: How accurate the topological similarity measures are (Jaccard,Cosine) for correct identification of citation link?
Topological Similarity:In case of topological similar-ity,Cosine(Topcos) similarity performed better than
jac-card (Topjac) similarity. The maximum result obtained
by Topcosis 85.2%, while obtained by Topjacis 61.9%
(shown in Figure3).
It is clearly shown that, Cosinesimilarity produced better results thanJaccard.
4.4. Comparisons Between Centrality Measures
Q: Which centrality measure (Betweeness, Closeness, Degree and PageRank) is more accurate in identification of citation links?Textual Similarity (using Title): The highest results using title are obtained through PageRank, where
Tcos obtained 37.4% and Tjac obtained 28.3% (see Figure6). Likewise, lowest results are obtained through Closeness, whereTcosobtained 28.9% andTjacobtained 21.6% (shown in Figure4). Therefore, textual similarity using title produced better results through PageRank than other centrality measures.
Textual Similarity (using Abstract):In case of textual similarity using abstract, PageRank outperformed the other centrality measures. In Figure6of PageRank,Acos
succeeds in obtaining 68.9% citation links, and Ajac
obtained 35.4%. Again, Closeness could not perform well in case of abstract.
Topological Similarity: Here, in case of topological similarity, Betweeness produced better results than other centrality measures. Through Betweeness,Topcos
succeeds in obtaining 85.2% citation links, andTopjac
obtained 61.9%. It is clear that Betweeness centrality is better option for topological similarity than other centrality measures.
5. Conclusion
with highest score. Afterwards, we evaluated the centrality measures to check which centrality measures is best to find the influential papers. In case of textual-based similarity, the highest results were obtained through PageRank; while for topological similarity
Betweeness is the better options. Finally, results from
citation (indegree) and bibliography (outdegree) are
analyzed. In case of textual-based similarity usingtitle, similarity measures performed best on bibliography
(outdegree). In case of textual based similarity using
abstract, similarity measures achieved best results
through citation (indegree). However, in case of topological-based similarity, bibliography produced good results. In this study, two similarity measures are used, which are cosine and jaccard. Both similarity measures have analyzed “Symmetric" relationship of papers for finding the similarity of two papers. In some environments, such as social network, one sided similarity should be computed by using “Asymmetric" relationship instead of “Symmetric". The proposed approach can also be employed to identify links in a social network.
References
[1] Beel, J.(2017) Towards effective research-paper recom-mender systems and user modeling based on mind maps. arXiv preprint arXiv:1703.09109.
[2] Beel, J., Gipp, B., Langer, S. and Breitinger, C. (2016) paper recommender systems: a literature survey. International Journal on Digital Libraries17(4): 305–338. [3] Beel, J., Langer, S., Genzmehr, M. and Nürnberger,
A. (2013) Introducing docear’s research paper recom-mender system. InProceedings of the 13th ACM/IEEE-CS joint conference on Digital libraries(ACM): 459–460. [4] Bertsimas, D., Brynjolfsson, E., Reichman, S. and
Silberholz, J.(2014) Moneyball for academics: Network analysis for predicting research impact .
[5] Bethard, S.andJurafsky, D.(2010) Who should i cite: learning literature search models from citation behavior. InProceedings of the 19th ACM international conference on Information and knowledge management(ACM): 609–618. [6] Bollacker, K.D., Lawrence, S.andGiles, C.L.(1998) Citeseer: An autonomous web agent for automatic retrieval and identification of interesting publications. In Proceedings of the second international conference on Autonomous agents(ACM): 116–123.
[7] Bollen, J.andVan de Sompel, H.(2006) An architecture for the aggregation and analysis of scholarly usage data. InProceedings of the 6th ACM/IEEE-CS joint conference on Digital libraries(ACM): 298–307.
[8] Calvo, H.,Méndez, O.andMoreno-Armendáriz, M.A. (2016) Integrated concept blending with vector space models.Computer Speech & Language40: 79–96.
[9] Deshpande, M.andKarypis, G.(2004) Item-based top-n recommetop-ndatiotop-n algorithms. ACM Transactions on Information Systems (TOIS)22(1): 143–177.
[10] Egghe, L.andRousseau, R.(1990)Introduction to infor-metrics: Quantitative methods in library, documentation
and information science(Elsevier Science Publishers). [11] Ferrara, F., Pudota, N. and Tasso, C. (2011) A
keyphrase-based paper recommender system. InItalian Research Conference on Digital Libraries(Springer): 14–25. [12] Gehrke, J., Ginsparg, P. and Kleinberg, J. (2003) Overview of the 2003 kdd cup. ACM SIGKDD Explo-rations Newsletter5(2): 149–151.
[13] Hanyurwimfura, D., Bo, L., Havyarimana, V., Njagi, D. and Kagorora, F. (2015) An effective academic research papers recommendation for non-profiled users. International Journal of Hybrid Information Technology
8(3): 255–272.
[14] He, Q.,Pei, J.,Kifer, D.,Mitra, P.andGiles, L.(2010) Context-aware citation recommendation. InProceedings of the 19th international conference on World wide web (ACM): 421–430.
[15] Hill, W., Stead, L., Rosenstein, M. and Furnas, G. (1995) Recommending and evaluating choices in a virtual community of use. InProceedings of the SIGCHI conference on Human factors in computing systems(ACM Press/Addison-Wesley Publishing Co.): 194–201. [16] Huang, W., Wu, Z., Mitra, P. and Giles, C.L. (2014)
Refseer: A citation recommendation system. In Digital Libraries (JCDL), 2014 IEEE/ACM Joint Conference on (IEEE): 371–374.
[17] Isinkaye, F., Folajimi, Y. and Ojokoh, B. (2015) Recommendation systems: Principles, methods and evaluation.Egyptian Informatics Journal16(3): 261–273. [18] Leskovec, J., Kleinberg, J. and Faloutsos, C. (2005)
Graphs over time: densification laws, shrinking diam-eters and possible explanations. In Proceedings of the eleventh ACM SIGKDD international conference on Knowl-edge discovery in data mining(ACM): 177–187.
[19] Lops, P., De Gemmis, M. and Semeraro, G. (2011) Content-based recommender systems: State of the art and trends. InRecommender systems handbook(Springer), 73–105.
[20] McNee, S.M., Kapoor, N. and Konstan, J.A. (2006) Don’t look stupid: avoiding pitfalls when recommending research papers. In Proceedings of the 2006 20th anniversary conference on Computer supported cooperative work(ACM): 171–180.
[21] Naak, A., Hage, H. and Aimeur, E. (2009) A multi-criteria collaborative filtering approach for research paper recommendation in papyres. In International Conference on E-Technologies(Springer): 25–39.
[22] Pennock, D.M., Horvitz, E., Lawrence, S. and Giles, C.L. (2000) Collaborative filtering by personality diagnosis: A hybrid memory-and model-based approach. InProceedings of the Sixteenth conference on Uncertainty in artificial intelligence(Morgan Kaufmann Publishers Inc.): 473–480.
[23] Philip, S.,Shola, P.andOvye, A.(2014) Application of content-based approach in research paper recommenda-tion system for a digital library.International Journal of Advanced Computer Science and Applications5(10). [24] Rich, E.(1979) User modeling via stereotypes.Cognitive
science3(4): 329–354.
on Emerging Technologies (ICET)(IEEE): 1–6.
[26] Schafer, J.B.,Frankowski, D.,Herlocker, J.andSen, S. (2007) Collaborative filtering recommender systems. In The adaptive web(Springer), 291–324.
[27] Small, H.(1973) Co-citation in the scientific literature: A new measure of the relationship between two documents.Journal of the American Society for information Science24(4): 265–269.
[28] Steinert, L. and Hoppe, H.U. (2016) A comparative analysis of network-based similarity measures for sci-entific paper recommendations. In Network Intelligence Conference (ENIC), 2016 Third European(IEEE): 17–24. [29] Wang, J.,Mo, H.,Wang, F.andJin, F.(2011) Exploring
the network structure and nodal centrality of china’s
air transport network: A complex network approach. Journal of Transport Geography19(4): 712–721.
[30] Xue, H.,Guo, J.,Lan, Y.andCao, L.(2014) Personalized paper recommendation in online social scholar system. In Proceedings of the 2014 IEEE/ACM International Conference on Advances in Social Networks Analysis and Mining(IEEE Press): 612–619.