R E S E A R C H
Open Access
Dynamics of glucose and insulin concentration
connected to the
β
-cell cycle: model
development and analysis
Martina Gallenberger
1*, Wolfgang zu Castell
2, Burkhard A Hense
1and Christina Kuttler
3*Correspondence: martina.gallenberger@ helmholtz-muenchen.de 1Institute of Biomathematics and Biometry, Helmholtz Zentrum München, German Research Center for Environmental Health, Neuherberg, Germany Full list of author information is available at the end of the article
Abstract
Background: Diabetes mellitus is a group of metabolic diseases with increased blood glucose concentration as the main symptom. This can be caused by a relative or a total lack of insulin which is produced by theβ-cells in the pancreatic islets of Langerhans. Recent experimental results indicate the relevance of theβ-cell cycle for the
development of diabetes mellitus.
Methods: This paper introduces a mathematical model that connects the dynamics of
glucose and insulin concentration with theβ-cell cycle. The interplay of glucose, insulin, andβ-cell cycle is described with a system of ordinary differential equations. The model and its development will be presented as well as its mathematical analysis. The latter investigates the steady states of the model and their stability.
Results: Our model shows the connection of glucose and insulin concentrations to theβ-cell cycle. In this way the important role of glucose as regulator of the cell cycle and the capability of theβ-cell mass to adapt to metabolic demands can be presented. Simulations of the model correspond to the qualitative behavior of the glucose-insulin regulatory system showed in biological experiments.
Conclusions: This work focusses on modeling the physiological situation of the glucose-insulin regulatory system with a detailed consideration of theβ-cell cycle. Furthermore, the presented model allows the simulation of pathological scenarios. Modification of different parameters results in simulation of either type 1 or type 2 diabetes.
Keywords: Glucose-insulin regulation, Cell cycle, Feedback loop, ODE model
Introduction
The term diabetes mellitus describes a group of metabolic diseases where cells, mainly muscle and fat cells, are not able to take up enough glucose from the blood. This can be due to a relative or absolute lack of insulin (cf. [1,2]). Insulin is the hormone that increases the permeability of the cell membrane for glucose molecules and regulates in this way the uptake of glucose in the cells. Therefore, a lack of insulin leads to a failure of regulation of glucose homeostasis and causes the main symptom of diabetes mellitus, a persisting increased concentration of blood sugar - in technical terms hyperglycemia.
The more common type 2 diabetes - formerly known as adult onset diabetes - is characterized by insulin resistance of the target cells. Type 1 diabetes in contrast is
an autoimmune disease where the organism destroys the insulin producingβ-cells [3]. In both scenarios glucose-insulin regulation is disturbed and the adaption ofβ-cells is insufficient to compensate for this dysfunction.
There are three main players in the glucose-insulin regulatory system:
1. Glucose is the energy source for the cells and is mainly obtained by carbohydrates in food. An elevation of blood glucose concentration is detected by theβ-cells. It causes them to release stored insulin molecules and to produce new insulin. 2. Insulin is the main regulator of glucose uptake in target cells. It increases the
permeability of the cell membrane for glucose molecules.
3. Theβ-cells are located in the islets of Langerhans in the pancreas. They store and produce insulin.
The following sections describe a mathematical model for the glucose-insulin regulatory system that connects dynamics in theβ-cell with dynamics in the blood and theβ-cell cycle. The development of the model is based on the classic insulin secretion model of Grodsky [4], who used apacket distribution hypothesis also described by Liˇcko [5] in greater detail. In these publications insulin is assumed to be stored in packets for different release thresholds of glucose and the main objective is to account for staircase stimula-tions of glucose. In our work the classic model of Grodsky is extended to variable glucose and adapted to the extension with insulin and glucose blood concentrations and theβ-cell cycle. The aim of our model is not to show biochemical or biophysical processes in detail but to present the core processes and interactions in a mechanistic way. The model also provides possibilities for extensions and consideration of additional and more detailed knowledge and questions.
The paper is organized as follows. The motivation of the model, the general setup, and the development are presented in Section “Aim and development of the model”. In Section “Mathematical model” a detailed description of the mathematical model is shown. The mathematical analysis is presented in Section “Analysis of the model” and simulations of the model in Section “Simulation”. The results are summarized and discussed in Section “Discussion”.
Aim and development of the model
Several publications [6-8] discuss the relevance of theβ-cell mass for the development of diabetes mellitus. Normally there is a slow turnover ofβ-cells (see [9]) but theβ-cell mass can adapt to metabolic demands [7,8]. The concept of dynamicβ-cell mass was under dis-cussion for some time but is now generally accepted. Nevertheless, there is a controversy on the mechanisms and the precise growth factors responsible for this adaption [6,9,10]. It was shown that elevated glucose levels enhanceβ-cell replication [11,12]. More precisely, Porat et al. [13] identify the glucose metabolism via glucokinase as the main positive reg-ulator ofβ-cell proliferation. As the model in our work does not explicitly account for the glucose metabolism, the more general approach of glucose concentration as regulator of
β-cell proliferation is used.
using ODE, PDE, DDE, and integro-differential equations (IDE) are given for example in Makroglou et al. [17] or Boutayeb and Chetouani [18]. In the last decade, several mod-els dealing with the interplay of glucose, insulin, andβ-cell mass have been developed. For example see the work of de Winter et al. [19], Topp et al. [20], De Gaetano et al. [21], or the delay-model of Li et al. [22]. Other models consider particular aspects, as, e.g., electrical activity ofβ-cells in Cha et al. [23], islet size distribution in Jo et al. [24], or glu-cose regulation in the whole-body system in Kang et al. [25]. Other models are designed to control the maintenance of normoglycemia in patients, like the compartment model in [26].
In our approach, based on the results in [6-11], instead of modelingβ-cell mass the wholeβ-cell cycle is taken into account and plays an important role in the regulatory system. The main aspect of our model is the coupling of insulin storage and of insulin and glucose blood concentrations with theβ-cell cycle. It provides the possibility to study precisely the mechanism of glucose influence on theβ-cell cycle and therefore onβ-cell mass. The model shows the dynamics of glucose and insulin with influence of glucose on theβ-cell cycle. Therefore, the dynamics in the blood are directly connected with the mechanisms in the islets of Langerhans.
The model analyzes the interplay of three different negative regulation feedback loops which live on different time scales. With elevated blood glucose concentration insulin release and provision is enhanced which leads to a decrease in glucose levels. Note that the term provision here comprises the generation of insulin, both from stored precursors which might dominate in the beginning and from synthesis of further insulin.
1. The fastest feedback loop consists in a release of stored insulin immediately after glucose stimulus via elevated blood glucose concentrations [4]. This first insulin peak reaches its maximum after about three to five minutes.
2. The second feedback loop is due to the glucose dependent enhancement of insulin provision. This has a visible effect after about 10 minutes [4].
3. The slowest feedback loop consists of the enhancement of theβ-cell cycle by glucose. If the first two reactions of the system are not sufficient to end
hyperglycemia, the blood glucose concentration remains at an elevated level. This mild hyperglycemia results in an enhancement of theβ-cell cycle leading to more β-cells which in turn can produce further insulin (see [9]).
There are different processes that increaseβ-cell mass via cell number [8,9]. Besides repli-cation of existing cells, there is also neogenesis by transdifferentiation and stem cells. As an assumption in our paper, based on publications [27-29], the adaption ofβ-cell mass is managed by replication only.
Figure 1 shows a schematic concept of the model. For simulation of the regulatory system the model is stimulated via elevated blood glucose level.
Figure 1 Schematic concept of the model.Glucose is given to the system at a constant production rate mainly by the liver. Elevated blood glucose levels lead to immediate release of stored insulin and an enhanced insulin provision. Also, glucose influences the transition rate between phasesG1andSof the cell
cycle. Insulin regulates the uptake of glucose in target cells. The molecules are stored in packets with different release thresholds. These packets can be redistributed within the storage.
slowest regulation feedback loop, i.e. glucose influencing theβ-cell cycle. The replication ofβ-cells eventually leads to the provision of more insulin.
The aim of our work is to describe the three different feedback loops in one model and to provide a basis for understanding and explanation of the mechanisms in the glucose-insulin regulatory system.
The different parts of the model will be described in detail in the following section.
Mathematical model
β-cell cycle
The mathematical model consists of three parts where the first one is theβ-cell cycle. The model accounts for three phases of the cell cycle [30]:
1. TheG1-phase is a growth phase where the cell prepares for synthesis. A basic
assumption of the model is that the functioningβ-cell mass lies in this phase [31]. 2. TheS -phase is the synthesis phase where DNA replicates.
3. TheG2/M-phase is the premitosis and mitosis phase where the nuclear division
takes place.
Biological experiments concerning the cell cycle are often done by flow cytometry. This method measures the DNA content in the different phases and can not distin-guish between phasesG2andMthat have the same DNA content. Therefore, both are
Figure 2β-cell cycle.Cell cycle of theβ-cells with three phases (G1,S,G2/M) and transition rates (p1,p2,p3).
The apoptosis rate is given with parameterp4. The termp1(1+p5G(t))describes a linear influence of
glucose on the transition ratep1with influence factorp5.
As it is shown in Figure 2 glucose modifies the transition rate fromG1- toS-phase.
Several authors claim this transition to be an important checkpoint for the regulation of theβ-cell cycle [32]. The linearity of the glucose influence,p1[ 1+p5G], is a simplifying
assumption in our work.
In the model, the transition ratesp1,p2,p3, the apoptosis ratep4, and the influence
factor of glucosep5are considered. All parameters can be found in Table 1.
An important contributing factor to theβ-cell dynamics is glucose toxicity described by Unger et al. [33]. This term refers to the wide range of harmful effects of chronic hyper-glycemia leading to chronic oxidative stress after the onset of diabetes, including damages to the pancreatic isletβ-cell (cf. [34,35]). As a consequence of hyperglycemia lipid toxicity may additionally damageβ-cells. This effect is calledglucolipotoxicityand is described in [36]. To account for the effects of glucose toxicity and glucolipotoxicity on insulin secre-tion a glucose dependent apoptosis rate can be incorporated to the cell cycle. In the actual version of the model the role of glucose toxicity is omitted for the sake of simplicity and the apoptosis rate is constant. As an assumption in theβ-cell cycle model, apoptosis and
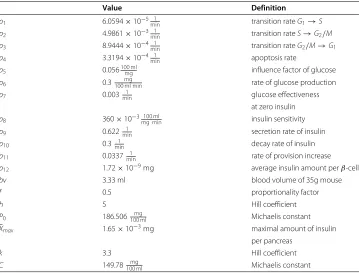
Table 1 Model parameters
Value Definition
p1 6.0594×10⁻⁵ 1min transition rateG1→S
p2 4.9861×10⁻³ 1min transition rateS→G2/M
p3 8.9444×10⁻⁴ 1min transition rateG2/M→G1
p4 3.3194×10⁻⁴ 1min apoptosis rate
p5 0.056100 mlmg influence factor of glucose
p6 0.3100 ml minmg rate of glucose production
p7 0.003min1 glucose effectiveness
at zero insulin p8 360×10−3 100 mlmg min insulin sensitivity
p9 0.622min1 secretion rate of insulin
p10 0.3min1 decay rate of insulin
p11 0.0337min1 rate of provision increase
p12 1.72×10⁻⁹mg average insulin amount perβ-cell
bv 3.33 ml blood volume of 35g mouse
f 0.5 proportionality factor
h 5 Hill coefficient
P0 186.506100 mlmg Michaelis constant
¯
Xmax 1.65×10⁻³mg maximal amount of insulin
per pancreas
k 3.3 Hill coefficient
C 149.78100 mlmg Michaelis constant
the only under some pathological conditions relevant necrosis are subsumed in the rate
p4called apoptosis rate [37].
Theβ-cell cycle is modeled as a three compartment model as it is common in cell cycle modeling (cf. [38]):
˙
G1(t)=2p3G2/M(t)−
p1
1+p5G(t)
+p4
G1(t),
˙
S(t)=p1
1+p5G(t)
G1(t)−p2S(t), (1)
˙
G2/M(t)=p2S(t)−p3G2/M(t).
The constant 2 in the first equation accounts for cell division in the transition fromG2/M
-to G1-phase. In the physiological case for adults theβ-cell cycle is very slow (see [9])
but has the capability of dynamic adaption to metabolic demands [7]. In model (1) glu-cose influences the transition ratep1 fromG1- to S-phase and is able to regulate the
β-cell cycle. This is the case if glucose triggers the system and neither the immediate release of stored insulin nor the enhanced insulin provision is able to lower blood glucose concentration. Then a high level of glucose forces the cell cycle to accelerate.
Glucose and insulin concentration in the blood
The dynamics of blood glucose concentration are based on the model of Topp et al. [20]. There, the change in blood glucose concentration is modeled as the difference between production and uptake of glucose,
˙
G(t)=production−uptake=p6−
p7+p8I(t)
G(t). (2)
The net rate of glucose production is represented by a constant production ratep6. This
rate is the difference of an intrinsic glucose production, mainly by the liver, and glucose concentration independent uptake of glucose. The latter consists mainly of glucose uptake by the brain and other nervous tissues which is assumed to be constant in our model. The uptake of glucose in other tissues consists of two processes dependent on the glucose blood concentration. One is an insulin independent uptake represented by the parame-ter of glucose effectivenessp7. The other process is an insulin dependent glucose uptake
mainly by muscle and fat cells which is influenced by insulin sensitivityp8and depends
on blood insulin concentrationI. The parameters are listed in Table 1.
Similarly, the dynamics of blood insulin concentration are modeled as secretion minus degradation,
˙
I(t)= 1
bv p9X1(t)−p10I(t), (3)
where secretion consists of the secreted amount of insulin molecules from theβ-cells,
p9X1, that has to be considered with respect to the blood volumebv of the organism.
VariableX1will be discussed in detail in the following section. Degradation of insulin is
modeled with a constant decay ratep10.
Insulin storage
In our approach the model of Grodsky is incorporated into a model of the glucose-insulin regulatory system including the adaption ofβ-cell mass to metabolic demands. Although the publication of this insulin secretion model is several years ago, the packet distribution hypothesis still finds application, for example in the work of Overgaard et al. [39]. There, it is included into a mathematical model for insulin secretion applied to IVGTT and OGTT data. Also Pedersen et al. presented an updated version of the hypothesis for oral minimal models of insulin secretion in [40] and Tsaneva-Atanasova described insulin secretion in a general context of mechanisms of cell secretion [41].
As the knowledge about β-cell biology has increased since 1972 some reinterpreta-tion of the assumpreinterpreta-tions in [4] are appropriate. In the original work there is no clear definition of what the packets are. They could be interpreted as insulin containing granules within a cell with different sensitivities for glucose induced release. Although granules clearly are present and variability of sensors for signals is a common feature in biology, there is no direct experimental proof, yet, to our knowledge. An alternative interpretation would be variability of sensitivity on cell level. In fact, Jonkers and Hen-quin [42] show a sigmoidal distribution of activeβ-cells. A combination of both aspects (and possibly more unknown factors) may be the most probable explanation for the experimentally found dose-response curves [43]. Therefore, in the following the pack-ets are interpreted as pancreatic β-cells that can be active or inactive. Several recent models for insulin secretion considering Ca2+-evoked exocytosis, the cAMP
amplify-ing pathway, and actual results on granule dynamics are available (see e.g. [44-46]) but for the qualitative conclusions in our work Grodsky’s basic model of insulin secretion is sufficient.
Our first modification of the insulin secretion model [4] is the adaption to time depen-dent glucose concentrations. In doing so, it obtains a wider field of application and gets connectable to the dynamic regulatory system. In a second step the insulin storage is incorporated with blood glucose and insulin concentrations as well as with theβ-cell cycle to form a complete model. It is assumed that insulin is stored in homogeneous packets in the storage which is shown in Figure 3. There are different release thresholdsθ(in units of glucose concentration) for the packets and the major part of them is stored at lower values of glucose concentration, between 100 and 200 mg
100 ml. These lower values are often reached
in an organism so that there is the need for sufficient insulin to react to these impulses. The initial packet distributionξ(θ, 0)for thresholdθ at timet = 0 is crucial for the storage model. In every time step the different processes within the storage try to achieve this initial distribution at least qualitatively.
The storage is filled through a glucose dependent insulin provision factorP, and insulin is released with constant secretion ratep9. Besides that, there is a redistribution process
where packets that were not needed so far are redistributed to qualitatively reestablish the initial packet distributionξ(θ, 0).
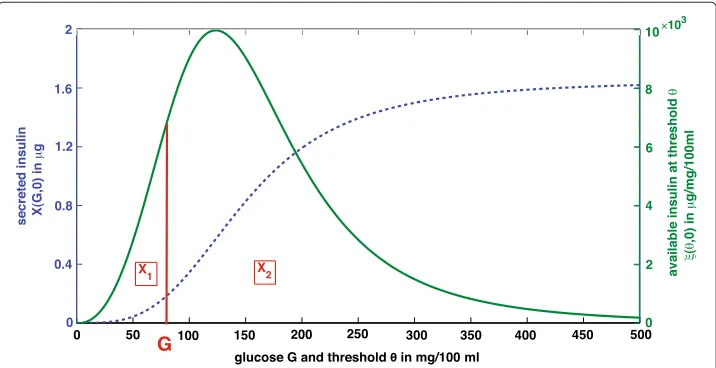
Using the packet distribution the storage can be divided into two compartments. The releasable amount of insulinX1contains the packets with threshold valueθ below the
actual blood glucose concentrationG, i.e.,
X1(t)=
G(t)
0
Figure 3 Insulin storage and packet distribution.The storage is filled through glucose dependent insulin provisionP(t) and cleared at a constant ratep9. Insulin is stored in packets at different release thresholdsθ. A
special characteristic of the storage is the redistribution process of packets shown by the vertical arrows. The figure is adapted from [4].
These packets can be released from theβ-cell for glucose concentration G. The second compartment in the storage pool is the non-releasable amount of insulinX2of the packets
with threshold valueθabove the actual blood glucose concentrationG, i.e.,
X2(t)=
∞
G(t)
ξ(θ,t)dθ.
These packets can not be released for glucose concentration G but are involved in the redistribution process.
As, in our work, the insulin storage is connected to theβ-cell cycle, changes in the insulin producingβ-cell mass influence also the initial distributionξ(θ, 0)as it is depen-dent on the maximum amount of insulin per pancreas,X¯max. The insulin producingβ-cell
mass can change in every time steptand thusX¯maxis time dependent, too. Therefore,
this distribution is called target distribution and is denoted byξ∗(θ,t). Consequences of this modification are shown later in this section.
The insulin storage is modeled as a three compartment model with X1, X2, and an
equation for the dynamics of the provision factorP. A detailed version shows the different processes within the storage according to the target distribution:
˙
X1(t)=
X1(t)
G(t)
0 ξ∗(θ,t)dθ
ξ∗(G(t),t)G(t)˙ −p9X1(t)
+ ˜f
G(t)
0
ξ∗(θ,t)dθ[X1(t)+X2(t)]− ˜f ∞
0
ξ∗(θ,t)dθX1(t)+f G(t)
0
ξ∗(θ,t)dθP(t),
˙
X2(t)= − X2(t)
∞
G(t)ξ∗(θ,t)dθ
ξ∗(G(t),t)G(t)˙ (4)
+ ˜f ∞
G(t)
ξ∗(θ,t)dθ[X1(t)+X2(t)]− ˜f ∞
0
ξ∗(θ,t)dθX2(t)+f ∞
G(t)
ξ∗(θ,t)dθP(t),
˙
P(t)=p11[P∞(t)−P(t)] .
andX˙2correspond to the time dependence of the integral limits (chain rule) which is an
expansion of the original insulin secretion model. They describe the influence of changing glucose concentration on the separation of the insulin storage into compartmentsX1and
X2(see Figure 4). This influence depends on the actual glucose concentration value and
the change in glucose concentration with timet.
System (4) shows the production and redistribution process in detail according to the target distributionξ∗(θ,t). Their contribution to the dynamics of the single compart-ments are modeled with proportionality factorsf andf˜, respectively.
To simplify the representation the integral functions are expressed in terms of general transition functions. The simplified version of the model is given in the following:
˙
X1(t)=
ξ∗(G(t),t)G˙(t)
˜
f−1u 2(t)
−u1(t)−p9
X1(t)+u2(t)X2(t)+u3(t)G1(t)P(t),
˙
X2(t)=u1(t)X1(t)−
ξ∗(G(t),t)G˙(t)
˜
f−1u 1(t)
+u2(t)
X2(t)+u4(t)G1(t)P(t), (5)
˙
P(t)=p11[P∞(t)−P(t)] .
The parameters of the model are given in Table 1. The glucose dependent transition func-tionsu1,. . .,u4describe provision and redistribution processes according to the target
distribution. They are given in greater detail in Appendix “Transition functions” section. The functionP∞ models the glucose dependent steady state of insulin provision. To express the delay in the effect of insulin provision,P∞is modeled as a Hill function
P∞(t)= G(t) h
Ph0+G(t)h ,
withhbeing the Hill coefficient andP0the Michaelis constant.
Figure 4 Initial distribution in the storage and compartmentsX1andX2.Secreted insulinX(G, 0) (dashed line) is the whole amount of insulin releasable by the pancreas at glucose concentrationG. It is the integral over the initial packet distributionξ(θ, 0)(solid line).X1is the releasable andX2the non-releasable
amount of insulin. In the plot they can be identified as areas under the solid curveξ(θ, 0)ranging from
An example for a possible initial distribution in case of constant glucose is given in [4]. For constant glucose concentrationGexperimental results [47,48] show the following course of insulin releaseX(G,0) in the early phase (dashed line in Figure 4). This evolution is described with a sigmoid function
X(G, 0)= ¯Xmax
Gk
Ck+Gk ,
whereX¯maxis the maximum amount of insulin per pancreas,kthe Hill coefficient, and
Cthe Michaelis constant. WithX(G,0) being the amount of released insulin at constant glucose concentrationG, the initial distributionξ(θ, 0) is expressed as the derivative of
X(G, 0). To be precise,
X(G, 0)= ¯Xmax
Gk
Ck+Gk =
G
0
ξ(θ, 0)dθ (6)
⇒ ξ(θ, 0)= d
dθX(θ, 0)= ¯Xmax
kCkθk−1
(Ck+θk)2 . (7)
These expressions change in the case of time dependent glucose and in connection with theβ-cell cycle that results in variableβ-cell mass. First, the maximum amount of insulin per pancreasX¯maxis not constant anymore but depends on theβ-cell massG1at timet,
Xmax(t)=p12G1(t). (8)
The parameterp12is interpreted as the amount of insulin perβ-cell. One of several
pos-sibilities to determine this parameter is the quotient of the maximum amount of insulin per pancreas and the initial amount ofβ-cells, i.e.,
p12=
¯
Xmax
G1(0)
,
whereG1(0)serves as a normalization. Then equation (8) determines for every amount
ofβ-cellsG1at timet > 0 the corresponding maximum amount of insulin. Therefore,
expressions (7) and (6) now read as
X∗(G(t),t)=Xmax(t)
G(t)k
Ck+G(t)k = G(t)
0
ξ∗(θ,t)dθ
⇒ ξ∗(θ,t)= d
dθX
∗(θ,t)=X
max(t)
kCkθk−1 (Ck+θk)2 ,
Complete model
In the previous subsections the partial models have been developed and explained in detail. Based on this outline the complete model can now be formulated:
˙
G1(t)=2p3G2/M(t)−
p1
1+p5G(t)
+p4
G1(t),
˙
S(t)=p11+p5G(t)G1(t)−p2S(t),
˙
G2/M(t)=p2S(t)−p3G2/M(t),
˙
G(t)=p6−
p7+p8I(t)
G(t), (9)
˙
I(t)= 1
bvp9X1(t)−p10I(t),
˙
X1(t)=
ξ∗(G(t),t)G˙(t)
˜
f−1u 2(t)
−u1(t)−p9
X1(t)+u2(t)X2(t)+u3(t)G1(t)P(t),
˙
X2(t)=u1(t)X1(t)−
ξ∗(G(t),t)G˙(t)
˜
f−1u 2(t)
+u2(t)
X2(t)+u4(t)G1(t)P(t),
˙
P(t)=p11[P∞(t)−P(t)] .
The first three equations describe the dynamics of theβ-cell cycle with its three phases. The fourth and the fifth equation show the dynamics of blood glucose and insulin con-centration, and the last three equations present the insulin secretion model. The partial models are connected through several entities.
1. InsulinI influences the glucose dynamics via insulin dependent uptake in target cells. Secretion of insulin consists of the releasable amount of insulin molecules
p9X1in relation to the blood volumebv.
2. GlucoseG plays an important role in regulating the processes within the insulin secretion model. It regulates the provision of insulin and defines the compartments of the insulin storage via the target distribution. It also contributes to the
redistribution process. Furthermore, glucose regulates theβ-cell cycle via the glucose dependent transition rate fromG1- toS -phase.
3. Theβ-cell massG1determines the capacity of insulin provision.
In Section “Simulation” the behavior of solutions of the complete model can be seen. There, the model is simulated in the physiological case as well as in an experimental situation.
Analysis of the model
In this section a basic mathematical analysis is presented to achieve a better understand-ing of the model behavior. First, positivity of the solution is shown. Then the analysis focusses on steady states and their stability to explain the asymptotic development of the solution.
Positivity of solutions
Corollary 1.([49]): For everyt0> 0 and initial valuex0 =(x01,. . .,x0m) ∈Rm+ = {x∈ Rm:x
i>0,i=1, ...,m}, each componentxi, i=1,. . .,m, of the solutions to
˙
xi(t)=fi(t,x1,. . .,xm), xi(t0)=x0i
is positive if and only if
fi(t,x1,. . .xi−1, 0,xi+1,. . .,xm) >0, (10)
i=1,. . ., m, for allt>0 andx∈Rm+.
Using the condition from Corollary 1, positivity of the solution of system (9) can be ana-lyzed. The parameters of the model and the initial values are non-negative (see Tables 1 and 2, respectively). Therefore, it can be shown that condition (10) holds for all positive values of the variables. Summarizing, positivity of the solution of the presented model for the glucose-insulin regulatory system is guaranteed.
Steady states
As it can be seen in Section ‘Simulation’, the graph of the solution suggests a steady state behavior of the system. The investigation of the steady states is based on theβ-cell cycle model (1).
We determined the only two steady states for theβ-cell cycle. There is a trivial steady state where no cells are present,
G∗1=S∗=G2/M∗=0, (11)
and there is another steady state where the number of apoptotic cells equals the number of new cells. This occurs if the apoptosis rate equals the transition rate fromG1- toS-phase:
p4=p1(1+p5G) ⇔ G=
p4−p1
p1p5
. (12)
Equation (12) results in a fixed value for glucose,G, that can be modified via the influence factorp5.G is a crucial threshold for the development of the cell cycle as it determines
the values of glucose concentration leading toβ-cell mass increase or decrease.
The apoptosis ratep4is greater than the transition rate fromG1- toS-phase if the actual
value of glucose concentrationGtis lower thanG:
p4>p1(1+p5Gt) ⇔ G>Gt. (13)
In this case there are moreβ-cells dying than dividing per time step and in consequence the total amount ofβ-cells inG1-phase is decreasing.
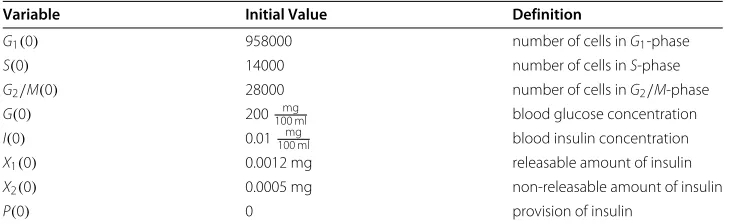
Table 2 Initial values
Variable Initial Value Definition
G1(0) 958000 number of cells inG1-phase
S(0) 14000 number of cells inS-phase
G2/M(0) 28000 number of cells inG2/M-phase
G(0) 200100 mlmg blood glucose concentration I(0) 0.01100 mlmg blood insulin concentration
X1(0) 0.0012 mg releasable amount of insulin
X2(0) 0.0005 mg non-releasable amount of insulin
P(0) 0 provision of insulin
In contrast, the apoptosis ratep4is lower than the transition rate fromG1- toS-phase
if the actual value of glucose concentrationGtis greater thanG:
p4<p1(1+p5Gt) ⇔ G<Gt. (14)
Fewerβ-cells are dying than dividing per time step and in consequence theβ-cell mass in
G1-phase is increasing.
In summary, the further analysis of the steady state behavior results in only two fixed points for positive values of the variables. The two steady states (11) and (12) of the cell cycle model determine the two steady states of the whole model. The first one is the trivial steady state
F1∗= 0, 0, 0,p6
p7
, 0, 0, 0,P∞ p6
p7
(15)
with all cell numbers in the three phases equal to zero. As it can be seen inF1∗, glucose concentration is never equal to zero due to constant production of glucose by the liver. Thus, the steady state of the provision factor,P∞, is also not equal to zero but a fixed value depending onG∗= p6
p7.
The second steady state is driven by the threshold valueG determining a non-trivial steady state
F2∗=G∗1,S∗,G2/M∗,G∗,I∗,X∗1,X2∗,P∗
. (16)
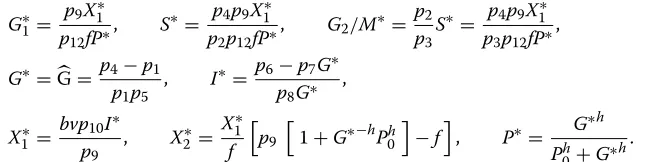
The values for the different variables can be given explicitly:
G1∗= p9X
∗
1
p12fP∗
, S∗= p4p9X
∗
1
p2p12fP∗
, G2/M∗=
p2
p3
S∗= p4p9X
∗
1
p3p12fP∗
,
G∗=G= p4−p1
p1p5
, I∗= p6−p7G
∗
p8G∗
,
X1∗= bvp10I
∗
p9
, X2∗= X
∗ 1 f p9
1+G∗−hP0h
−f
, P∗= G
∗h
Ph0+G∗h.
The steady stateF2∗ is reached after a glucose stimulus to the regulatory system. The variables tend to these values if no further impulse or modification to the system is following.
Stability
The stability of the two steady statesF1∗andF2∗ can be investigated by computing the Jacobian matrix of these fixed points. This analysis is based on the system parameters in Table 1.
In summary, it can be shown that there are two types of steady states for the system.
1. The trivial steady state with cell numbers equal to zero,
F1∗= 0, 0, 0,p6
p7
, 0, 0, 0,P∞ p6
p7
,
is an unstable fixed point. 2. The non-trivial steady state,
F2∗=G∗1,S∗,G2/M∗,G∗,I∗,X∗1,X2∗,P∗
,
The behavior of the model according to the mathematical analysis will be illustrated in the following section using simulations of the complete model.
Simulation
In this section two simulations of the complete model (9) are presented. The first simula-tion describes the behavior of the glucose-insulin regulatory system in the physiological case. The second simulation particularly shows the adaption ofβ-cell mass under long term glucose infusion [12].
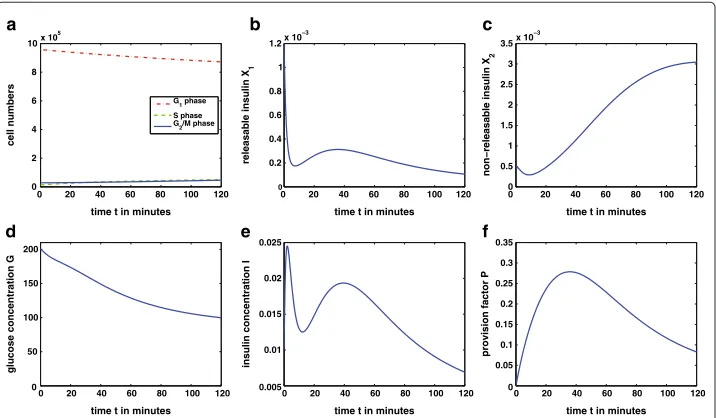
The physiological case - given in Figure 5 - has been simulated over 120 minutes with a high initial glucose value resulting for example from recent food intake. Parameters and initial values of the variables are given in Tables 1 and 2, respectively. The following description discusses the subplots.
• Figure 5a:With the given parameters the threshold value for the cell cycle is
G=80100mgml. Glucose concentrationG is above this level for 120 minutes. Therefore, the cell cycle reacts in the following way: Glucose values above the threshold increase the transition rate fromG1- toS -phase. As theβ-cell cycle is a
slow process, in the first 120 minutes an only slight increase inS - andG2/M-phase is
detectable while the cell number inG1-phase is decreasing. Increase inβ-cell mass,
i.e.,G1, takes more than 120 minutes. As glucose concentration is almost at the
steady stateG=80100mgmltowards the end of the simulation, the system will regulate itself without significant adaption ofβ-cell mass. This is expected in the physiological case without abnormal exposure to glucose.
• Figure 5b:The releasable amount of insulinX1shows a biphasic behavior. There is a
first peak release of stored insulin molecules and a second phase in consequence of provision of further insulin.
0 20 40 60 80 100 120
0 2 4 6 8 10x 10
5
time t in minutes
cell numbers
G 1 phase S phase G
2/M phase
0 20 40 60 80 100 120
0 0.2 0.4 0.6 0.8 1 1.2x 10
−3
time t in minutes
releasable insulin X
1
0 20 40 60 80 100 120
0 0.5 1 1.5 2 2.5 3 3.5x 10
−3
time t in minutes
non−releasable insulin X
2
0 20 40 60 80 100 120
0 50 100 150 200
time t in minutes
glucose concentration G
0 20 40 60 80 100 120
0.005 0.01 0.015 0.02 0.025
time t in minutes
insulin concentration I
0 20 40 60 80 100 120
0 0.05 0.1 0.15 0.2 0.25 0.3 0.35
time t in minutes
provision factor P
b
a c
d e f
• Figure 5c:With decreasing glucose concentration there are more packets with threshold value above the actual glucose level. For this reason and due to enhanced insulin provisionP the amount of non-releasable insulinX2increases.
• Figure 5d:Glucose concentrationG is decreasing from the high initial value as there is an increased concentration of insulinI in the blood.
• Figure 5e:Blood insulin concentrationI follows with some delay the releasable amount of insulin. It also shows the characteristic biphasic behavior of insulin release.
• Figure 5f:Provision factorP shows an increase in presence of high glucose values and decreases as blood glucose decreases.
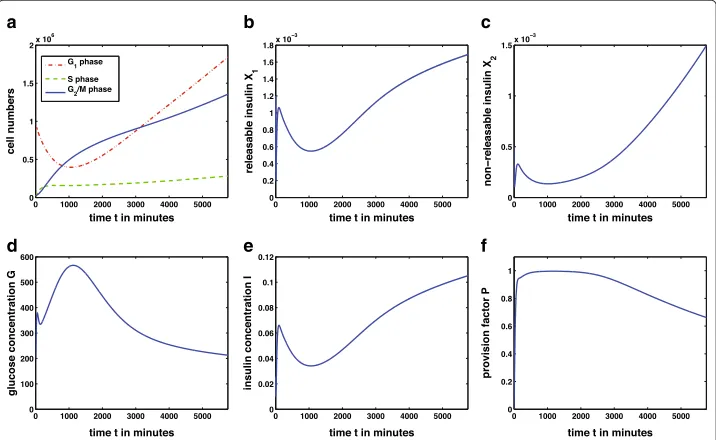
The second simulation is done according to the experiments of Bonner-Weir et al. [12]. There, rats are given a high glucose infusion for 96 hours. After this time a significant increase inβ-cell mass is observable. The design of the experiment is assigned to the mathematical model (9) in the following way: the glucose production rate was increased fromp6 = 0.3100 ml minmg up top˜6 = 8.6806100 ml minmg to account for a high concentrated
glucose infusion. The resulting plots of the solution of model (9) are shown in Figure 6. Most important, a significant increase ofβ-cellsG1can be seen in Figure 6a. This results
from the persisting and severe hyperglycemia (Figure 6d) due to the high glucose produc-tionp˜6. With longer time of simulation the system will reach the stable steady stateF2∗.
The transfer of the experimental design in [12] to our model shows qualitatively that the glucose-insulin regulatory system is able to achieve euglycemia through adaption ofβ-cell mass as it is stated in several publications (e.g. [6-8,13]). Note that the model currently assigns increase ofβ-cell biomass exclusively to cell number (hyperplasia). It disregards an increase in cell size (hypertrophy) which occurs in [12]. This simplification which can
b
a c
e
d f
Figure 6 Solution of the complete model over 96 hours.The simulation presents an experimental situation with high glucose infusion over 96h. The parameterp6of glucose production was increased up to ˜
p6=8.6806100 ml minmg . Theβ-cell mass increases due to the persisting hyperglycemia. With the adaption of
be overcome in further development of the model leads to an overestimation of changes in cell division rate as reflected in Figure 6a. Probably especially the first responses to elevated glucose concentrations are concerned.
Discussion
This work presents a mathematical model that describes three different negative regula-tion feedback loops of the glucose-insulin regulatory system:
1. Immediate release of stored insulin molecules. 2. Enhancement of provision of new insulin.
3. Adaption of theβ-cell cycle to metabolic demands.
This is possible by incorporating an insulin secretion model describing storage and release of insulin molecules on the one hand and insulin provision on the other hand [4]. Furthermore, insulin provision is glucose dependent which allows its adaption to spe-cific demands of the organism at every time step. The third feedback loop is modeled via incorporation of theβ-cell cycle with glucose regulating the replication rate of the cells [11,13].
Several models of the glucose-insulin regulatory system, as e.g., [19-21], describe glu-cose, insulin and β-cell mass dynamics, whereas our model shows the connection of glucose, and insulin concentrations with theβ-cell cycle as the main aspect. In this way the important role of glucose as regulator of the cell cycle [13] and the capability of theβ -cell mass to adapt to metabolic demands can be analyzed in detail. Hereby, the adaption ofβ-cell mass is assigned exclusively to hyperplasia and disregards hypertrophy.
The model conserves typical characteristics of the glucose-insulin regulatory system. The plots of the complete model in Figure 5 show biphasic insulin release represented through the biphasic shape of the releasable amount of insulin X1. This is a typical
behavior of insulin release reported in several biological publications (e.g. [47,50]). Modeling insulin secretion based on [4] incorporates three feedback loops consisting of stored insulin, provision of further insulin, and variableβ-cell mass. Our model expands classic insulin secretion models (e.g. [4,44-46]) by a connection to theβ-cell cycle.
The qualitative behavior of the model is illustrated with simulations. In the physiolog-ical case, shown in Figure 5, theβ-cell mass is sufficient to produce and release enough insulin to decrease glucose concentration and maintain euglycemia. With a second sim-ulation the adaption of the β-cell mass to increasing metabolic demands is presented. This situation occurs in long term studies with persisting hyperglycemia as it can be seen in Figure 6. In a simulation similar to the experiment in [12] increase ofβ-cell mass via hyperplasia in 96 hours of hyperglycemia is shown.
holding of the glucose concentration below the threshold valueGˆ by external insulin infu-sion, for example. While a reduction of the replication rate due to hypoglycemia is shown in [11] a complete disappearance of theβ-cell mass is an implausible result. The death of the organism would happen prior to the extinction of theβ-cells.
Our system allows for simulation of the glucose-insulin regulatory system assuming
in vivo situations. Our model builds a theoretical basis for description and
explana-tion of dynamics derived from biological experiments. It supports the understanding of metabolic processes. Biological assumptions can be verified and quantification of data and parameters can be achieved. Additionally, the model promotes understanding of the interplay of the three different regulation feedback loops. The model is able to describe metabolic dynamics of the glucose-insulin regulatory system also for the pathological case of type 1 or type 2 diabetes.
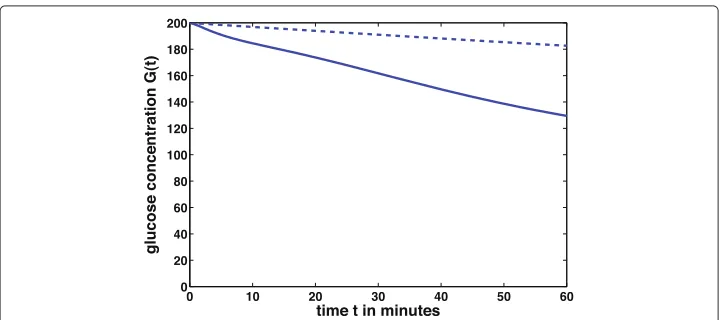
To illustrate one possible modification of the system a type 2 diabetes-like simulation is done. Type 2 diabetes is characterized by insulin resistance of target cells, mainly muscle and fat cells. In consequence, these cells are not able to take up enough glucose from the blood. In this case the insulin sensitivity of the body cells is down-regulated. To simulate this situation the model parameter for insulin sensitivityp8is decreased arbitrary from
the valuep8=360×10−3top˜8=360×10−5while the other parameters given in Table 1
stay the same. This modification corresponds to a lower reaction of the target cells to insulin and therefore a decreased uptake of glucose from the blood.
Figure 7 shows that the blood glucose concentrationGin the pathological case of insulin resistance (dashed line) decreases slower than in the physiological case (solid line). The body cells take up less glucose from the blood and therefore the hyperglycemia lasts longer in the pathological case.
There are also possibilities to simulate the regulatory system in a type 1 diabetes sce-nario. It can be done for example by increasing the apoptosis rate p4 in the cell cycle
model. This results in dyingβ-cells which is characteristic for this autoimmune disease. For a more detailed discussion aboutβ-cell mass in a type 1 diabetes scenario see Klinke [51]. There,β-cell mass at onset of type 1 diabetes is concerned depending on body weight and the patient’s age.
Figure 7 Insulin resistance of target cells.Blood glucose concentration at different values of insulin sensitivityp8. Physiological valuep8=360×10−3(solid line) and pathological valuep˜8=360×10−5
In summary, our model is a basic approach to understand the processes within the glucose-insulin regulatory system connected to theβ-cell cycle. It offers a wide range of possible modifications to incorporate further processes and can be adapted to many biological questions.
Appendix
Derivation of glucose dependent insulin storage dynamics
With time dependent glucose the major difference to the original model of Grodsky consists in time dependence of upper and lower integral bounds forX1andX2:
˙
X1(t)=
d dt
G(t)
0
ξ(θ,t)dθ
,
˙
X2(t)=
d dt
∞
G(t)
ξ(θ,t)dθ
.
To determine these integrals, the differential equation forξ(θ,t), given in [4], - has to be solved first. Then this solution can be applied to the expressions forX1andX2. In a final
step we differentiate these terms with respect to timetto achieve differential equations ˙
X1andX˙2.
Solution of the differential equationξ (θ˙ ,t)
As only the packets with threshold θ below glucose concentrationG are relevant for insulin secretion, two cases have to be distinguished. There is a differential equation for
θ ≤G(t),
˙
ξ (θ,t)= −p9ξ(θ,t)+fξ0(θ )P(t)− ˜fX¯maxξ(θ,t)+ ˜fξ0(θ )X∞(t), (17) and forθ >G(t),
˙
ξ (θ,t)=fξ0(θ )P(t)− ˜fX¯maxξ(θ,t)+ ˜fξ0(θ )X∞(t), (18)
with
ξ0(θ )=ξ(θ, 0), X∞(t)=
∞
0
ξ(θ ,t)dθ =X1(t)+X2(t)andX¯max=
∞
0
ξ0(θ)dθ .
The only difference between the two equations is the term for insulin secretion, −p9ξ(θ,t), that occurs in the first but not in the second equation. Therefore, we restrict
the following exploration to the caseθ ≤G(t).
The system that has to be solved is a linear non-homogeneous ordinary differential equation for which there are standard solution methods likevariation of constants. Using this method, the set of solutions for differential equation (17) is given as
ξ(θ,t)=
e−(p9+˜fX¯max)t
t
0
e(p9+˜fX¯max)τ
fP(τ )+ ˜f X∞(τ )
ξ0(θ )dτ+C C∈R
and for the differential equation (18) as
ξ(θ,t)=
e−˜fX¯maxt
t
0
ef˜X¯maxτ
fP(τ )+ ˜f X∞(τ )
ξ0(θ )dτ+C C∈R
.
Derivation of the differential equationsX˙1(t)andX˙2(t)
To derive a differential equation for the total amount of releasable insulin at glucose concentrationGthe expression
X1(t)=
G(t)
0
ξ(θ,t)dθ
has to be differentiated with respect to time t. Attaching the solution of ξ (θ˙ ,t) to X1
results in the following expression:
X1(t)=e−(p9+˜fX¯max)t
G(t)
0
ξ0(θ )dθ
t
0
e(p9+˜fX¯max)τ
fP(τ )+ ˜f X∞(τ )
dτ +1
.
The differentiation of this equation with respect to timetthen results in
d
dtX1(t)= ˙X1(t)=
X1(t)
G(t)
0 ξ∗(θ,t)dθ
ξ∗(G(t),t)G˙(t)−p9X1(t)
+ ˜f
G(t)
0
ξ∗(θ,t)dθ[X1(t)+X2(t)]−˜f
∞
0
ξ∗(θ,t)dθX1(t)
+f
G(t)
0
ξ∗(θ,t)dθP(t),
with target distributionξ∗(θ,t).
Analogously, we derive the differential equation for the total amount of non-releasable insulin at glucose concentrationG
X2(t)=
∞
G(t)
ξ(θ,t)dθ.
The differential equation is given as
d
dtX2(t)= ˙X2(t)=
−X2(t)
∞
G(t)ξ∗(θ,t)dθ
ξ∗(G(t),t)G˙(t)
+ ˜f
∞
G(t)
ξ∗(θ,t)dθ[X1(t)+X2(t)]−˜f
∞
0
ξ∗(θ,t)dθX2(t)
+f
∞
G(t)
ξ∗(θ,t)dθP(t),
with target distributionξ∗(θ,t).
Transition functions
The transition functionsu1,. . .,u4of the compartment model for insulin secretion are
complex expressions with integrals over the target distribution in the insulin storage. With the concrete packet distribution given in [4] the integrals can be determined explicitly in terms of Hill functions:
G(t)
0
ξ∗(θ,t)dθ = Xmax(t)G(t) k
Ck+G(t)k = ¯Xmax
G1(t)
G1(0)
G(t)k
Ck+G(t)k,
and ∞
G(t)
ξ∗(θ,t)dθ = Xmax(t)C k
Ck+G(t)k = ¯Xmax
G1(t)
G1(0)
Ck Ck+G(t)k.
cycle that influences the maximum amount of insulin per pancreas. Therefore,f˜is chosen glucose dependent and with a condition to ensure that
X1(t)+X2(t)≤Xmax(t). (19)
The functionf˜has the form
˜
f(t)= − p9f C
kG(t)h−k
¯
XmaxGG11((0t))
fG(t)h(1+CkG(t)−k)−p
9(Ph0+G(t)h)
.
This expression was found by analyzing condition (19) in steady state situation. With these preliminaries the transition functionsuican be given explicitly:
u1(t)= −
p9f G(t)h−kC2k
fG(t)h(1+CkG(t)−k)−p9(Ph
0+G(t)h) Ck+G(t)k
,
u2(t)= −
p9f G(t)hCk
fG(t)h(1+CkG(t)−k)−p
9(Ph0+G(t)h) Ck+G(t)k
,
u3(t)=fX¯max
1
G1(0)
G(t)k
Ck+G(t)k,
u4(t)=fX¯max
1
G1(0)
Ck Ck+G(t)k.
These expressions were used for the simulations in Figures 5 and 6.
Competing interests
The authors declare that they have no competing interests.
Authors’ contributions
MG carried out the modeling, the mathematical analysis and wrote the manuscript. WzC contributed to the modeling process and supported the mathematical analysis. BAH supported the biological understanding of the problem and participated in the modeling process. CK supported the modeling process and the mathematical analysis of the model. All authors read and approved the final manuscript.
Acknowledgements
The authors thank Marcus Ansorg for many fruitful discussions and his help during the modeling process.
Author details
1Institute of Biomathematics and Biometry, Helmholtz Zentrum München, German Research Center for Environmental Health, Neuherberg, Germany.2Scientific Computing Research Unit, Helmholtz Zentrum München, German Research Center for Environmental Health, Neuherberg, Germany.3Department of Mathematics, Technical University Munich, Garching, Germany.
Received: 25 July 2012 Accepted: 18 October 2012 Published: 19 November 2012
References
1. Saltiel AR, Kahn CR:Insulin signalling and the regulation of glucose and lipid metabolism.Nature2001,
414:799–806.
2. Khan AH, Pessin JE:Insulin regulation of glucose uptake: a complex interplay of intracellular signalling pathways.Diabetologia2002,45:1475–1483.
3. Klöppel G, Löhr M, Habich K, Oberholzer M, Heitz PU:Islet pathology and the pathogenesis of type 1 and type 2 diabetes mellitus revisited.Surv Synth Pathol Res1985,4:110–125.
4. Grodsky GM:A threshold distribution hypothesis for packet storage of insulin and its mathematical modeling.J Clin Invest1972,51:2047–2059.
5. Liˇcko V:Threshold secretory mechanism: a model of derivative element in biological control.Bull Math Biol 1973,35:51–58.
6. Sachdeva MM, Stoffers DA:Minireview: meeting the demand for insulin: molecular mechanisms of adaptive postnatalβ-cell mass expansion.Mol Endocrinol2009,23:747–758.
7. Teta M, Long SY, Wartschow LM, Rankin MM, Kushner JA:Very slow turnover ofβ-cells in adult mice.Diabetes 2005,54:2557–2567.
9. Bouwens L, Rooman I:Regulation of pancreatic beta-cell mass.Physiol Rev2005,85:1255–1270. 10. Heit JJ, Karnik SK, Kim SK:Intrinsic regulators of pancreaticβ-cell proliferation.Annu Rev Cell Dev Biol2006,
22:311–338.
11. Pechhold K, Koczwara K, Zhu X, Harrison VS, Walker G, Lee J, Harlan DM:Blood glucose levels regulate pancreatic
β-cell proliferation during experimentally-induced and spontaneous autoimmune diabetes in mice.PloS ONE2009,4:e4827.
12. Bonner-Weir S, Deery D, Leahy JL, Weir GC:Compensatory growth of pancreaticβ-cells in adult rats after short-term glucose infusion.Diabetes1989,38:49–53.
13. Porat S, Weinberg-Corem N, Tornovsky-Babaey S, Schyr-Ben-Haroush R, Hijy A, Stolovich-Rain M, Dadon D, Granot Z, Ben-Hur V, White P, Girard CA, Karni R, Kaestner KH, Ashcroft FM, Magnuson MA, Saada A, Grimsby J, Glaser B, Dor Y:
Control of pancreaticβ-cell regeneration by glucose metabolism.Cell Metab2011,13:440–449. 14. Bolie VW:Coefficients of normal blood glucose regulation.J Appl Physiol1961,16:783–788.
15. Bergman RN, Ider YZ, Bowden CR, Cobelli C:Quantitative estimation of insulin sensitivity.Am J Physiol1979,
23:E667–E677.
16. Toffolo G, Bergman RN, Finegood DT, Bowden CR, Cobelli C:Quantitative estimation of beta cell sensitivity to glucose in the intact organism: a minimal model of insulin kinetics in the dog.Diabetes1980,29:979–990. 17. Makroglou A, Li J, Kuang Y:Mathematical models and software tools for the glucose-insulin regulatory
system and diabetes: an overview.Appl Numer Math2006,56:559–573.
18. Boutayeb A, Chetouani A:A critical review of mathematical models and data used in diabetology.Biomed Eng Online2006,5:43.
19. de Winter, W, DeJongh J, Post T, Ploeger B, Urquhart R, Moules I, Eckland D, Danhof M:A mechanism-based disease progression model for comparison of long-term effects of pioglitazone, metformin and gliclazide on disease processes underlying type 2 diabetes mellitus.J Pharmacokinet Pharmacodyn2006,33:313–343. 20. Topp B, Promislow K, De Vries G, Miura RM, Finegood DT:A model ofβ-cell mass, insulin, and glucose kinetics:
pathways to diabetes.J Theor Biol2000,206(4):605–619.
21. De Gaetano A, Hardy T, Beck B, Abu-Raddad E, Palumbo P, Bue-Valleskey J, Pørksen N:Mathematical models of diabetes progression.Am J Physiol Endocrinol Metab2008,295:E1462–E1479.
22. Li J, Kuang Y, Mason CC:Modeling the glucose-insulin regulatory system and ultradian insulin secretory oscillations with two explicit time delays.J Theor Biol2006,242:722–735.
23. Cha CY, Powell T, Noma A:Analyzing electrical activities of pancreaticβcells using mathematical models.
Prog Biophys Mol Biol2011,107:265–273.
24. Jo J, Hara M, Ahlgren U, Sorenson R, Periwal V:Mathematical models of pancreatic islet size distributions.
Islets2012,4:10–19.
25. Kang H, Han K, Choi M:Mathematical model for glucose regulation in the whole-body system.Islets2012,
4:84–93.
26. Schaller HC, Schaupp L, Bodenlenz M, Wilinska ME, Chassin LJ, Wach P, Vering T, Hovorka R, Pieber TR:On-line adaptive algorithm with glucose prediction capacity for subcutaneous closed loop control of glucose: evaluation under fasting conditions in patients with type 1 diabetes.Diabetic Med2006,
23:90–93.
27. Dor Y, Brown J, Martinez OI, Melton DA:Adult pancreaticβ-cells are formed by self-duplication rather than stem-cell differentiation.Nature2004,429:41–46.
28. Georgia S, Bhushan A:βcell replication is the primary mechanism for maintaining postnatalβ-cell mass.
J Clin Invest2004,114:963–968.
29. Teta M, Rankin MM, Long SY, Stein GM, Kushner JA:Growth and regeneration of adultβcells does not involve specialized progenitors.Dev Cell2007,12:817–826.
30. Alberts B, Johnson A, Lewis J, Raff M, Roberts K, Walter P:Molecular Biology of the Cell. Garland Science. 5th edition. New York, Abingdon: Taylor & Francis; 2008.
31. Meng ZX, Nie J, Ling JJ, Sun JX, Zhu YX, Gao L, Lv JH, Zhu DY, Sun YJ, Han X:Activation of liver X receptors inhibits pancreatic islet beta cell proliferation through cell cycle arrest.Diabetologia2009,52:125–135.
32. Cozar-Castellano I, Harb G, Selk K, Takane K, Vasavada R, Sicari B, Law B, Zhang P, Scott DK, Fiaschi-Taesch N, Stewart AF:Lessons from the first comprehensive molecular characterization of cell cycle control in rodent insulinoma cell lines.Diabetes2008,57:3056–3068.
33. Unger RH, Grundy S:Hyperglycaemia as an inducer as well as a consequence of impaired islet cell function and insulin resistance: implications for the management of diabetes.Diabetologia1985,28:119–121. 34. Yki-Järvinen H:Glucose toxicity.Endocr Rev1992,13:415–431.
35. Robertson RP, Harmon JS:Diabetes, glucose toxicity, and oxidative stress: a case of double jeopardy for the pancreatic islet beta cell.Free Radic Biol Med2006,41:177–184.
36. Poitout V, Robertson RP:Glucolipotoxicity: fuel excess andβ-cell dysfunction.Endocr Rev2008,29:351–366. 37. Cnop M, Welsh N, Jonas JC, Jörns A, Lenzen S, Eizirik DL:Mechanisms of pancreaticβ-cell death in type 1 and
type 2 diabetes: many differences, few similarities.Diabetes2005,54:S97–S107.
38. Daukste L, Basse B, Baguley BC, Wall DJN:Using a stem cell and progeny model to illustrate the relationship between cell cycle times of in vivo human tumour cell tissue populations, in vitro primary cultures and the cell lines derived from them.J Theor Biol2009,260(4):563–571.
39. Overgaard RV, Jelic K, Karlsson M, Henriksen JE, Madsen H:Mathematical beta cell model for insulin secretion following IVGTT and OGTT.Ann Biomed Eng2006,34:1343–1354.
40. Pedersen MG, Toffolo GM, Cobelli C:Cellular modeling: insight into oral minimal models of insulin secretion.
Am J Physiol Endocrinol Metab2010,298:E597–E601.
41. Tsaneva-Atanasova K, Osinga HM, Tabak J, Pedersen MG:Modeling mechanisms of cell secetion.Acta Biotheor 2010,58:315–327.
43. Henquin JC:Regulation of insulin secretion: a matter of phase control and amplitude modulation.
Diabetologia2009,52:739–751.
44. Fridlyand LE, Philipson LH:Coupling of metabolic, second messenger pathways and insulin granule dynamics in pancreatic beta-cells: A computational analysis.Prog Biophys Mol Biol2011,107:293–303.
45. Pedersen MG, Corradin A, Toffolo GM, Cobelli C:A subcellular model of glucose-stimulated pancreatic insulin secretion.Phil Trans R Soc A2008,366:3525–2543.
46. Bertuzzi A, Salinari S, Mingrone G:Insulin granule trafficking in beta-cells: mathematical model of glucose-induced insulin secretion.Am J Physiol Endocrinol Metab2007,293:E396–E409.
47. Curry DL, Bennett LL, Grodsky GM:Dynamics of insulin secretion by the perfused rat pancreas.Endocrinology 1968,83:572–584.
48. Grodsky GM, Curry D, Landahl H, Bennett L:Furtherstudies on the dynamic aspects of insulin release in vitro with evidence for a two-compartmental storage system.Acta Diabetol Lat1969,6:554–579.
49. Pavel NH:Differential Equations, Flow Invariance and Applications. Boston: Pitman Pub.; 1984.
50. Nesher R, Cerasi E:Modeling phasic insulin release - immediate and time-dependent effects of glucose.
Diabetes2002,51:53–59.
51. Klinke DJ:Extent of beta cell destruction is important but insufficient to predict the onset of type 1 diabetes mellitus.PLoS ONE2008,3:e1374.
doi:10.1186/1742-4682-9-46
Cite this article as:Gallenbergeret al.:Dynamics of glucose and insulin concentration connected to theβ-cell cycle:
model development and analysis.Theoretical Biology and Medical Modelling20129:46.
Submit your next manuscript to BioMed Central and take full advantage of:
• Convenient online submission
• Thorough peer review
• No space constraints or color figure charges
• Immediate publication on acceptance
• Inclusion in PubMed, CAS, Scopus and Google Scholar
• Research which is freely available for redistribution