R E V I E W
Open Access
Clinical proteomic biomarkers: relevant issues on
study design & technical considerations in
biomarker development
Maria Frantzi
1,2*, Akshay Bhat
1,3and Agnieszka Latosinska
2,3Abstract
Biomarker research is continuously expanding in the field of clinical proteomics. A combination of different proteomic–based methodologies can be applied depending on the specific clinical context of use. Moreover, current advancements in proteomic analytical platforms are leading to an expansion of biomarker candidates that can be identified. Specifically, mass spectrometric techniques could provide highly valuable tools for biomarker research. Ideally, these advances could provide with biomarkers that are clinically applicable for disease diagnosis and/ or prognosis. Unfortunately, in general the biomarker candidates fail to be implemented in clinical decision making. To improve on this current situation, a well-defined study design has to be established driven by a clear clinical need, while several checkpoints between the different phases of discovery, verification and validation have to be passed in order to increase the probability of establishing valid biomarkers. In this review, we summarize the technical proteomic platforms that are available along the different stages in the biomarker discovery pipeline, exemplified by clinical applications in the field of bladder cancer biomarker research.
Keywords:Clinical proteomics; Biomarkers; Verification; Validation; Mass spectrometry
Introduction
Diseases with high complexity such as cancer are associ-ated with increased incidence rates worldwide. Recent data reveal that approximately 7.6 million deaths caused by cancer occurred in 2008, with this number corre-sponding to 13% of all deaths [1]. Based on these num-bers, there is substantial room for improvement in the current strategies for development of biomarkers cap-able of being introduced into clinical practice. According to the National Cancer Institute (http://www.cancer.gov/), a biomarker is defined as “a molecule detected in body fluids or tissues that are associated with a special process (normal or abnormal), a condition or disease”. Depending on the intended use, biomarkers can be distinguished on the following categories; diagnostic biomarkers which incorporate disease detection, prognostic that represent prediction of the course of a particular disease
(e.g. recurrence, progression and survival) and predictive that would allow for prediction of the response to treat-ment which could be subsequently applied in patient assessment [2-5]. In reference to malignant diseases, diagnosis at late stages generally results in poor clinical outcome [6,7]. The intended use of a cancer biomarker would hence be early stage diagnosis and/or prognosis. Thus, biomarkers that would enable early disease diag-nosis are required, together with those that would pro-vide prognostic values in disease status and predict an outcome of an illness prior to any treatment designed. Novel prognostic biomarkers may also help clinicians select an optimal therapeutic strategy for individuals, facilitating determination of the response to a specific treatment type. Successful introduction of biomarkers into routine clinical practice becomes the current motive in this research area and is expected to be beneficial to the patients and in health care systems. Discovering bio-markers is a multi-parameter process [8-10] and applying them to routine practice needs a proper consideration of multiple issues [11]. Additionally, since clinical needs differ among various diseases, biomarker development * Correspondence:[email protected]
1
Mosaiques Diagnostics GmbH, Mellendorfer Strasse 7-9, D-30625 Hannover, Germany
2
Biotechnology Division, Biomedical Research Foundation Academy of Athens, Soranou Ephessiou 4, 115 27 Athens, Greece
Full list of author information is available at the end of the article
including discovery, verification and validation cannot be restricted to a single methodology. In this article, we summarize the several challenges related to the biomarker research, as well as the available analytical platforms in the field of proteomics.
Review
Pipeline for biomarker development
For more than 40 years translational research in aca-demia and industry has attempted to introduce novel biomarkers with clinical utility to improve the manage-ment of diseases, especially those with high social and economic burden such as cancer. Although the analyt-ical platforms have expanded widely, especially in the case of Mass Spectrometry (MS), the vast majority of the published biomarker candidates are not introduced in the clinical practice, due to several issues. The lack of a gold standard can be a drawback since no test with an excellent performance is available to compare with the potential biomarkers. A risk of a biased assessment is thus present. Liu et al. recently addressed this issue by proposing a mathematical formula for covariate adjust-ment [12]. Several other causative factors have been re-ported to clarify this discrepancy either related to the disease background or the workflow of biomarker devel-opment. Along these lines, several levels of variability can be introduced starting with the disease heterogeneity [13,14], which occurs in complex diseases. Most import-antly, the lack of valid biomarkers is often a result of an inadequate set up of the discovery and validation stages [15]. For this reason, a very careful design of the bio-marker development is required from the discovery phase to subsequent verification and validation stages. At the same time, concurrent knowledge of the clinical background is needed and a clear target driven from the main clinical needs for the study [16,17].
Clinical conceptions on the biomarkers study design A good example to describe relevant issues on variations observed within the same disease is Urothelial Carcinoma. Bladder cancer (BCa) is a highly heterogeneous malig-nancy characterized by distinct clinical characteristics and molecular pathways [18]. Two independent molecular mechanisms that specifically trigger different pheno-types of urothelial carcinoma have been reported [18]. Ras/MAP kinase signaling activity is specifically in-volved in superficial phenotypes of the disease. Alter-ations in tumor suppressor activity of p53 and Rb and overexpression of EGFR and ErbB2, 2 and MMP-9 are characteristic for muscle invasive phenotypes (MIBC) [19-21]. Additional challenges regarding blad-der cancer could be that high risk non-muscle invasive BCa (NMIBC) tumour lesions are associated with poor outcome [22,23] and as for the tumor classification the
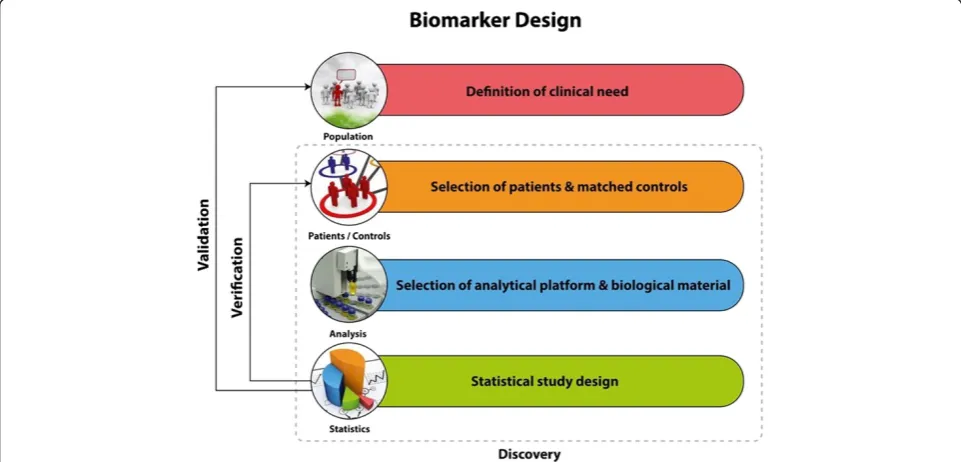
histological variations that can be observed within the same patient as the tumor progresses (intra-patient vari-ation) [24]. These facts should be taken into account in the study design and in terms of clinical objective. The critical parts which have to be considered during the study design are represented in the Figure 1. A biomarker a priori can be applicable only for a specific context of use, for which its performance has been assessed. In the case of bladder cancer, a subgroup or a panel of cancer bio-markers with diagnostic potential that could successfully detect early stage events would be beneficial [25]. A further aim could be the investigation of prognostic in-dicators for treatment response. The introduction of guidelines in the different biomarker stages has been described as an approach of quality assessment of the biomarkers and standards for designing and reporting biomarker studies have been proposed [26]. For epi-demiological studies certain requirements have been suggested in the context of STROBE-ME project [27]. For study design and requirements of predictive bio-markers PROBE standards have been proposed [28], while prognostic biomarkers should be in accordance to REMARK requirements [29].
Sample biobanking
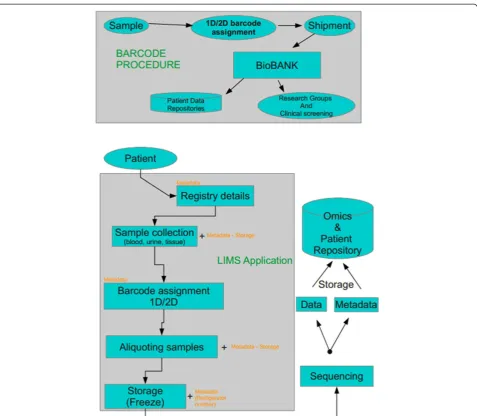
To develop a research finding into a clinical tool with diagnostic or prognostic value, a large number of bio-logical samples and/or tissue specimens is required. Pre-requisites include not only biological material resources, but also a very well-organized preservation domain to be retained, so called biobank. Ideally, a biobank should re-tain maximum quality of the biological material stored (following standardized protocols of sample handling), of associated clinical and demographical data, and it should be easily accessible and open to the scientific community [30]. Figure 2 depicts a rough outline of biobanking process [31]. An important issue is assigning a unique ID given to a sample [32], an appropriate database struc-ture and management system. Such systems have been currently developed [33-35] mainly as laboratory inform-atics management applications (LIMS) that are built to tract samples from the initial steps of delivery.
Sample collection and treatment
fluids could be separated into two distinct categories, based on their proximity to the organ of interest. For stance, biological fluids such as CSF, presenting with in-creased proximity with brain offer the opportunity for defining disease specific biomarkers, although the collec-tion could be in a rather invasive manner. In contrast, in the second category belong body fluids that can be readily available in large amounts, such as urine. The amount of biological material, as well as the non-invasive way of col-lection, is a major advantage for biomarker studies. The drawback of the analysis of this type of biological fluids could be their heterogeneous content, especially due to the presence of several interfering compounds that are ex-creted [38]. In the article by Lescuyer et al. the authors also give guidance on selection of samples: especially the inclusion of a reference group that contain both healthy individuals, but also patients with closely related diseases or patients presenting similar symptoms. Further, the per-formance of the potential biomarkers should not be influ-enced by pre-analytical factors. To clarify this issue in every type of investigation factors such as storage condi-tions and proteolysis, for example, should be taken into account and reported [38]. In the follow up article by Good et al. [39], emphasis is put on the selection of the suitable biological fluid or‘sample source’as the very first step of the study design. The authors suggest the proper evaluation and reporting of the variability, introduced among others by sampling treatment prior to any analysis [39]. Variability can be limited by the application of ap-proved standard protocols. In bladder cancer biomarker research, urine is a preferred source of biomarkers.
Protocols for urine collection and sample processing have been developed by European Kidney and Urine Proteomics (EuroKUP) and Human Kidney and Urine Proteome Pro-ject (HKUPP) (http://www.eurokup.org/node/138) [11].
Study design and evaluation of the analytical performance
to their model an initial cohort of 50 cases and 50 con-trols could successfully yield a good candidate and if in-dependent verification is applied in a 5 times bigger cohort (250 cases/250 controls), then the chance of a biomarker to pass into clinical validation phase could be >90%. Along the same lines, Shariat et al. [44] re-ported the need of a well-designed statistical evaluation in the context of defining valid bladder cancer bio-markers, while Behrens and colleagues proposed the validation of bladder cancer biomarkers particularly in prospective studies that meet epidemiological criteria [45]. Collectively, a careful design of the study accord-ing to the main clinical needs is required. The initial study is probably best performed in a well phenotyped, predefined cohort and sample handling and analysis
should be performed according to strict guidelines. Subsequent mandatory confirmation of the results is best achieved in a prospective multicenter study in the population at risk [46]. Following the above suggestions will substantially increase the possibility that a candi-date biomarker be successfully introduced into clinical practice [16,45].
Technical considerations regarding the analytical set up for biomarker development
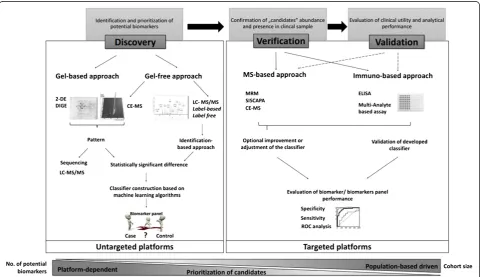
The biomarker workflow can be divided into 3 main parts: discovery, verification and validation. Depending on the specific aim of the study, various proteomic plat-forms can be applied from the unbiased discovery set-ting to the targeted quantification in the verification and validation stages. The basic characteristics of the objec-tives and platforms that can be employed at the different stages are summarized in the Figure 3. Below, a tech-nical description of the available proteomic technologies for discovery, verification and validation stages is pre-sented, together with certain recent applications particu-larly in the field of clinical proteomics in the quest of bladder cancer biomarker research.
A) Discovery of biomarkers
Identification of biomarker candidates is the first step to-wards clinical implementation [48]. At the discovery phase, two major approaches can be distinguished: a knowledge-based approach wherein selection of biomarker candidates is based on the existing molecular mechanisms underlying the disease initiation or progression, or alternatively an
unbiased approach that involves untargeted identification of differentially expressed proteins between two analyzed groups [48]. Currently, MS-based proteomics techniques favor untargeted approaches in biomarker discovery that result in a substantial increase of novel biomarker candi-dates [49,50]. However, due to the limited number of ana-lyzed samples, a high false discovery rate is observed and the reported differential expression frequently are a result of inter- or intra- individual variability. For example, 10% of urinary proteome is unique for a particular individual [51]. Small sample size at discovery phase leads to overesti-mation of accuracy of biomarker performance (i.e. sensitiv-ity and specificsensitiv-ity) and brings the reliabilsensitiv-ity of findings into question [52]. Consequently, the confirmation of detected differences and further investigation of the impact of re-lated diseases on a biomarker’s performance is mandatory.
In general, the classical proteomics workflow includes protein separation using gel-based or gel free techniques followed by the identification by mass spectrometry. Issues that have to be taken into account include estab-lishment of well characterized procedures and platforms
along with assessment of analytical variability in addition to the resolution being appropriate for the complexity of the analyzed material [52]. The most common specimen sources for biomarker discovery are body fluids (e.g. plasma, urine and cerebrospinal fluids) that are charac-terized by high complexity and wide dynamic range in protein concentration. In the case of plasma, the dy-namic range is exceeding 10 orders of magnitude [53]. Despite recent advances in the MS-based techniques, the typical MS-based analysis covers only the dynamic range of three to four orders of magnitude [54]. Since the potential biomarker candidates often belong to the low abundance proteins their detection is hampered by the presence of the highly abundant proteins. This is es-pecially evident in plasma where more than 95% of the total protein content comes from only 5 abundant pro-teins. In order to “dig the deep proteome” and increase coverage, several methods can be applied. One of the recommended strategies is reducing the sample com-plexity. This approach can be applied at several stages of the experimental workflow. Samples can be enriched for selected subcellular fractions or for specific type of pro-teins (based on post-translational modifications). Particu-larly, membrane ([55,56]), secreted [57,58], nuclear matrix [59] and phosphorylated proteins [60] and glycoproteins [61,62] are reported as a valuable source for biomarker identification. Moreover, in the case of plasma, depletion of highly abundant protein like albumin and IgG is widely applied. Several methods have been developed in order to improve the detection of proteins in the low concentration range. Comparison and/or evaluation of different de-pletion methods was a subject of several studies [63-66]. As an example Tu et al. [66] compared the protein content from plasma samples depleted using immunoaffinity chromatography with unfractionated samples. Applied methods (Multiple Affinity Removal System, Agilent Technologies, Inc.) enables removal of 7 or 14 most abundant plasma proteins. IEF-LC-MS/ MS analysis revealed enrichment for 23 low abundant proteins in depleted fraction, which covered around 5-6% of total protein identifications [66]. As exemplified, even application of the depletion approach followed by shotgun analysis did not allow the identification of the majority of low abundance proteins. Additionally, some issues concerning the depletion approach include: a) re-producibility, b) co-depletion of proteins of interest, c) requirement of higher amount of starting material or d) removal of only selected highly abundant proteins. Al-ternative, extensive fractionation can be performed. Re-cently, Atanassov et al. [67] described the combination of three separation strategies namely 1D-PAGE, pIEF (peptide isoelectric focusing) and RP-HPLC as an ef-fective methods for reaching deeper proteome. Authors analyzed the nuclear extract from HeLa cells using the
single separation methods (1D-PAGE and pIEF) as well as combined approach for the nuclear extract from HeLa cells. Increasing number of peptide and protein identifications were observed for the established three dimensional workflow (56228 peptides, 5260 proteins) in comparison to each individual approach (1D-PAGE-LC-MS/MS: 38557 peptides, 3540 proteins; pIEF-LC-MS/MS: 31113 peptides, 3945 proteins). Zhang et al. utilized a mix-bed ion-exchange chromatography (mix-ture of the strong cation and anion-exchange material) for protein separation prior to MudPIT analysis (multidimen-sional-protein identification technology) [68]. The work-flow was tested using cell lysate from mammary tumor 4 T1. Using the classical MudPIT approach, 1292 proteins were identified, whereas application of 3D workflow en-abled identification of 3084 proteins and covered 86% of identified proteins using classical MudPIT. Therefore, ap-plication of additional fractionation strategy can improve the proteome coverage. On the other hand, Zubarev et al. recently showed that the in-depth proteomic analysis can be performed using only one dimensional LC-MS/MS [69]. However, optimization is necessary, including sample preparation, chromatographic separation as well as MS analysis. The authors report that a 4 h procedure using a 50 cm column and MS/MS analysis enabled the identifica-tion of 37554 peptides corresponding to 4825 proteins (1% FDR at peptide and protein level). This covers around 50% of analyzed human malignant melanoma cell line (A375). Apparently, state-of-the-art MS-based platforms combined with optimized analytical workflow enable “deep” proteome coverage. Moreover, in comparison to the multidimensional procedures, the lower initial amount of starting material, shorter analytical time and cost-effectiveness are advantageous. In this part of review, we will summarize the current untargeted proteomics plat-forms for biomarker discovery along with the recent and representative examples of their application in bladder cancer biomarker discovery.
related with pathological states. However, moderate re-producibility and limited detection for hydrophobic proteins (such as membrane), low abundance proteins, proteins above or below the pore size of the gel as well as proteins beyond the pH range of the IPG strips are shortcomings of 2-DE [78].
Difference gel electrophoresis (DIGE) is the recent ad-vancement in traditional 2-DE [79]. In this approach three fluorescent cyanine dyes (Cy2, Cy3, and Cy5) of identical charge, similar molecular mass and different fluorescent properties, are used to label the proteins be-fore separation [79,80]. The three samples: control, case and internal standard (combination of equal amounts of tested samples) are pooled after labeling and separated simultaneously. This reduces the number of gels as well as gel-to-gel variability, which is one of the major draw-backs of the classical approach [79,80]. Also, improved matching and more accurate quantification are achieved due to the presence of internal standard on all gels [80]. DIGE is more expensive and requires additional equip-ment like fluorescent scanner, but also offers higher sen-sitivity (0.5 fmol proteins) [80].
Gel-free proteomics
Shotgun proteomics To bypass the limitations of the classical gel-based approach, efforts have been focused on the development of gel-free strategies. Shotgun or “bottom-up” proteomics is based on the analysis of na-tive or protease derived peptides followed by sequencing with tandem mass spectrometry (MS/MS). Keeping in mind that the complexity of the sample is high, to im-prove the proteome coverage extensive/multidimensional fractionations has to be conducted prior to MS/MS ana-lysis. Currently, different fractionation strategies are ap-plied including mostly chromatography (ion exchange, reverse phase etc.) [68,69], IEF [66] or combination of these techniques [67]. This issue was described in the introductory part in this section.
In general, the large-scale proteomic analysis by MS/ MS includes the following parts: 1) peptide ionization, 2) separation of precursor ions based on the mass-to-charge ratio, 3) fragmentation, 4) analysis of daughter ions, and 5) data analysis including identification and quan-tification [81]. Two major quanquan-tification approaches can be employed namely: label-based (metabolic or chemical labeling) and label-free (spectral counting and intensity-based analysis) approaches. Both approaches along with their advantages and limitations were exten-sively reviewed by DeSouza et al. [82]. Briefly, peptides from particular samples are labeled with different tags, mixed and analyzed by MS. In metabolic labeling (e.g. SILAC) heavy isotope amino acids are incorporated during protein synthesis, while in chemical labeling (e.g. Isobaric tag for relative and absolute quantification (iTRAQ),
Isotope- coded affinity tags (iCAT) are applied after tryptic digestion. The mass shift introduced by the label is used to distinguish components derived from the different sam-ples. The analytical variability on quantification is reported to significantly reduced in this experimental procedure in comparison the label-free approach where samples are measured separately, and differences in sample prepar-ation as well as run-to-run variability can affect the results. Labeling is more expensive, since it requires isotope spe-cific labeling reagents, and may also result in the introduc-tion of artefacts, as well as a reduced coverage and dynamic range, due to the pooling.
Even though tandem mass spectrometry can result in high number of protein identifications, the false positive and false negative identifications are an inherent prob-lem in shotgun experiments. Since shotgun proteomics is a peptide-based approach, the false protein identifica-tions can occur as a result of incorrect assignment of fragmented ion spectra to peptide sequence as well as further inferring of protein identifications. Therefore, the false discovery rate is evaluated on peptide and pro-tein level. Strategies to evaluate the false discovery rate for mass spectrometry results include searching against concatenated (chimeric database, composed from tar-geted and decoy database) [83] or decoy database [84], application of statistical models [85,86], or utilization of scoring system [87]. Methods for evaluation of assign-ment of peptides to protein sequences have been also described [88,89]. Of note: in general estimates of FDR are too optimistic [90], and the true FDR may be up to 10-fold higher.
CE-MS Another interesting strategy that can be used in the biomarker discovery phase relies on analysis of the low molecular weight proteome, also defined as“peptidome”. For the identification of biomarkers on the peptidomics level, capillary electrophoresis coupled to mass spectrom-etry (CE-MS) has been widely applied [91-93]. Analytical performance of CE-MS was described recently and several issues including precision, stability, limits of detection, re-producibility and intra-variability were addressed [42]. The developments and applications of this platform in clinical proteomics were reviewed recently [94,95]. Briefly, small proteins and peptides are separated through an elec-tric field according to their charge and size. Currently, sep-aration in an uncoated bare fused silica capillary column at low pH is the best practical solution [95]. Different capillary coatings have been proposed to improve the analytical performance (robustness, resolution, repro-ducibility), however due to coating instability none of these techniques has been routinely used [96]. After elec-trophorethical separation, analytes are ionized (mostly by electrospray ionization (ESI) followed by MS analysis.
sheathflow and sheathless interface. In general, all large-cohort studies are performed using the sheathflow approach, while sheathless interfaces currently are of limited robustness and reproducibility (as presented in the table from [95]). Detected peptides are character-ized by the CE migration time, signal intensity and mo-lecular mass. For identification, different platforms were tested e.g. CE-MALDI-TOF-TOF (Matrix-assisted laser desorption/ionization time-of-flight mass spec-trometry), CE-ESI-QTOF (Quadrupole time-of-flight mass spectrometer) [97] and CE-Orbitrap [98]. The mi-gration time in CE is dependent only on mass and the number of basic, neutral and polar amino acids [97]. This fact can be used to assign the peptide sequences obtained from LC-MS/MS (Liquid Chromatography) analysis to peptide mass that is detected by CE-MS [97].
Statistical data mining for proteomic biomarker discovery Current proteomic approaches enable assessment of thousands of biomarker candidates. As aforementioned, at this stage a high false positive rate is observed [10]. Therefore, robust statistical analysis that allows the de-termination of“true”as well as promising candidates for further verification is of paramount importance [99]. Dakna et al. examined different statistical tests to dis-cover valid biomarkers from proteomic data [100]. The non-parametric Wilcoxon test was found best suited for analysis of proteomic data: after validation in an inde-pendent sample set the highest percentage of valid bio-markers were detected. Additionally, the authors showed that adjustment for multiple testing is mandatory to de-rive potential biomarkers that can be verified in an inde-pendent test set.
Obviously, selection of candidates should not be based only on statistical significance, but also on the ability to fulfill a specific clinical need [43,100]. However, poor statistical design at the early experimental stage results in lack of statistical power to select relevant candidates, due to insufficient number of samples analyzed [43,100].
B) Verification of biomarkers
Verification is mandatory to evaluate the findings ob-tained in the discovery phase. Although in discovery phase unbiased or untargeted approaches are applied to define a candidate or a set of candidate biomarkers, the verification phase represents a targeted approach for fur-ther evaluation of biomarkers sensitivity, specificity and predictive capabilities. More importantly, the verification is performed on the appropriate biological specimen that may be further used in clinical practice. In general, veri-fication studies require larger patient populations than the discovery phase. Depending on the specific study de-sign the analytical platform could be the same as in the discovery phase (CE-MS based classification) or vary
with preferable assays to be either mass spectrometry based [101,102] or protein binding assays [103].
Protein binding assays
Protein binding assays include both the traditional im-munoaffinity based ELISA (Enzymed- linked Immuno-sorbent assay) or other multiplex assays and Protein microarrays [104]. The most widely used technique for protein quantification is ELISA. The advantages of the method are speed, sensitivity and specificity, and com-patibility with standard clinical laboratory equipment, so that it can be applied in clinical routine. The selectivity depends on the antibody that is applied and furthermore it has to be evaluated in the specimen of interest. The additional limitation of ELISA is that it cannot provide a simultaneous quantitative analysis of multiple potential biomarkers. In order to obtain quantitative data via par-allel analyses for multiple antigens, Multiplex immuno-assays have been developed. Protein microarrays are designed to print specific antibodies or antigens onto a support surface, generally a slide or membrane. A single sample is hybridized to the array. The captured antigens or antibodies are subsequently detected [105]. Assay plat-forms such as MULTI-ARRAY (Meso Scale Discovery), Bio-Plex (Bio-Rad Laboratories), have been applied for Cytokine detection, while regarding the renal injury a panel of 7 Biomarkers based on Antibody assays has been proposed as biomarkers with improved potential to assess renal function [106]. A major risk in the multiplex arrays is the increased cross-reactivity, due to the presence of multiple antibodies, which are normally applied as a mixture. To improve the assay specificity, Juncker and his collaborators have developed a number of innova-tive platforms with improved performance [107-109]. As a solution to avoid the mixing of the reagents, this group attempted the application of glass slides in a de-vice called “snap chip”. The antibodies are immobilized in a multiple arrangement on a glass slide, where the sam-ple is also applied [107]. The above group also introduced the use of gel captured antibodies in alginate droplets to increase the sensitivity of the detection. In this study in 2011, the assay was evaluated using 6 proteins, 3 already reported cancer biomarkers, as well as 3 cytokines (CEA, HER2, ENG and TNF-a, IL-8, MIP/CCL4 respectively) [108]. A new methodology based on the co-localization of the primary captured antibodies and the secondary detec-tion antibodies is now proposed, namely ACM or Anti-body Colocalization Microarray. When compared with the classical singleplex ELISA and conventional multiplex sandwich assays, ACM was proven to decrease the level of cross-reactivity. However, this technique could be more complex as it requires precision in the alignment [109].
cancer biomarkers, possibly also as a result of bias of the regulatory agencies towards conventional, but well char-acterized technologies. Many applications are reported, as reviewed by Fuzery et al. [8].
Mass spectrometric quantitative approaches
Apart from antibody-based technologies alternative methods for quantitative analysis and validation of po-tential biomarkers are quantitative MS methodologies, including the application of scanning techniques, such as multiple reaction monitoring (MRM) and other stable isotope labeling-based approaches such as SISCAPA (Stable Isotope Standards and Capture by Anti-Peptide Antibodies). The combination of high throughput cap-abilities of Mass Spectrometry, together with increased specificity and sensitivity that can be compared to im-munoassays in some cases are the main advantages that make MS based applications very popular for quantita-tive validation studies [110]. MRM has the great advan-tage that an antibody is not required, but still awaits application in a clinical setting [111].
Multiple reaction monitoring MRM is the extended version of Selected Reaction Monitoring (SRM) [112]. The analysis is focused only on biomolecules of specific masses, while all others are excluded. Higher specificity is achieved by the isolation of a specific precursor ion, collision-induced fragmentation and the subsequent de-tection of the specific product ion after fragmentation. Triple quadrupole instruments are typically employed for this approach [111,113,114]. A recent application in bio-marker characterization in tissue specimens from patients with colorectal carcinoma was introduced (Hyperplex MRM). In this study a combination of a strategy for rela-tive quantification such as iTRAQ was conducted with an mTRAQ approach for absolute quantification. This re-sulted in increased robustness of the MRM approach since 4 different samples were labeled simultaneously and in in-creased validity of the quantification since relative and total quantities of the biomarkers could be achieved [115]. Another variation of MRM methodology is a peptide immunoaffinity enrichment technique coupled with stable isotope dilution mass spectrometry, called SIS-CAPA [116]. In this technique, one or more selected tryptic peptides with unique sequences representing the target protein, the “proteotypic” peptides, are enriched using anti-peptide antibodies bound to Protein G. A stable isotope dilution (SID) method is applied as an in-ternal standard by the use of a defined quantity of spiked stable isotope- labeled peptide of the same se-quence in a pre-defined quantity. The relative quantifi-cation of the peptides is indicative of the protein concentration in the sample. In this assay, the sensitiv-ity and specificsensitiv-ity of antibody binding is combined to
the versatility of MS, providing several advantages com-pared to the conventional immunoassays. Moreover, it provides the capability of analysis of multiple analytes in a single assay by combining antibodies in the enrich-ment step [117-119].
Pre-treatment strategies In order to decrease the limit of detection, different pre- treatment strategies can be combined, like enrichment of the peptides of interest, sample pre-fractionation and depletion of the high abun-dance peptides. For targeted peptide enrichment, specific anti-peptide antibodies can capture the peptides of inter-est in the way it described above in the SISCAPA ap-proach [120].
Many studies have reported the value of sample pre-fractionation and/or depletion. Kuhn et al. [121] first applied this strategy to characterize C-reactive protein in serum of patients with rheumatoid arthritis upon deple-tion of the 3 most abundant proteins in serum: albumin, immunoglobulin G, and haptoglobin. Yang et al. con-ducted two-dimensional solid-phase extraction as frac-tionation step prior to quantification of somatropin in plasma samples [122]. Keshishian et al. reported a 1000-fold improvement of limit of detection (LOD) upon de-pletion of seven high abundant plasma proteins by strong cation exchange chromatography [123]. A range of the values for the limit of quantification (LOQ) was between 1 and 10 ng/ml and coefficient of variation (CV) of 3-15% was estimated [123]. Employing the SIS-CAPA methodology, Kuhn et al. enriched for troponin-I and interleukin-33 in plasma samples to characterize these proteins as cardiovascular biomarkers [124]. To as-sess the inter-laboratory performance of immunoaffinity enrichment coupled to MRM- MS, Kuhn et al. designed an inter-laboratory study based on the quantification of 8 predefined peptides from S100A7, S100A8, S100A12, and IL1RN proteins [125]. Coefficient of variation was calculated for replicates analyzed by the same system (intra-laboratory) and across different laboratories (inter-laboratory) [125]. Overall inter-laboratory CV was esti-mated below 25 at the LOQ level. Inter-laboratory CV for immuno-MRM particularly, was calculated to be 14%, while intra-laboratory CV for immuno-MRM was 7%, re-spectively [125].
Data mining & statistical analysis
[128], where endogenous stable and abundant peptides are used as internal standards. Another approach is SRMstats which can be applied to adjust for the median of the logarithmic values of the intensities obtained by the heavy isotope labeled peptides [129]. Variation caused by the analytical process or sample treatment may be corrected with the same methodology proposed by Johnson et al. for microarrays studies [130], where parametric and non-parametric formulas are applied, taking into account the mean intensity and variance in each sample [130].
C) Bioinformatics platforms in clinical proteomics
Knowledge of biological mechanisms is helpful in the in-terpretation of proteomic results [131]. The application of computational techniques in analysing information associated with biomolecules on a large-scale platform has now been firmly established as a discipline in mo-lecular biology encompassing a wide subject area from structural biology, genomics to gene-expression studies. Biological data at the omics level from transcriptomics to proteomics and metabolomic profiles are being pro-duced at a very high rate [132,133]. For such a surge in data, computing science has become indispensable to biological research especially in handling large quantities of data and probing the complex dynamics observed in nature [134]. The main aims of bioinformatics include:
1) The organization of the data in a way to allow researchers access existing information and to submit new entries. Some of which include GEO [135], ArrayExpress [136] and Human Proteinpedia (http://www.humanproteinpedia.org/),
2) The development of new tools and resources for data integration and analysis, for which expertise in computational theory as well as a thorough
understanding of biology is required. Such examples are interaction databases like IntAct, BioGrid and databases related to diseases like OMIM, Oncomine and metabolomics databases like HMDB.
3) The application of these tools in data analysis and interpretation of the results based on a biological meaningful manner, for instance web based tools like String and Cytocape for visualisation or AmiGO, KEGG, DAVID on the pathway level.
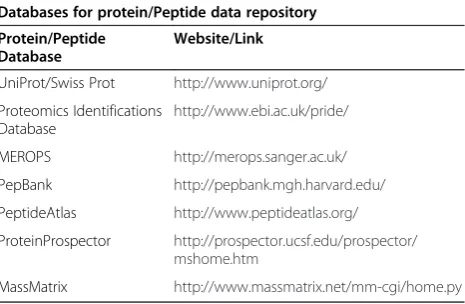
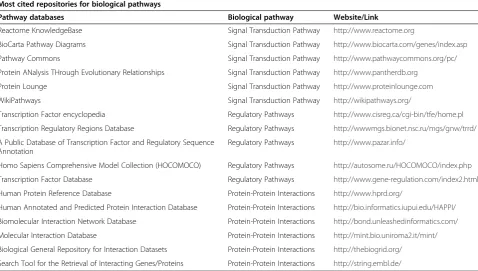
In particular for proteomics datasets, gene ontology and pathway annotations, as well as patient information should not only contain high confident data but should also be in a well-structured architecture to provide genu-ine data retrieval, coverage, and utility [137]. Some of the reliable protein/peptide and biological pathway resources used for proteomics profile processing in research and academic firms are described in Tables 1 and 2. After
relying on annotated data sets from different databases (Table 2), the next steps are computational approaches in a systematic manner to analyse such integrated data. Computational approaches also provide means for infer-ring in silico and analysing changes in interactions and network dynamics [138]. Some of the computational tools for integrating proteomics datasets on a pathway level are:
1) Pathway analysis: KEGG [139], Ingenuity Pathway Analysis (www.ingenuity.com) MetaCore
(http://host.genego.com/metacore.php)
2) Pathway mapping: Reactome [140], PathViso [141], BioCyc plugin [142]
3) Gene Ontology analysis: ClueGO [143], BiNGO [144], FuncAssociate [145]
4) Network analysis: GeneMania [146], DisGeNet [147], EnrichmentMap [148], NetAtlas [149], NetworkAnalyzer (http://med.bioinf.mpi-inf.mpg.de/ netanalyzer/index.php) [150], KUPNetViz [151] 5) Interactome mapping: iRefScape [152], MiMI [153],
PanGIA (http://prosecco.ucsd.edu/PanGIA/), BioNetBuilder [154], Bisogenet [155], FunNetViz (http://www.funnet.ws/)
6) Metabolomics analysis: IDEOM [156], MAVEN, MetaCore, Beilstein, mzMatch [157]
Applications of systems biology–disease diagnosis and treatment
Network based approaches to human diseases appear to have enormous potential in biological and clinical applications. To better understand the effects of cellular mechanisms on disease progression, identifying pro-teins and pathways that are related to disease may offer better targets for drug development. These advances may also lead to the selection of better and more accur-ate biomarkers that are associaccur-ated with diseases and help with disease classification. Current systems-based approaches focus on identifying pathways that may be used to subtype a disease and develop treatments for
Table 1 List of reliable protein and peptide databases
Databases for protein/Peptide data repository
Protein/Peptide Database
Website/Link
UniProt/Swiss Prot http://www.uniprot.org/
Proteomics Identifications Database
http://www.ebi.ac.uk/pride/
MEROPS http://merops.sanger.ac.uk/
PepBank http://pepbank.mgh.harvard.edu/
PeptideAtlas http://www.peptideatlas.org/
ProteinProspector http://prospector.ucsf.edu/prospector/ mshome.htm
individual disease groups. Network modules have been used to predict patient survival, metastasis, invasion, drug response etc. [158-164]. For this purpose, a well characterised group of samples is required related to a disease subtype/stage, for example cancer metastasis to search among specific networks or so called sub-networks for potential biomarkers that enable disease classification [165]. Additionally, systems analysis may provide with insights in the molecular mechanisms underlying the diseases. This may be highly valuable in drug development by indicating correlation between
the response to a drug and the responders’ molecular
background. An example of such an approach is the study by Chu and Chen, where a protein-interaction network was applied to investigate drug targets related to apoptosis [166].
D) Validation of biomarker candidates
The pivotal objective of the validation phase is to evalu-ate the clinical utility of the biomarker candidevalu-ates [9]. Validation has to be performed in an independent, suffi-ciently large sample set also reflecting the heterogeneity of targeted population. This is mandatory also since the diagnostic accuracy is often generally overestimated in the model established in training set (groups of individ-uals used for discovery of biomarkers and development of the model) [52]. To demonstrate the clinical utility, validation studies have to be driven by the specific con-text of use and targeted population, since depending on
the clinical needs the biomarker has to fulfill different re-quirements regarding clinical performance (i.e. sensitivity and specificity). The accuracy of individual biomarker or biomarkers panel performance can be assessed by the ROC (receiver operating characteristics) analysis [167]. ROC curve represents a plot of true-positive rate (sensitiv-ity, percentage of cancer patients who tested positive for biomarkers) versus false positive rate (FPR, percentage of healthy subject classified as having disease). Whereas spe-cificity is defined as 1-FPR. In this method the area under the curve (AUC) is used as an indicator of the biomarker performance regarding the ability to distinguish between control and patients affected by disease. It is of paramount importance to take into account the false positives and false negatives in order to establish an optimal classifica-tion threshold at desired specificity and sensitivity level. Biomarkers utilized for screening should reveal high sensi-tivity and, frequently even much more important, a low level of false positives. On the other hand, specific diag-nostic tests require high positive predictive values (PPV, percentage of diseased patient among all positive test re-sult). Due to the fact that sensitivity and specificity do not provide the information about probability of disease oc-currence, disease predictive values have to be assessed i.e. (PPV, PPN). However, these values are dependent on dis-ease prevalence and can only be assessed in prospective studies [8]. Collectively, regardless of the clinical use, con-sequences from false positive and false negative cases have to be always considered as a benefit-to-harm ratio.
Table 2 List of highly cited pathway databases for proteomic applications
Most cited repositories for biological pathways
Pathway databases Biological pathway Website/Link
Reactome KnowledgeBase Signal Transduction Pathway http://www.reactome.org
BioCarta Pathway Diagrams Signal Transduction Pathway http://www.biocarta.com/genes/index.asp
Pathway Commons Signal Transduction Pathway http://www.pathwaycommons.org/pc/
Protein ANalysis THrough Evolutionary Relationships Signal Transduction Pathway http://www.pantherdb.org
Protein Lounge Signal Transduction Pathway http://www.proteinlounge.com
WikiPathways Signal Transduction Pathway http://wikipathways.org/
Transcription Factor encyclopedia Regulatory Pathways http://www.cisreg.ca/cgi-bin/tfe/home.pl
Transcription Regulatory Regions Database Regulatory Pathways http://wwwmgs.bionet.nsc.ru/mgs/gnw/trrd/
A Public Database of Transcription Factor and Regulatory Sequence Annotation
Regulatory Pathways http://www.pazar.info/
Homo Sapiens Comprehensive Model Collection (HOCOMOCO) Regulatory Pathways http://autosome.ru/HOCOMOCO/index.php
Transcription Factor Database Regulatory Pathways http://www.gene-regulation.com/index2.html
Human Protein Reference Database Protein-Protein Interactions http://www.hprd.org/
Human Annotated and Predicted Protein Interaction Database Protein-Protein Interactions http://bio.informatics.iupui.edu/HAPPI/
Biomolecular Interaction Network Database Protein-Protein Interactions http://bond.unleashedinformatics.com/
Molecular Interaction Database Protein-Protein Interactions http://mint.bio.uniroma2.it/mint/
Biological General Repository for Interaction Datasets Protein-Protein Interactions http://thebiogrid.org/
Ultimately, application of novel biomarker/biomarkers panel has to improve the outcome. A striking example of an unfortunate development is the prostate specific anti-gen (PSA) test. The applicability of this test for prostate cancer screening arose controversy in medicine [168]. It has been claimed that decrease of mortality for prostate cancer is the major benefit of PSA-based screening. How-ever, Andriole et al. reported that the screening does not reduce the number of deaths for prostate cancer after 13-years follow up [169]. Moreover, the false-positive results (and they represent the majority in this case) have harmful consequences including invasive biopsy as well as follow-ing complication, overdiagnosis and overtreatment of dis-ease [168].
Varied challenges are encountered at the validation stage including e.g. 1) samples quality and availability, 2) funding and 3) requirements of regulatory agencies [170]. Due to these facts, validation is a bottleneck in the biomarker development process [170]. In addition, the scientific reward in validation is moderate: validation studies are generally rejected in high impact journals. To also ensure robustness, validation should be performed in a multi-center study [52], and selected cohorts have to represent the population targeted with the biomarker. Bearing in mind that most promising candidates have to be tested in hundreds or even thousands of samples, val-idation requires quantitative, robust, (multiplex) and high throughput methodology. Not all of the platform applicable at previous stages can fulfil these require-ments. Therefore, changing the platform can be neces-sary: biomarkers discovered using gel-based approach cannot be further validated by the same techniques, mainly due to its limited throughput. On the other hand, CE-MS serve as a good example of a technique, which can be applied for all biomarker development phases [91-93]. High reproducibility, high throughput and cost-effectiveness are reported [42]. These characteristic along with the need for developing biomarker panels, makes CE-MS an attractive platform for biomarker development.
Currently, antibody-based approaches are considered as the gold standard in clinical application, mostly since this is a technology well known to everybody. However, application of immunoassays is often hampered by the lack of high-quality antibodies. Additionally, the ELISA assay enables detection of a single antigen, a drawback for the validation of biomarker panels. Moreover, the low-dynamic range and high cost of development of ELISA based assays indicate a moderate utility of this approach in large scale validation studies. To bypass some of the limitations multi-analyte immunoassays have been applied [171] including planar array [172] and micro-bead assays [173,174]. In planar array, different antibodies are spotted on a flat surface, whereas in a
second type, antibodies are immobilized to varied micro-beads [172]. Recently, Fu et al. [175] compared the analyt-ical performance of five currently used multiplex immuno-assays in the context of their application for validation of biomarkers (particularly cytokines) in serum. The MULTI-ARRAY (planar assay) and Bio-Plex (magnetic beads) are characterized by better performance than other tested multiplex assays i.e. A2 (Beckman Coulter), FAST Quant (Whatman Schleicher & Schuell BioScience), and Flow-Cytomix (Bender MedSystems), but this is also dependent on analyzed biospecimens (serum or purified cytokines) [175]. Application of multiplex assays enables high-throughput quantitative analysis and uses less sample vol-ume. On the other hand, development of novel multiplex immunoassays is a challenging task. Currently, antibodies are commonly used as capture ligands, but aptamer li-gands (oligonucleotides) may offer an alternative novel ap-proach [176,177]. A promising alternative are MS-based (typically MRM) approaches, as described in details in previous section. After establishing clinical utility (which equals significant improvement over the current state of the art) [16], further assessment of analytical performance is required. In this case, the following issues have to be ad-dressed: detection and quantification limit, precision, sta-bility of analyte, specificity, interfering compounds etc. This topic was covered recently by Fuzery et al. [8] and it is beyond of the scope of this paper to review this issue in detail.
Application of proteomics approaches in BCa biomarker discovery
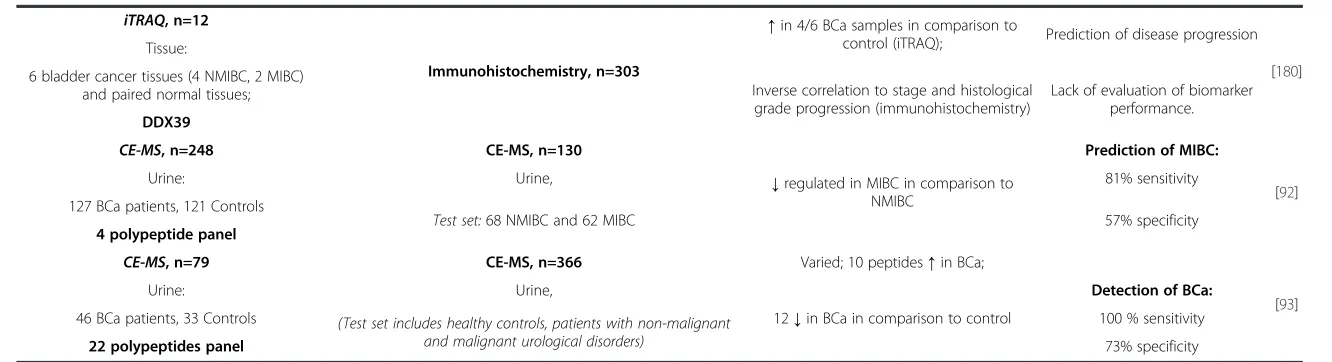
some tests have been approved by FDA (e.g. NMP-22, BTA-TRAK, uCyt+), they seem to have no clinical util-ity [187-189]. Therefore, there is an urgent clinical need for application of novel non-invasive tests for early de-tection, patient monitoring and stratification. A vast number of potential biomarkers have been discovered using proteomics as well as genomics approaches. The de-tailed description of currently available bladder cancer biomarker candidates is beyond the scope of the manu-script and this topic was recently reviewed [190,191]. To give an overview on the current status of BCa proteomic biomarkers, the representative examples along with study design and potential clinical utility are described below and summarized in Table 3.
Gel-based proteomics
Chung et al. detected by 2-DE elevated levels of cofilin in BCa tissues vs. control urothelium. In total, 24 sam-ples were analyzed resulting in identification of 12 differ-entially expressed proteins. The up-regulation of cofilin in BCa tissue specimens was confirmed by Western Blot and immunohistochemistry. Additionally, an antibody specific for phosphoylated Ser-3 of cofilin revealed ele-vated phosphorylation in BCa samples, especially in muscle-invasive BCa. In parallel, in vitro studies showed decreased EGF-induced migration in cofilin knock-down T24 cells. Collectively, both expression and phosphoryl-ation of cofilin may be involved in BCa aggressiveness [178]. In another study, the urinary proteome was inves-tigated in order to detect biomarkers for aggressive BCa. Zoidakis et al. analyzed urine samples from NMIBC and MIBC patients using enrichment by IMAC [182]. Col-lected enriched fractions were separated using 1D-SDS PAGE followed by in-gel digestion. Protein identification was performed using LC-MS/MS analysis. The study re-vealed aminopeptidase N, profilin-1 and myeloblastin as potential biomarker candidates. Further confirmation by Western blot or ELISA was conducted for selected pro-teins. Aminopeptidase N found to be down-regulated in MIBC, whereas Profilin-1 and myeloblastin were up-regulated in invasive cancer [182]. Orenes-Pinero has applied differential gel electrophoresis to investigate the urinary proteome of BCa patients (n = 7, positive cy-tology) and controls (n = 7, negative cycy-tology) [181]. Dif-ferentially expressed proteins were identified by peptide mass fingerprinting using MALDI-TOF MS, including Regenerative protein (Reg-1), cytokeratins 1, 2 and 10, T-cell surface protein CD5 and prefoldin. Among these, only cytokeratin 1 was down-regulated in urine from BCa patients. Western blot analysis of eight bladder can-cer cell line models (from non-invasive to metastatic) in-dicated the correlation between the levels of the proteins identified by proteomics and cancer progression. Quan-titative analysis of urinary Reg-1 was evaluated by ELISA
(n = 80) and used for evaluation of diagnostic accuracy. Sensitivity and specificity at the level of 0.0038 ng/mL were 81.3% and 81.2%, respectively.
Gel-free proteomics
The shotgun approach followed by labeling or label-free quantification has also been widely implemented in bio-marker discovery research. Frantzi et al. described urin-ary histone H2B and Zinc-finger 335 (NIF-1) as a potential progression marker for BCa. Urine from benign (n = 5), non-invasive (n = 10) and invasive cases (n = 5) was enriched by IMAC and native peptides were analyzed by LC-MS/MS. It total, 1845 peptides were detected (638 precursor proteins). Differential regulation of histone H2B and NIF-1 were verified further by ELISA (urine, n = 166) and immunohistochemistry (tissue samples, n = 32) [179]. Apart from the label-free approach, labeling techniques have been also employed to discover biomarkers for BCa. Kato et al. used iTRAQ labeling to compare the proteome from bladder carcinoma urothelium (n = 6) with paired normal tissues (n = 6) [180]. 493 proteins were identi-fied including 15 up-regulated proteins in cancer cases in comparison to adjacent normal samples (e.g. DDX39, B-cell receptor-associated protein 31, chaperonin con-taining TCP1, FK506 binding protein 4, S100 calcium binding protein A1). Immunohistochemistry (n = 303) was used to verify the findings for protein which have not been previously evaluated. However, actin-related protein 3 homolog B was not verified, since the anti-bodies were not commercially available. This example indicates one of the drawbacks for application immune-based assays for protein verification: lack of specific anti-bodies. Authors found decreased expression of DDX39 with higher cancer stage and grade. In addition, low ex-pression level of DDX39 significantly correlates with dis-ease progression. Further functional analysis using siRNA assay was performed in bladder cancer cell line (T24). As a result, an increased invasion ability of cells transfected with si-DDX39 compared to control was observed. There-fore, reduced expression of this protein may serve as a biomarker to predict disease progression [180].
Gel-based approaches
2DE, n=24
[178]
Tissue: Western Blot ↑in both NMIBC and MIBC; Predict cancer progression
6 normal urothelium, 9 NMIBC, 9 MIBC Immunohistochemistry, n=24
↑phosphorylation level of cofilin in BCa tissue samples (most prominent in MIBC).
Lack of evaluation of biomarker performance. Cofilin For both experiments, the same material was
used as in the discovery phase.
IMAC, 1-SDS-PAGE, n=35 Western Blot
[182]
Urine: Aminopeptidase N, n=108 Aminopeptidase N Biomarker for cancer
aggressiveness
Two pools from NMIBC, n1=9, n2=7 Myeloblastin, n=97 ↑in MIBC
Two pools from MIBC, n3= 9, n4=10 ELISA Myeloblastin, Profilin 1 Lack of evaluation of biomarkerperformance.
Aminopeptidase N, Myeloblastin, Profilin-1, n=82 ↓in MIBC
Profilin-1
Western Blot,8 BCa cell line models
↑in BCa cases, association with stage [181]
DIGE, n=14 Tissue microarray, n=292 Diagnosis, staging, outcome
prognosis
Urine: Primary urothelial cell carcinoma Detection of BCa:
7 BCa (positive cytology),
7 controls (negative cytology) ELISA, n=80
Reg- 1
Urine: 81.3% sensitivity
32 BCa (positive cytology),
48 Controls 81.2% specificity
(negative cytology)
Gel-free approaches
ELISA, n = 166
[179] Urine,
LC-MS/MS, n=20
Urine: For H2B: n=147,
↑level of H2B with cancer stage in urine and tissue samples
Prediction of disease progression, discrimination of tumor stages Benign (n=5), pTa, pT1 (n=10),
pT2+ (n=5)
For NIF-1: n = 158
In both groups urine from benign, NIMB (Ta, Ta) and MIBC (T2+) were included.
histone H2B, NIF-1 ↓level of NIF-1 with cancer stages
(not agreement with urinary level)
Lack of evaluation of biomarker performance. Immunohistochemistry, n=32
pTa, pT1, n=23, pT2+ n=9
Clinical
and
Translationa
lMedicine
2014,
3
:7
Page
14
of
22
d.com/con
Immunohistochemistry, n=303 [180] 6 bladder cancer tissues (4 NMIBC, 2 MIBC)
and paired normal tissues; Inverse correlation to stage and histological grade progression (immunohistochemistry)
Lack of evaluation of biomarker performance. DDX39
CE-MS, n=248 CE-MS, n=130
↓regulated in MIBC in comparison to NMIBC
Prediction of MIBC:
[92]
Urine: Urine, 81% sensitivity
127 BCa patients, 121 Controls
Test set:68 NMIBC and 62 MIBC 57% specificity
4 polypeptide panel
CE-MS, n=79 CE-MS, n=366 Varied; 10 peptides↑in BCa;
[93]
Urine: Urine,
12↓in BCa in comparison to control
Detection of BCa:
46 BCa patients, 33 Controls (Test set includes healthy controls, patients with non-malignant
and malignant urological disorders)
100 % sensitivity
22 polypeptides panel 73% specificity
and
Translationa
lMedicine
2014,
3
:7
Page
15
of
22
d.com/con
additional discriminatory panels (e.g. non-malignant dis-ease vs. urothelial carcinoma) can incrdis-ease the specificity level [93]. In a second study, a 4 polypeptides panel (fragments of membrane associated progesterone recep-tor component I, uromodulin, collagenα-1 (I), Collagen α-1 (III)) was reported by Schiffer et al. and enabled de-tection of MIBC with sensitivity of 81%. However, lim-ited specificity was obtained (57%) [92]. Along the same avenue of research, reanalysis of existing and newly col-lected BCa peptidomics data is currently under investi-gation in our lab (n = 608 samples, 304 controls and 304 BCa patients). Several of previously detected peptides were confirmed as well as novel potential biomarkers were reported [95]. These data are currently rigorously verified in large, prospectively collected cohorts in the EU-funded BCMolMed (www.bcmolmed.org) project.
To summarize, the number of detected biomarker can-didates depends on utilized analytical platform at bio-marker discovery stage e.g. 2-DE enables identification of over a dozen candidates, whereas this values can in-creased up to hundreds for MS-based approaches. In most cases immune-based assays were used to verify presence of selected protein. Only for the peptidomics markers, CE-MS was applied for all phases. However, in most cases only initial verification of detected biomarkers was conducted, but appropriate vigorous validation in a sufficiently large population is still outstanding. Therefore, in order to establish robust and accurate biomarker/panel of biomarkers, further validation has to be performed, driven by the clearly defined context of use and cohorts representing the targeted population. Also, apart from the peptidomics studies, only single proteins were used to evaluate the diagnostic accuracy, whereas a combination of biomarkers candidates may lead to substantial improve-ment of biomarker performance.
Conclusions
Cancer is considered as a disease with high heterogen-eity, increased incidence and mortality rates with a ser-ious social and economic burden. The benefits from application of robust and accurate biomarkers in cancer management might result in significant improvement of clinical outcome via detection of cancer at early stages. An improvement in the therapeutic strategies based on the prognosis of the treatment response is also antici-pated [192]. Multiple advances have been achieved re-garding the proteomic technology that can be applied in major parts of the biomarker development: identifica-tion, verification and validation. Along the way of recent achievements in untargeted MS-based proteomic ap-proaches, as well as targeted quantification proteomic strategies, the number of potential proteomic biomarkers has rapidly increased, as also indicated by the biomarkers candidates related to BCa summarized in this article
[193-196]. However, this apparent progress has not trig-gered successful implementation of novel biomarkers into clinical practice. Therefore, as pinpointed above, critical issues related to biomarker development should be taken into account to raise the awareness about difficulties en-countered in the process. Shortcomings hampering the biomarker implementation include difficulties related to the definition of context of use, proper study design (selection of patients, statistical design), samples avail-ability along with poor clinical characteristics, high sampling variability due to the lack of application of standardized protocol as well as the application of in-appropriate statistics. Clinical implementation of bio-markers is complex and requires collaborative efforts between researchers from different fields and clinicians. In order to facilitate the translation into clinical utility and benefit for patients, various guidelines have been established to guide scientists in this endeavor [11,197]. Based on the literature published, it appears that nu-merous proteomic biomarkers do exist that will likely re-sult in a substantial improvement of the current clinical situation [193,194,198].
is currently been implemented in a Multicentric European Trial, called PRIORITY where 3280 patients with diabetes type 2 are employed.
Another CE-MS derived peptide biomarker approach with increased potential to be implemented as a routine test for diagnosis of cholangiocarcinoma (CC) has been also described [203]. Due to the demanding clinical need for early detection of cholangiocarcinoma that in-creases the curative potential of a therapeutic treatment, Lankisch et al. [203] first proposed a peptide classifier as established by interpretation of CE-MS data derived from bile proteomic analysis [203]. Two models were presented enable to distinquish between patients with choledocholithiasis and malignant lesions as well as be-tween cholangiocarcinoma and primary sclerosing cholan-gitis (PSC), a risk factor for cholangiocarcinoma. After independent validation, the first model was found able to distinguish between patients with gallstones and malig-nant lesions with sensitivity of 93% and specificity of 86%, while the second model classified PSC cases and CC cases with a sensitivity of 84% and specificity of 78%. Following a similar approach, Metzger et al. [204] introduced a urin-ary based peptide classifier in a follow up study, where the specific aim was the investigation of a non-invasive urin-ary test for early diagnosis of cholangiocarcinoma. In this case, an AUC value of 0,87 was reported with 83% sensi-tivity and 79% specificity, after validation in a cohort of 123 patients [204].
Based on the literature available, it appears that clinic-ally useful proteomic biomarkers can be identified, and also validated, employing the technologies available today. Hence, unravelling this potential benefit would “only”require analysis of a sufficient number of samples using appropriate technologies. Assuming the availability of the required funds, the only limitation is the availabil-ity of samples. This major problem has not successfully been tackled by the generation of biobanks, these gener-ally do not proved the support anticipated [197].
However, as recently also suggested Vlahou [17], com-bining efforts and testing multiple biomarkers in the same samples may be the most promising approach. An-other hurdle in bringing the benefits to the patients ap-parently are the requirements by regulatory agencies, and cost as well as the reluctance of the public health systems to accept novel and beneficial approaches in medicine. Here, initiative from the relevant clinical pro-fessional societies and patients groups may be needed in combination with simplification and improvements of regulatory requirements, to enable timely implementa-tion of highly beneficial developments to improve medi-cine and patient care.
Abbreviations
2-DE:Two dimensional gel electrophoresis; ACM: Antibody colocalization microarray; AUC: Area under the curve; BCa: Bladder Cancer;
CC: Cholangiocarcinoma; CE: Capillary Electrophoresis; CKD: Chronic kidney disease; CV: Coefficient of variation; DIGE: Difference gel electrophoresis; ELISA: Enzymed- linked Immunosorbent assay; ESI: Electrospray ionization; FDA: U.S. Food and Drug Administration; iCAT: Isotope- coded affinity tag; IEF: Isoelectric focusing; IMAC: Immobilized metal affinity chromatography; IPG: Immobilized pH gradient; iTRAQ: Isobaric Tag for relative and absolute quantification; LC: Liquid chromatography; LIMS: Laboratory informatics management applications; LOQ: Limit of quantification; MALDI: Matrix-assisted laser/desorption ionization; MIBC: Muscle invasive bladder cancer; MS: Mass spectrometry; MS/MS: Tandem mass spectrometry; NMIBC: Non-muscle invasive bladder cancer; NPV: Negative predictive value; PPV: Positive predictive value; PSC: Primary sclerosing cholangitis; QTOF: Quadrupole time-of-flight mass spectrometer; SILAC: Stable isotope labeling by amino acids in cell culture; SID: Stable isotope dilution; SISCAPA: Stable Isotope Standards and Capture by Anti-Peptide Antibodies; SRM/MRM: Single/Multiple reaction Monitoring.
Competing interests
Maria Frantzi and Akshay Bhat are employed by Mosaiques Diagnostics.
Authors’contributions
MF, AL and AB performed the literature review and contribute equally to the drafting of the manuscript. All authors read and approved the final manuscript.
Authors’information
All the authors namely MF, AB, AL are a PhD students involved in the European BCMolMed program (www.bcmolmed.org). The major goals of the project are identification of novel biomarkers related to bladder cancer invasion, verification of existing biomarkers as well as integration of data using system biology approach.
Acknowledgements
The work was supported by grant 317450PITN-GA-2012-31750BCMolMed (Molecular Medicine for Bladder Cancer) from the FP7–PEOPLE–2012– ITN program.
Author details 1
Mosaiques Diagnostics GmbH, Mellendorfer Strasse 7-9, D-30625 Hannover, Germany.2Biotechnology Division, Biomedical Research Foundation Academy of Athens, Soranou Ephessiou 4, 115 27 Athens, Greece. 3Charité-Universitätsmedizin Berlin, Berlin, Germany.
Received: 20 November 2013 Accepted: 6 March 2014 Published: 29 March 2014
References
1. Ferlay J, Shin HR, Bray F, Forman D, Mathers C, Parkin DM:Estimates of worldwide burden of cancer in 2008: GLOBOCAN 2008.Int J Cancer J Int Cancer2010,127:2893–2917.
2. Kulasingam V, Diamandis EP:Strategies for discovering novel cancer biomarkers through utilization of emerging technologies.Nat Clin Prac Oncol2008,5:588–599.
3. Frantzi M, Makridakis M, Vlahou A:Biomarkers for bladder cancer aggressiveness.Curr Opin Urol2012,5:390–396.
4. Fertig EJ, Slebos R, Chung CH:Application of genomic and proteomic technologies in biomarker discovery.Am Soc Clin Oncol Educ Book/ASCO Am Soc Clin Oncol Meet2012,32:377–382.
5. Gupta S, Venkatesh A, Ray S, Srivastava S:Challenges and prospects for biomarker research: a current perspective from the developing world. Biochim Biophys Acta. in press.
6. Henley SJ, King JB, German RR, Richardson LC, Plescia M, Centers for Disease C, Prevention:Surveillance of screening-detected cancers (colon and rectum, breast, and cervix) - United States, 2004–2006.Morb Mortal Wkly Rep Surveill Summ2010,59:1–25.
7. Iuga C, Seicean A, Iancu C, Buiga R, Kumar Sappa P, Volker U, Hammer E: Proteomic identification of potential prognostic biomarkers in resectable pancreatic ductal adenocarcinoma.Proteomics. in press.