ORIGINAL PAPER
The study of the possibility of switching driving side in Rwanda
Md Mahabubul Bari
Received: 18 July 2013 / Accepted: 13 July 2014 / Published online: 29 July 2014 #The Author(s) 2014. This article is published with open access at SpringerLink.com
Abstract Harmonisation of driving laws of Rwanda with the surrounding East Africa Community (EAC) countries, which mostly drive on the left-hand side of the road, would lead to improved links between these strategic trading partners. A study to assess techno-economic viability of switching drive side from the right to left was therefore undertaken during February to August, 2009. A bottom-up approach involving wide ranging public consultation at each stage was employed. Two alternative scenarios, (i) a Do Nothing (DN) option, i.e. continue to drive as it is in the right hand side and a Do Something (DS) option, which means switching driving side from right to left were developed for an evaluation period of 20 years. All of the foregoing factors (vehicle demand projection, cost of vehicle purchase and maintenance, accidents, business interests be-tween Rwanda, EAC and Common Market of East and Southern Africa (COMESA) countries and other neighbours) have been evaluated for the next 20 years for both options, including the financial, economic and safety impacts. According to the study if decision were made to switch despite minor increase in material only damage accidents, overall eco-nomic and financial benefit would be very substantial, which is also supported by the majority of the stakeholders (54 %).
Keywords Driving side . RHD and LHD vehicles . Incremental accidents . Vehicle import and operating costs . Economic integration . Net economic and financial impacts
1 Introduction
Since the ban on importing right-hand drive (RHD) vehicles was imposed in 2005, the costs of vehicle purchase and
maintenance in Rwanda have increased. This is apparently because of the fact that Japanese second hand vehicles, which are mostly right-hand drive and constitute the largest percent-age of car imports (64 %) in Rwanda, are significantly cheaper than European left-hand drive (LHD) vehicles [18]. Apart from the Democratic Republic of Congo (DRC) and Burundi, Rwanda’s key neighbouring countries, i.e. Uganda, Tanzania and Kenya, which form the majority of the East African Community (EAC), all drive on the left-hand side of the road. Harmonisation of driving laws with the surrounding EAC and other Common Market of East and Southern Africa (COMESA) countries may lead to improved transport links between these strategic trading partners.
Considering issues listed above, the Government of the Republic of Rwanda through the Ministry of Infrastructure (MININFRA), has undertaken a techno-economic feasibility study of the impacts of switching driving side in Rwanda. This paper describes the methodology, findings, conclusions and recommendations of the study.
2 Objectives of the Study
The key objectives of the study are as follows:
(i) To conduct literature review and stakeholder consulta-tions to identify key problems/variables for switching driving side;
(ii) To collect and collate past accident and traffic data, and to conduct additional surveys for the study as per re-quirements of the study;
(iii) To assess the techno-economic and financial feasibility of switching driving side;
(iv) To determine the local, regional and institutional con-straints and operational modalities for switching driving side;
M. M. Bari (*)
(v) To ensure wide-spread public participation in the deci-sion making process for switching driving side; and (vi) To recommend appropriate policy guidance on
switching driving side.
3 Methodology
The study adopted a bottom-up approach. Under the ap-proach, efforts were made to involve general citizens/ stakeholders to participate in every step of the decision mak-ing process of the drivmak-ing side study startmak-ing from the identi-fication of key variables/problems, perception about different impacts, development of alternatives and recommendations for potential solutions. To determine the optimum solution, a Cost-Benefit Analysis (CBA) was undertaken to estimate the equivalent money value of the aggregate benefits and costs to the community of different alternative driving side options. The whole process involves a number of steps under different work packages as follows:
(i) Review of driving laws of Rwanda and neighbouring countries with respect to driving side;
(ii) Identification of relevant attributes/problems related to switching;
(iii) Selection of the portfolio of options;
(iv) Collection of primary and secondary data related to driving side;
(v) Prediction of quantitative impacts over the evaluation period of 20 years;
(vi) Public perception about key variables of switching driving side;
(vii) Monetization (attach monetary values to) all impacts; (viii) Assessment of overall economic and financial impacts; (ix) Identification of the distribution of costs and benefits. (x) Assessment robustness of economic and financial; and (xi) Stakeholder consultation
The methodology for estimating each variable is elaborated under different work packages in the following sections.
4 Work packages for the study
4.1 Review of regulations for driving side in Rwanda and other neighbouring countries
This study conducted a comprehensive review of the existing driving laws, policy and regulatory framework in Rwanda and other neighbouring countries for assessing what would be necessary if decision were made for switching driving side considering legal points of view.
According to a list of which side of the road people drive on around the world, out of 239 countries in the list 164 (68.6 %) countries drive on the right side of the road whereas 75 (31.4 %) countries drive on the left side of the road [13]. Despite overall numerical dominancy of the countries driving on the right hand side of the road in the world, the actual operational and economic advantages of a particular type of vehicle with respect to driving side vary in different regions of the world.
Prior to 2005, Rwandans could import and purchase vehi-cles with steering wheels on either the right or the left. However, the 2005 Presidential decree specified that only left hand drive (LHD) vehicles were permitted to be imported into and purchased in Rwanda, to reduce traffic accidents and improve road safety, particularly with regards to public trans-port [11].
Although road systems in Rwanda and Burundi are de-signed to support driving on the right hand side of the roads, majority of the vehicles in these countries were odd vehicles, i.e. RHD vehicles before 2005. The proportion of RHD vehi-cle in Rwanda prior to imposition of ban was as high as 99 % [18]. Since the ban came into effect in 2005, the proportion of RHD vehicles were plunged from 99 % to a 42 % in 2009 due to combined impacts of import ban and conversion of 15 % of RHD vehicles into LHD. Since there is no restriction on RHD vehicles in Burundi, the majority of vehicles in Burundi are still odd RHD vehicles. The numbers of odd RHD vehicles are also significant in many left hand drive regions, such as Russia and British Columbia in Canada [4]. It is a research issue to investigate why there was overwhelming dominance of odd RHD vehicles in some left hand drive regions, such as Rwanda before the imposition of the import restrictions.
In the East African Community (EAC) most of the eco-nomically dominant countries like Uganda, Tanzania and Kenya drive on the left-hand side of the road. On the other hand, smaller economies like Rwanda and Burundi drive on the right side of the road.
According to Association of Rwanda Forwarders and Clearing Agents, the ban of RHD vehicle had negative effects on the economy and scared investors in the transport sector [12]. Foreign cargo haulers account for over 70% of the total number of trucks (about 5,025) that deliver cargo in the country, partly because they are cheaper to hire. Rwanda is a landlocked country and is totally dependent of the seaports of Kenya and Tanzania for overseas trading. Out of an estimated 1,600 km from Mombasa to Kigali, it is only between Gatuna to Kigali where drivers switch driving sides from left to right for a stretch of 70 km.
laws with the surrounding EAC and other Common Market of East and Southern Africa (COMESA) countries may lead to improved transport links between these strategic trading part-ners. Since its entry in the East African Community (EAC) Rwanda has been on the frontier of adapting to standards of the community, and the country is now considering the shift of traffic rules from the right hand to the left hand drive.
Many countries/territories of the world switched driving side for various reasons including harmonisation transport system with dominant neighbouring countries. Notable among them are Austria, Czechoslovakia, Hungary, Channel Islands, Falkland Islands, Sweden, Nova Scotia, Myanmar, Nigeria and Samoa, etc. The lessons learnt from these coun-tries could be very useful if decision were taken to switch driving side in Rwanda [13].
It appears from the literature review that there are still some knowledge gaps in the key areas of switching driving sides in different parts of the world. Some of crucial areas where further study is needed are as follows:
& Dominance of odd vehicles with respect to driving side in many parts of the world including Rwanda;
& Incremental impacts of accidents for driving odd vehicles with respect to driving side; and
& Public perception about driving an odd vehicle having a steering wheel in opposite side of control.
4.2 Identification of Key variables and development of Dn and Ds scenarios
After conducting the literature review and wide stakeholder consultations, key variables affecting the possibility of switching driving side were identified. The key variables are as follows:
(i) Schedule for switching;
(ii) Interaction between policy variables; (iii) Decay period of odd vehicles; (iv) Vehicle import costs;
(v) Vehicle operating costs; (vi) Demand for vehicle import; (vii) Impacts on road accident (viii) Experience from other countries;
(ix) Public perception about switching driving side; and. (x) Stakeholders’view including drivers, transport
opera-tors, vehicle importers as well as general road users.
In order to assess the potential impacts of switching driving side from right to left, two alternative options were selected for the study after organising two workshops involving gen-eral public and key stakeholders:
(i) A Base Case or Do Nothing (DN) scenario considering the business as usual situation, where existing driving side would remain unchanged; and
(ii) A Do Something (DS) Scenario for switching driving side from right to left.
The main objective of the study was therefore to conduct a techno-economic and financial analysis of the mutually ex-clusive DN and DS options and to recommend appropriate policy directives.
4.3 Data collection
Both primary and secondary information collection exercises were employed for the study. A significant amount of infor-mation for the study was collected from local and international sources, including technical journals, databases of Rwanda Revenue Authority, vehicle importers, insurance companies and other private and public sources. Interviews were employed to obtain primary data from respondents for the study.
4.3.1 Design of questionnaires
Three questionnaires were devised as follows:
i. First questionnaire survey to collect data on vehicle type, characteristics, purchase and operating costs, accident records, and perception about driving side, etc.; ii. Second questionnaire survey at border crossings to
col-lect data on the origin of vehicle registration and steering wheel side for all types of vehicles;
iii. Third questionnaire survey on data related to different accident cost components for different types of accidents in Rwanda, i.e. property damage costs, administrative costs, lost output costs, medical costs, and human costs.
The first questionnaire, involving 1,068 respondents, consisted of questions on a number of key attributes as follows:
& Vehicle type;
& Capacity of vehicle engine (in cubic centimetres); & Vehicle purchase and maintenance costs;
& Driving side;
& Conversion of driving side;
& Opinion on difficulty of driving a RHD vehicle; & Incremental accident due to driving RHD vehicles; and & Whether respondents supported switching driving side or
not, etc.
articulated truck, trailer truck and motorcycle. Since it was necessary to collect representative data from all vehicle clas-ses, a stratified random sampling technique was employed to survey vehicle operators, drivers and importers.
To collect a statistically significant sample from each stratum under a stratified random sampling technique, the sample size for the questionnaire survey was deter-mined as follows [2]:
n≥ Npð1−pÞ N−1
ð Þ Dþpð1−pÞ ð1Þ
Where:
D¼ðConfidence:IntervalÞ
2
Z2
N Sample size
N population size (the size of the population of each strata from which the sample to be selected at random)
P Prior assumption, which is the proportion of respondents one would expect to answer a question a certain way. In this study it represents the proportion of respondents who can answer the questions correctly
Z Area under normal curve corresponding to the desired confidence level (CL).
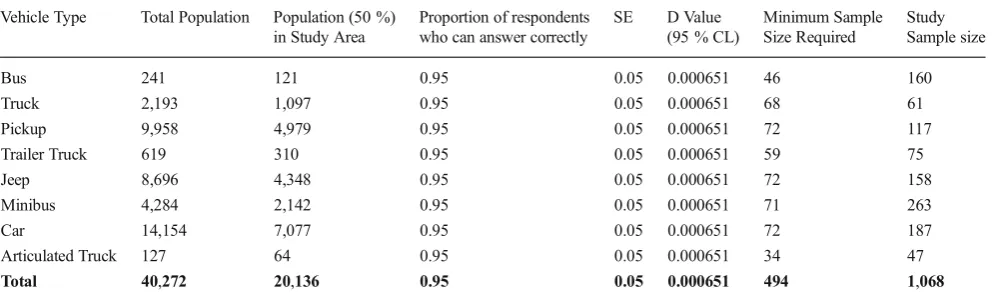
The statistically significant sample sizes for each stratum in accordance with Equation1with 95 % confidence level and assuming 95 % of expected correct responses from the re-spondents are shown in Table1.
The second questionnaire survey was undertaken to ascer-tain the distribution of the origin of vehicle registration and steering wheel side at eight main border crossings of Rwanda. The survey was conducted for 24 h in a typical weekday for each border crossing. A simple random sampling technique
was employed for conducting questionnaire surveys at border crossings. Efforts were made to collect at least 30 random samples from each border crossing to ensure normal distribu-tion of the origin of vehicle registradistribu-tion data. However, due to a lack of sufficient number of vehicles at three border cross-ings during the time of the survey, it was not possible to attain the minimum requirement at these border crossings. The sample sizes for different vehicle types of the questionnaire survey at border crossings are shown in Table2.
In addition, a third questionnaire survey involving 150 respondents was undertaken with vehicle importers, doc-tors, insurance companies and other stakeholders to determine accident costs for different types of accidents. Documentary/database sources were also used, such as local and international surveys, technical journals, and databases of the Rwanda Revenue Authority, vehicle importers, insurance companies and other private and public sources.
Moreover, for determining and quantifying road elements, signs, signals and other road furniture to be adapted for left-hand driving, a survey was undertaken covering 1,172 km of National paved road network and 150 km of paved road network of Kigali City. The survey was conducted by a team of road geometry and traffic engineers using inspection vehi-cles mounted with automatic geometric coordinate and video recording devices. In addition of video and geometric coordi-nate recordings of roadways, the numbers and type of road sign, signal, signal flare or other road furniture to be adapted for left-hand driving were counted using hand-held computers during the survey.
4.4 Vehicle forecasts
4.4.1 Normal vehicle growth under DN scenario
Based on the classified vehicle registration data of the Rwanda Revenue Authority from 2003 to 2008, cumulative number of
Table 1 Study sample sizes for general questionnaire survey
Vehicle Type Total Population Population (50 %) in Study Area
Proportion of respondents who can answer correctly
SE D Value (95 % CL)
Minimum Sample Size Required
Study Sample size
Bus 241 121 0.95 0.05 0.000651 46 160
Truck 2,193 1,097 0.95 0.05 0.000651 68 61
Pickup 9,958 4,979 0.95 0.05 0.000651 72 117
Trailer Truck 619 310 0.95 0.05 0.000651 59 75
Jeep 8,696 4,348 0.95 0.05 0.000651 72 158
Minibus 4,284 2,142 0.95 0.05 0.000651 71 263
Car 14,154 7,077 0.95 0.05 0.000651 72 187
Articulated Truck 127 64 0.95 0.05 0.000651 34 47
vehicles up to 2008 with respect to driving side was obtained [18]. However, this data does not provide any information about the percentage of RHD which were converted into LHD after the Presidential Circular of 2005. The percentage of vehicle conversion data was obtained from the field surveys. The reference year (2009) vehicle level and composition were estimated from cumula-tive vehicle data of 2008 using trend extrapolation of previous vehicle data.
The projections for vehicle levels till the end of the evaluation period of 20 years (2009 to 2028) were estimated using available primary and secondary sources of information. Initial vehicle growth rate for the first 5 years was obtained using trend extrapolation past vehicle data. The vehicle growth rate under long term scenario was obtained from the upper traffic forecast of the Feasibility Study Report of Kigali Urban Road Upgrading Project [3].
Quantifying uncertainties in vehicle growth projections is generally undertaken using detailed local information obtained from appropriate field surveys. Considering the limited scope of the study, it was not necessary to embark on a detailed vehicle demand forecasting exercise. Instead, a Department for Transport [9] recommended approach was employed. The different probabilistic sce-narios for vehicle growth rates used for demand projec-tions are presented in Table3.
4.4.2 Development and calibration of vehicle decay model
In order to predict the number of odd RHD vehicles during evaluation period, it is essential to determine the annual vehi-cle conversion rates. The average weighted conversion rates from RHD to LHD for all types of vehicles from 2005 to 2009 were obtained from the questionnaire survey and vehicle registration database of Rwanda Revenue Authority [18]. The vehicle conversion rates were used to calibrate a logistic decay model. The mode was developed to represent conver-sion process of odd vehicles for 15 years by trial and error method. The logistic vehicle decay model is given by:
Dt¼1
1−aexp−bðN−tÞ
ð Þ−1 ð2Þ
Where:
Dt decay of vehicle number in percentage at a certain time
period,t
N maximum time period for complete elimination
T time period, which varies from 0 to N-1
a b, model parameters.
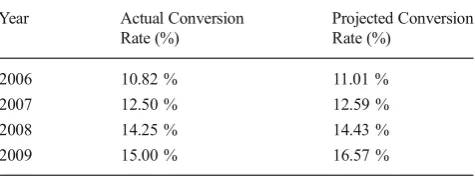
The calibrated model parameters,aandbwere estimated as 0.6 and 0.12 respectively by trial and error method. The actual and the projected conversion rates for RHD vehicles into LHD vehicles from 2006 to 2009 are shown in Table 4. The Goodness of fit between the actual and the modelled conver-sion rates in terms of Adjusted R Square is 0.925. This indicates a strong correlation and hence the adequacy of the logistic delay model (Equation 2) to represent the vehicle conversion process. The calibrated vehicle conversion model is demonstrated in Fig.1.
Since the ban came into effect in 2005, the proportion of RHD vehicles has plunged from 99 % to a 42 % in 2009 due to combined impacts of import ban and conversion of RHD vehicles into LHD.
4.4.3 Vehicle import costs
In economics, the law of demand states that, all else being equal, as the price of a product increases quantity demanded falls; likewise, as the price of a product decreases, quantity Table 2 Sample sizes for questionnaire survey at border crossings
Name of Border Crossing Minimum Sample Size Required
Study Sample Size
AKANYARU 30 17
CYANIKA 30 29
GATUNA 30 40
KAGITUMBA 30 30
NEMBA 30 31
RUBAVU 30 50
RUSIZI 30 54
RUSUMO 30 28
Total 240 279
Table 3 Vehicle growth rates under different probabilistic scenarios
Year Vehicle Growth Rate (%)
Normal Optimistic Pessimistic
2009–2013 7.20 % 12.20 % 2.20 %
2014–2018 6.90 % 14.40 % −0.60 %
2019–2023 6.20 % 15.88 % −3.48 %
2024–2028 6.10 % 17.00 % −4.80 %
Table 4 Actual and Projected Conversion Rates of Odd RHD Vehicles from 2006 to 2009
Year Actual Conversion
Rate (%)
Projected Conversion Rate (%)
2006 10.82 % 11.01 %
2007 12.50 % 12.59 %
2008 14.25 % 14.43 %
demanded increases [14]. Since average import cost of RHD vehicle in Rwanda is generally lower [18], it is likely that some additional vehicle will be imported under a DS Scenario. In order to determine the additional or generated vehi-cles, costs for different categories of vehicle were collect-ed by conducting a questionnaire survey of the vehicle importers, operators and drivers. The vast majority (91 %) of imported vehicles are second-hand and almost three quarters (74 %) of all imported vehicles are more than 10 years old as shown in the vehicle age distribution in Fig.2. In order to obtain representative prices of imported vehicles under different categories, a weighted average price for both LHD and RHD vehicles under a particular category was estimated on the basis of mean vehicle
import price with respect to each age category, multiplied by the corresponding percentage of age distribution, and finally added them together for all age groups.
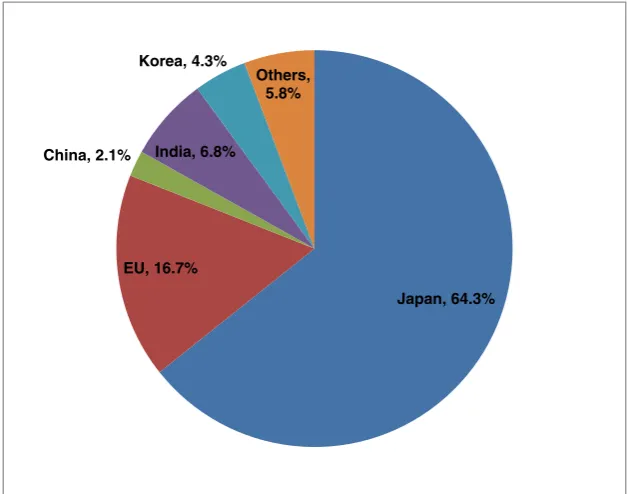
It is evident that the average purchase cost of RHD vehicles is 16.34 to 48.69 % lower than LHD as shown in Table5. This might be because of the vast majority of imported vehicles (64.3 %) are second hand RHD Japanese vehicles as illustrat-ed in Fig.3. The market share of Indian RHD vehicles is only at 6.8 %. The combined market share of vehicles of Japanese and Indian vehicles is 71.1 %, which far higher than the EU, which has a 16.7 % market share. It was observed from the database of Rwanda Revenue authority that second hand European vehicles are significantly more expensive than Japanese or Indian vehicles of similar age [18].
0.00% 20.00% 40.00% 60.00% 80.00% 100.00% 120.00%
0 2 4 6 8 10 12 14 16
%
T
raffic
Remaining
after
Sw
itching Dr
iving
si
de
Year
Traffic Decay
Fig. 1 Calibrated Vehicle Decay Model for Rwanda
Brand New, 8.99%
1 to 2 yrs,
6.22% 3 to 5 yrs, 2.65%
6 to 10 yrs, 8.38%
11 to 15 yrs, 37.48% 16 to 20 yrs,
34.40%
More than 20 yrs, 1.88%
4.4.4 Vehicle operating costs
The vehicle operating cost data was collected as a part of the 1st Questionnaire survey involving 1,068 respondents. All the relevant key attributes for the vehicle operating costs were collected, as follows:
& Vehicle type;
& Capacity of vehicle engine (in cubic centimetres); & Driving side;
& Age of Vehicle;
& Fuel Consumption cost per month; & Lubricant consumption cost per year;
& Spare parts and tyre consumption cost per year; & Other maintenance cost per year;
& Vehicle import cost;
& Average service life and salvage value (for determination of Depreciation cost per year).
The research in this study shows that total vehicle operating and maintenance costs of the whole spectrum of RHD vehicles are 5.5 % to 38.5 % cheaper than comparative LHD vehicles as illustrated in Table 6. It appears from the questionnaire survey that Japanese vehi-cles, which are available in Rwanda, are generally more fuel efficient and cheaper spare parts for these vehicles are more readily available in the EAC region.
4.4.5 Impacts on demand for vehicle import
Price elasticity of demand (PED or Ed) is a measure used in economics to show the responsiveness, or elasticity, of the quantity demanded of a good or service to a change in its price [14]. Given the significantly lower costs associated with RHD vehicles, some generated demand for RHD vehicles is expect-ed under the DS scenario in accordance with the price elastic-ity of demand. The projected generated vehicle demand for Table 5 Weighted mean
finan-cial import costs of different cat-egories of LHD and RHD vehi-cles in Rwanda in 2009
Vehicle Type LHD (in USD) RHD (in USD) Difference (in USD) % Difference
Car 7,337 5,602 1,735 23.65 %
Pick up 13,279 11,021 2,258 17.01 %
Jeep 34,553 18,375 16,177 46.82 %
Minibus 21,178 14,633 6,545 30.91 %
Bus 53,071 27,232 25,839 48.69 %
2-Axle Truck 55,737 28,638 27,099 48.62 %
3-Axle Truck 59,638 49,891 9,748 16.34 %
Trailer 42,310 33,848 8,462 20.00 %
Trailer Truck 63,425 51,149 12,276 19.35 %
Japan, 64.3% EU, 16.7%
China, 2.1% India, 6.8%
Korea, 4.3%
Others, 5.8%
each vehicle class was obtained for the evaluation period (2009 to 2028) using vehicle price elasticity of demand of
−0.3 [19,5]. The overall number and composition vehicles under normal growth for both DN and DS scenarios will be 181,554 and the generated vehicles for the DS scenario during the evaluation period will be 29,463, which represent an additional 16 % increase as demonstrated in Table7.
4.5 Prediction of road accidents under different scenarios
4.5.1 Prediction of normal accident growth in Rwanda
To predict normal accident growth during the evaluation period (2009 to 2028), the study collected the number, type and severity of accidents from 2002 to 2008 in Rwanda from the accident database of Rwanda National Police [16]. In total data for four types of accident from two main categories were collected as, follows:
i. Property Damage only accident:
& Minor (accidents on public roads involving at least one vehicle and resulting in material damage only without any human injury or death with a value of less than or equal to USD 100);
& Major (accidents on public roads involving at least one vehicle and resulting in material damage only without any human injury or death with a value of more than USD 100);
ii.Personal Injury accident:
& Injury (accidents on public roads involving at least one vehicle and resulting in human injury);
& Fatal (accidents on public roads involving at least one vehicle and resulting in human death);
The annual statistics of road accidents in Rwanda from 2002 to 2008 are shown Table8.
On the basis of past accident data, the changes in accident rates for different types of accidents were estimated employing an empirical formula as follows [6].
AN¼ A0xβN ð3Þ
Where:
AN the accident rate or number of casualties per accident N years after base year
A0 the accident rate or number of casualties per accident in the base year
Table 6 Comparison of monthly vehicle operating costs between lhd and rhd vehicles in rwanda
Type of Vehicle % Difference between LHD and RHD
Monthly Fuel Consumption (Litre)
Monthly Fuel and Lubricant Cost (USD)
Monthly Repair and Maintenance Cost (USD)
Monthly Total Vehicle Operating and Maintenance Cost (USD)
CAR −8.3 % −40.2 % −32.5 % −38.5 %
PICK-UP 14.9 % 39.6 % −65.5 % −31.7 %
JEEP 9.2 % −2.8 % −16.0 % −5.5 %
MINIBUS 27.5 % −24.1 % −3.9 % −22.7 %
BUS 0.0 % 0.0 % 0.0 % 0.0 %
2 AXLE TRUCK −5.1 % −28.6 % −0.9 % −21.3 %
3 AXLE TRUCK −4.6 % −17.2 % 1.4 % −15.2 %
ARTICULATED TRUCK 0.0 % 0.0 % 0.0 % 0.0 %
TRAILER TRUCK 0.0 % 0.0 % 0.0 % 0.0 %
Table 7 Normal and generated vehicle under ds scenario
Year Normal Vehicles Generated Vehicles Normal+Generated Vehicles % of Odd LHD
vehicles
LHD RHD LHD RHD LHD RHD Total
2009 31,506 22,711 0 5,236 31,506 27,947 59,453 52.99 %
2013 15,544 56,057 0 9,109 15,544 65,166 80,710 19.26 %
2018 3,329 96,626 0 15,683 3,329 112,309 115,639 2.88 %
2023 12 135,018 0 21,911 12 156,928 156,940 0.01 %
βN
accident change rate coefficient raised to the power N (the number of years after the base year).
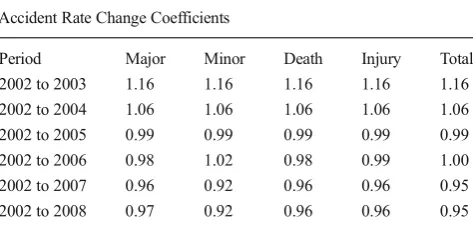
The accident change rate coefficients,βfor different type of accidents were estimated using accident data for 2002 to 2008. The average accident change rate coefficients,βover the period of 2002 to 2008 were employed for the prediction of different types of normal accidents over the evaluation of period of 2009 to 2028. The values of change rate coefficients for different types of accidents are shown in Table9.
4.5.2 Prediction of incremental impacts of driving side on road accidents in the world
Despite imposition of ban on importation of RHD vehicle in Rwanda in 2005, a significant portion of vehicles are RHD, representing 42 % of the vehicle fleet in 2009. These odd vehicles pose significant safety risks. However, the accident records currently available in Rwanda do not provide infor-mation on accidents potentially caused by RHD vehicles. Globally, very few studies have been conducted to address safety issues related to driving with opposite-side controls. Notable among them are:
(i) Study on safety of RHD vehicles in British Columbia, Canada [4];
(ii) Dangers and Solutions of LHD HGVs in the UK, [17].
Study on safety of RHD vehicles in British Columbia, Canada Out of the two studies, the study conducted in British Columbia is very comprehensive in dealing with po-tential accident implications related to driving with opposite side controls and vehicle age. Both in British Columbia and Rwanda the road infrastructures are designed and built for LHD vehicles but there are significant numbers of RHD vehicles operating in the road network. Considering the strik-ing similarity between operational conditions, as far as drivstrik-ing side is concerned and proliferation of relatively cheaper Japanese second vehicles in both the cases, it might be appro-priate to employ findings of the study to project incremental accident implications of driving older vehicles with opposite side controls on road accidents in Rwanda. The design of this study included three separate methodologies to assess safety risks of RHD vehicles. The methodologies included: (1) a relative risk comparison of culpability for crashes of individual drivers for RHD vs. LHD vehicles; (2) sur-vival analysis to determine if an increased risk was associated with the early driving periods for RHD vs. LHD vehicles; (3) Poisson regression analysis to com-pare RHD driver risk to a LHD driver control group. In addition to estimation of vehicle crash involvement risk, com-parison of crash severity for RHD and LHD vehicles was undertaken as part of the first, i.e. a relative risk comparison of culpability for crashes and the third methodology, i.e. Poisson regression analysis.
It appears from the comparative analysis of the results from three different approaches that the results were consistent and very similar.
Considering the conclusive evidences from the results of the British Columbia study and the similarity between existing driving environment of British Columbia and Rwanda, it was decided to adopt the same 37 % incremental impact of driving RHD vehicles on material damage only accidents, as obtained from Poisson Regression analysis, for Rwanda. Since there was no statistically significant increase in severity of accident in British Columbia due to driving with opposite control, no increase in rate of injury or death was assumed in Rwanda as well.
Table 8 Annual statistics of road accidents in rwanda (Source: [16])
Accident type/Time Period (year)
Property Damage only accident Personal Injury accident Total
Major Minor Fatal Injury
2002 908 2,470 371 3,014 6,763
2003 1,056 2,873 431 3,505 7,865
2004 1,023 2,785 418 3,398 7,625
2005 873 2,375 357 2,898 6,502
2006 848 2,720 347 2,911 6,826
2007 755 1,643 308 2,412 5,118
2008 738 1,529 299 2,317 4,883
Table 9 Accident rate change coefficient for different types of accidents
Accident Rate Change Coefficients
Period Major Minor Death Injury Total
2002 to 2003 1.16 1.16 1.16 1.16 1.16
2002 to 2004 1.06 1.06 1.06 1.06 1.06
2002 to 2005 0.99 0.99 0.99 0.99 0.99
2002 to 2006 0.98 1.02 0.98 0.99 1.00
2002 to 2007 0.96 0.92 0.96 0.96 0.95
Accident analysis for LHD HGVs in the UKAlthough British Columbia study conducted a comprehensive study on incre-mental impact of driving with opposite side control, the study did not provide adequate clue about different vehicle category specific risk. This is particularly relevant for HGV’s, which tend to have a far higher risk of turning and weaving colli-sions. The impact of the latter situation was ascertained from the reported UK crash statistics [8] which clearly point to an increased risk of turning and weaving collision involvements for LHD vehicles in the RHD environment.
In order to assess the overall incremental accident risks of LHD HGV’s while driving in the RHD environment in Great Britain, a relative risk analysis in terms of Odds Ratio Analysis was undertaken with respect to relative annual vehicle-km driven by UK registered HGV’s as against foreign registered HGV’s, number of reported road accidents involv-ing (i) at least one heavy goods vehicle and (ii) at least one foreign registered heavy goods vehicle in Great Britain in a typical year. The relevant tonne-kilometres and vehicle-kilometres data for UK registered as well as foreign registered vehicles were derived from DfT Road Freight Statistics [7] as revised in 2008 [10], and corresponding accident data for HGV’s during 2005 to 2007 were collected from DfT’s annual publication‘Road Casualties Great Britain’ in from [6] to 2008. The Odds Ratios, which are equivalent to relative risks, for personal injury accidents of LHD HGV’s while driving in left side in the UK were estimated in relation to proportional annual vehicle-km driven. The average Odds Ratios for slight injury, serious injury and fatal accidents for LHD HGV’s during 2005 to 2007 were 1.69, 1.16 and 1.10 respectively. This implies that the LHD HGV’s were 69 %, 16 % and 10 % more at risk of participating a slight injury, serious injury and a fatal accident respectively than RHD HGV’s in the UK. The weighted average Odds Ratio for personal injury accident was 1.61 indicating that relative risk of driving LHD HGV’s having opposite steering wheel control was 61 % higher in comparison to RHD HGV’s in the UK. The same relative incremental risks for personal injury (+61 %) and fatal (+ 10 %) accidents were adopted in the present study for deter-mination of accident impacts of HGV’s, having opposite-side steering wheel control, in Rwanda.
4.5.3 Public perception about impacts of driving side on difficulty in driving and road accidents in Rwanda
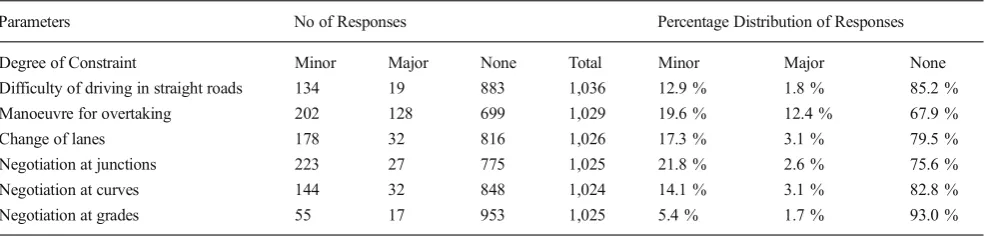
Perception about difficulty in driving As a part of the First questionnaire survey, drivers’perceptions about difficulty in driving with RHD vehicles were collected from direct interviewing. When asked their opinion regarding the most likely constraints a driver would face while driving a RHD vehicle in the LHD traffic system of Rwanda, the overwhelm-ing majority (67.9 % to 93.0 %) did not consider it to consti-tute a problem for any major driving manoeuvres as demon-strated in Table10.
Perception about traffic accidents Drivers’ perceptions about incremental impacts of driving on the right-hand side of a road with a RHD vehicle in Rwanda were generally consistent with findings on other international studies, notably the study on safety of RHD vehicle in British Columbia. The vast majority of respondents (68.4 %) think the incremental impact of driving a RHD vehicle in Rwanda is less than 5 %. Although the ques-tionnaire survey did not distinguish between material damage only and personal injury accident, it demonstrates overall incremental accidents, according to public percep-tion, are low (less than 5 %) as shown in Table11and the range is likely to remain within 5 to 40 % similar to that of the British Columbia study.
4.5.4 Results of incremental accidents for Odd vehicles
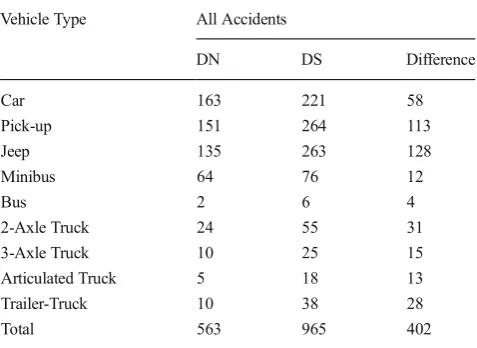
It appears from the results of accident analysis that all types of accidents increased under DS scenario. This is because it has 54 % more odd vehicles in comparison to DN scenario. It is evident that under DS scenario, there would be a net increase of 402 numbers of all type of accidents added together as demonstrated in Table 12. It may be mentioned here that increase of accidents for both DN and DS scenarios due to odd vehicles appear to be marginal in a period spanning over 20 years during the evaluation period. The increase in acci-dents would likely to be limited to minor and material damage only accident category.
Table 10 Drivers’perception about constraints of driving rhd vehicles in rwanda
Parameters No of Responses Percentage Distribution of Responses
Degree of Constraint Minor Major None Total Minor Major None
Difficulty of driving in straight roads 134 19 883 1,036 12.9 % 1.8 % 85.2 %
Manoeuvre for overtaking 202 128 699 1,029 19.6 % 12.4 % 67.9 %
Change of lanes 178 32 816 1,026 17.3 % 3.1 % 79.5 %
Negotiation at junctions 223 27 775 1,025 21.8 % 2.6 % 75.6 %
Negotiation at curves 144 32 848 1,024 14.1 % 3.1 % 82.8 %
4.6 Evaluation of monetary costs of accidents
The cost of accidents can be evaluated in general in three different ways:
(i) Willingness-to-pay (WTP) (ii) Value of a life year (VOLY)
(iii) Gross Output or Human Capital Method.
The main advantage of Human Capital Method lies in its simple and transparent calculation concept. Considering this advantage and relative ease of application, the human capital method similar to that of the Accident Cost Study of Cambodia [1] was adopted and used to determine the different components of costs of road accidents in this study, as follows:
(i) property damage; (ii) administration costs; (iii) costs of medical services; (iv) output lost; and
(v) human costs, such as pain, grief, and suffering.
The different elements of the accident costs were collected from the questionnaire survey. On the basis of Human Capital
Method, the total accident costs were USD 9,379 for a fatal casualty and USD 4,175 for an injured casualty. The corre-sponding figures for major and minor material damage were USD 268 and USD 86 respectively.
4.7 Determination of different monetary costs and benefits for alternative scenarios
4.7.1 Benefits at border crossings and competitiveness of Rwandan transporters
Travel time benefits From the survey data collected at border crossings, two thirds of all 279 vehicles (65.9 %) were RHD. In the case of Rwandan vehicles, barring exceptions at Gatuna and Kagitumba, the majority (57.6 %) of the vehicles were RHD indicating potentials for time savings if EAC economic and custom integration continues.
Assuming a 5 min time saving per vehicle for not changing road driving lane in the case of EAC custom integration, the net economic benefit over the evaluation of period due to time saving will be USD 0.68 million, which is 32 % more than that of the projected benefit of DN scenario.
Competitiveness of Rwandan transporters for international shipment of goods According to the vehicle registration sur-veys at border crossings, in comparison to the number of foreign transporters (mainly from Uganda, Kenya and Tanzania which generally use RHD vehicles) the proportion of Rwandan transporters is relatively low. The surveys at border crossings found that 72.5 % of the vehicles transporting goods and passengers at border crossing were foreign-registered vehicles and 69 % of them were RHD vehicles.
Additionally, the shares of import, export and re-export of goods transported by Rwandan vehicles in 2006 were 40 %, 38 % and 22 % respectively, indicat-ing dominance of foreign registered and predominantly RHD vehicles in regional transportation of goods [15]. Since the bulk of trade is destined for the ports of Dar es Salaam and Mombasa, it would be advantageous to employ RHD vehicles to encourage international trading.
Table 11 Drivers’perception about incremental impacts on accidents for driving a rhd vehicle in Rwanda
Accident rate Percentage of Responses Accident rate Percentage of Responses Accident rate Percentage of Responses
< 5 % 68.4 % 6–10 % 18.8 % 11–15 % 3.7 %
16–20 % 3.3 % 21–30 % 1.2 % 31–40 % 1.3 %
41–50 % 1.0 % 51–60 % 0.6 % 61–70 % 0.5 %
71–80 % 0.4 % 81–90 % 0.3 % 91–100 % 0.5 %
101–200 % 0.0 % 201–300 % 0.0 % > 300 % 0.2 %
Table 12 Incremental impacts of odd vehicles on all types of road accidents (During 2009 to 2028)
Vehicle Type All Accidents
DN DS Difference
Car 163 221 58
Pick-up 151 264 113
Jeep 135 263 128
Minibus 64 76 12
Bus 2 6 4
2-Axle Truck 24 55 31
3-Axle Truck 10 25 15
Articulated Truck 5 18 13
Trailer-Truck 10 38 28
4.8 Assessment of overall techno-economic viability for switching driving side with respect to economic profit-ability indicators
4.8.1 Economic evaluation
The cost and benefit streams for each alternative under the DN scenario were calculated for each year of the evaluation peri-od. An economic appraisal has been carried out for each of the cost components separately as well as for all the attributes taken together. On the basis of this, it is evident that despite some minor and temporary drawbacks attributed to accident, conversion and signage costs, switching driving side from right to left in Rwanda is highly profitable with a net economic benefit in terms of Net Present Value (NPV) is USD 2.9 billion (12 % discount rate) over the evaluation period (2009 to 2028) as shown in Table13.
4.8.2 Sensitivity analysis
One of the crucial determinants of economic viability of the switching option is estimation of relative costs and benefits between DN and DS scenarios. It is in this context, an attempt has been made to assess the extent of impact of variations in costs and benefits of DN option in relation to DS option for the economic viability of the switching driving side option (DS). To this end, the following sensitivity scenarios were consid-ered on the basis of a preliminary sensitivity analysis:
(A) 15 % increase in the cost and 15 % decrease of benefit attributes of the DS option;
(B) 15 % decrease in the cost and 15 % increase of benefit attributes of the DN option;
(C) (A) and (B) taken together;
(D) 20 % increase in the cost and 20 % decrease of benefit attributes of the DS;
(E) 20 % decrease in the cost and 20 % increase of benefit attributes of the DN option;
(F) (D) and (E) taken together;
Results of the sensitivity analysis indicate that the DS option, i.e. switching driving side is economically viable satisfying almost all of the tests. However, in the case of the Test F when Test-D and Test-E were taken together, the Net Present Value (NPV) for the DS or switching driving becomes negative. It is therefore apparent that the economic viability of
the DS or switching driving side option is very robust with considerably high variations of relative costs and benefits between of DN and DS options.
In addition, sensitivity analysis was carried out for pessi-mistic and optipessi-mistic vehicle growth scenarios as defined in Table 3. It appears from the analysis that although under pessimistic growth scenario, net benefits in term of NPV reduced by 55 %, overall benefit still remains positive, which is equivalent to USD 1.28 billion. Under optimistic growth scenario, the NPV increased up to 140 % indicating robustness of the economic viability of the DS or switching option in comparison to that of the business as usual or DN scenario.
4.9 Assessment of financial impacts of switching driving side
4.9.1 Impact on government revenue
Import duties Since the import costs of RHD vehicles are between 17 and 49 % less than LHD vehicles, the Government will lose a substantial amount of revenue on vehicle imports, in the region of USD 88.99 million (16 % of the total import revenue under DN option during the evaluation period 2009 to 2028) under the DS option.
Fuel levies Although some vehicle import revenues under DS scenario would be lost, this is far outweighed by additional net cash revenue the Government would earn of around USD 582.59 million from fuel levies, which is about 20 % higher than the total tax revenue from fuel levies under DN scenario due to a 16 % increase in the total number of vehicles under the DS option.
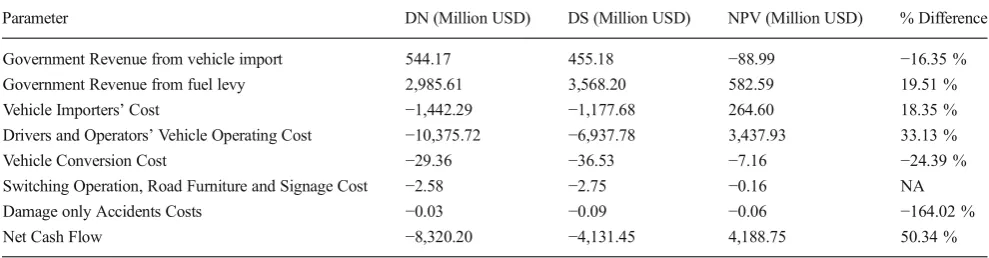
4.9.2 Overall financial impacts
The results of the financial analysis are shown in Table14. Under DS scenario, the overall financial gains for Rwanda would be positive and net cash flow could be as high as USD 4.2 billion during the appraisal period, which about 50 % higher than that under DN scenario.
Impact on stakeholders The overall net cash flow for stake-holders, including vehicle importers, users, private sector and Government; will be positive if the driving side is changed. The net cash flows accrued from vehicle import, operating and conversion costs will be positive, to the tune of around USD 264.60 million, USD 3,427.93, and 27.63 million
Table 13 Economic indicator in NPV of switching driving side in 2009 price and 12 % discount rate (Million USD)
Vehicle Import
Vehicle Operating and Maintenance Cost
Vehicle Conversion Cost
Benefit at Border Crossings
Accident Cost
Road Furniture & Signage
Total
respectively. The results of the financial analysis therefore demonstrate substantial financial gains for stakeholders in-cluding vehicle operators and users.
4.10 Stakeholder consultation
A comprehensive questionnaire/behavioural survey to solicit the perceptions and opinions of stakeholders regarding the potential impacts of switching driving side were undertaken. Under the bottom-up and participatory approach, five stake-holder consultation workshops were held to involve general citizens/stakeholders to participate in every step of the deci-sion making process, starting from the project initiation, de-velopment of methodology, collection and analysis of data and validation of results. Although public opinion on switching driving side was mixed, a clear majority (54 %) still favoured switching from left to right, where 32 % were against
and the remainder remaining were undecided or ambivalent as illustrated in Fig. 4. It appears that public perceptions and opinions coincide with the findings of the study.
5 Conclusions and recommendations 5.1 Conclusions
The key conclusions of the study are as follows:
(i) Despite the fact that road infrastructure and transport regulations in Rwanda are designed for LHD vehicles, the study demonstrated that RHD vehicles have clear operational and financial advantages. This also explains the reasons for the dominance of RHD vehicles (99 %) Table 14 Discounted (12 %) net cash flow projections for both dm and ds scenarios at 2009 price for the evaluation period (2009–2028)
Parameter DN (Million USD) DS (Million USD) NPV (Million USD) % Difference
Government Revenue from vehicle import 544.17 455.18 −88.99 −16.35 %
Government Revenue from fuel levy 2,985.61 3,568.20 582.59 19.51 %
Vehicle Importers’Cost −1,442.29 −1,177.68 264.60 18.35 %
Drivers and Operators’Vehicle Operating Cost −10,375.72 −6,937.78 3,437.93 33.13 %
Vehicle Conversion Cost −29.36 −36.53 −7.16 −24.39 %
Switching Operation, Road Furniture and Signage Cost −2.58 −2.75 −0.16 NA
Damage only Accidents Costs −0.03 −0.09 −0.06 −164.02 %
Net Cash Flow −8,320.20 −4,131.45 4,188.75 50.34 %
Strongly in Favour , 23.3%
In Favour, 30.7%
Neither, 9.0% Against, 29.7%
Strongly Aganist , 2.3%
Don’t Know, 5.1%
prior to the imposition of import restriction on them in 2005;
(ii) It appears that under a free market system without any regulatory control on importation of vehicles with re-spect to driving side, there will be overwhelming dom-inance of RHD vehicles in Rwanda;
(iii) Due to reduction of vehicle import and operating costs, a free market system without any restriction on RHD vehicles would likely to promote relatively higher over-all growth of vehicles in Rwanda;
(iv) The perception of majority of drivers in Rwanda is that the incremental impacts on accident due to driving odd RHD vehicles are not very significant. This is analogous to the findings of the research around the world; (v) It appears that driving a RHD vehicle in a LHD traffic
environment in Rwanda does not constitute a significant constraint;
(vi) It is evident that switching driving from the right to the left side of the road would be highly beneficial from economical (NPV about USD 2.9 billion), financial (net cash flow USD 4.2 billion) and international trading points of view;
(vii) As far as switching driving side is concerned, majority of the stakeholders support switching driving side in Rwanda. This is in line with the findings of the re-search; and
(viii) The public participatory approach has been found to be a very useful tool in arriving at a logical conclusion on switching driving side in Rwanda.
5.2 Recommendations
Depending on decision to switch driving side from right to left, the following courses action could be undertaken:
Business as usual situation (DN scenario):
i. Since odd HGVs are more susceptible to accidents, Rwanda must enact new regulation making it compul-sory for the foreign HGVs to be fitted with Fresnel lens or close proximity (Class V) mirror to the passen-ger’s side widow to resolve the blind spot which can otherwise hinder HGV drivers’vision of other traffic. Switch driving side (DS scenario):
If the decision were made to switch, efforts should be made to undertake adequate precautionary measures to smooth transition as follows:
i. Any decision regarding switching driving side must be taken before the implementation of ongoing signage project;
ii. It is essential to assign the responsibility of switching driving side to a high power body. It is therefore recommended to create a Steering Committee/ Authority to administer the conversion of driving side; iii. It will be difficult to implement the switching driving side without appropriate policy guidance. Appropriate policy guidance on switching driving side must be prepared well in advance of actual implementation; iv. It is imperative to provide adequate transition time to
ensure smooth transition between two operating sys-tems. Transition time and operation modalities re-quired for switching driving side must therefore be ascertained;
v. As traffic signals in urban areas are very complex, sufficient transition time must be given to change existing traffic signals in these areas;
vi. Due to non-availability of accident data with respect to driving side in Rwanda, it was not possible to assess the incremental impacts of odd vehicles on road acci-dents using primary data. Further study is needed to assess the incremental impacts of accidents due to presence of odd vehicles in the traffic stream and hence to adopt appropriate remedial measures; and vii. A comprehensive public awareness campaign must be
undertaken to ensure wide publicity in all languages, for at least 1 month prior to the implementation of switching directives. In addition it would be valuable to circulate informative booklets directly to the public.
Acknowledgements I acknowledge with gratitude the help and encour-agement of the former Minister for Infrastructure, the Ministry of Infra-structure, Rwanda, Ms Linda Bihire. A research programme like this could not have been achieved without her constant support and invaluable guidance. I also express my indebtedness to Mr. Dominique Rurangirwa, Law Officer, the Ministry of Infrastructure for his interest in the work and making logistic supports available during collection of data for the research. Thanks are also due to Ms Kathleen DeWitt, Senior Transport Engineer, the Ministry of Infrastructure and all the members of my data collection team for their sincere efforts to make the research and the data collection initiative a success.
Finally, I gratefully acknowledge the help and patience of my wife and family.
Open AccessThis article is distributed under the terms of the Creative Commons Attribution License which permits any use, distribution, and reproduction in any medium, provided the original author(s) and source are credited.
References
1. ADB-ASEAN (2005)“The Cost of Traffic Accidents in Cambodia: ADB-ASEAN Regional Road Safety Program”, Cambodia, 2005 2. AGA Institute (2009, June 1)A Guide to Patient Sampling.Retrieved
quality-initiatives/performance-measures/Instructions_for_Valid_ Sample.pdf
3. CoK (2008, March 1) Feasibility Study Report of Kigali Urban Road Upgrading Project.Final Report on Feasibility Study of Kigali Urban Road Upgrading Project. Kigali, Rwanda: City of Kigali, Rwanda 4. Cooper, P., Meckle, W., Nasvadi, G., & Wiggins, S. (2007, May 7)
The Safety of Right-hand drive vehicles in British Columbia. Retrieved June 1, 2009, from Insurance Corporatioin of British Columbia, Performance Analsysis Services:http://www.icbc.com/ road-safety/safety-research/righthand-drive.pdf
5. DfT (2006, June 1)Economic Assessment of Road Schemes, Section 1: The COBA Manual.Retrieved March 1, 2009, from Gov.uk:https:// www.gov.uk/government/publications/coba-11-user-manual 6. DfT (2006, September 1). Transport Statistics of Great Britain.
Retrieved June 5, 2009, fromwww.dft.gov.uk:http://webarchive. nationalarchives.gov.uk/20080108051731/http:/www.dft.gov.uk/ pgr/statistics/datatablespublications/tsgb/edition2006.pdf
7. DfT (2006)Variable Demand Modelling–Convergence, Realism and Sensitivity: TAG Unit 3.10.4.London: Department for Transport 8. DfT (2006, April 1)Variable Demand Modelling–Convergence, Realism and Sensitivity: TAG Unit 3.10.4.Retrieved June 1, 2009, fromwww.dft.gov.uk: http://www.dft.gov.uk/webtag/documents/ expert/pdf/unit3.10.4.pdf
9. DfT (2009, February 1)“TAG Unit 3.15.2 Use of TEMPRO data”. Retrieved February 1, 2009, from Department for Transport 10. DfT (2009, July 1)Road Freight Statistics 2009.Retrieved July 20,
2009, from www.dft.gov.uk: http://tna.europarchive.org/ 2 0 11 0 5 0 3 1 8 5 7 4 8 / h t t p : / w w w. d f t . g o v. u k / p g r / s t a t i s t i c s / datatablespublications/freight/goodsbyroad/roadfreightstatistics2009
11. GoR (2005, October 16) Presidential Degree. PRESIDENTIAL ORDER N° 40/01 OF 16/10/2005 MODIFIFYING AND COMPLEMENTING PRESIDENTIAL DECREE N° 85/01 OF 02 SEPTEMBER 2002 REGULATING GENERAL TRAFFIC POLICE AND ROAD TRAFFIC. Kigali, Rwanda: Government of Republic of Rwanda
12. Independent, T (2009, August 11)Rwanda want to drive on the left. Retrieved August 11, 2009, fromwww.independent.co.ug: http:// www.independent.co.ug/news/regional-news/1458-rwanda-wants-to-drive-on-the-left
13. Lucas, B (2009, July 1)Which side of the road do they drive on? Retrieved January 1, 2013, from Brian Lucus:http://brianlucas.ca/ roadside/
14. Parkin M, Powell M, Matthews K (2002) Economics. Addison-Wesley, Harlow. ISBN 0-273-65813-1
15. PSF (2007, 1 January) Competitiveness of Rwandan Transporters for International shipment of Goods. Kigali: Private Sector Federation, Rwanda
16. RNP (2009) Accident statisitics of Rwanda. Accident database of national police of Rwanda. National Police of Rwanda, Kigali 17. RoSPA (2009, June 1) Left Hand Drive HGV’s: Danger and
Solution. Retrieved June 1, 2009, from RoSPA: http://www. rospa.com/roadsafety/adviceandinformation/driving/left-hand-drive-hgvs.aspx
18. RRA (2009, June 1) Database for Vehicles registered in Rwanda Revenue Authority. Kigali, Rwanda