R E S E A R C H
Open Access
Selection of optimal pixel resolution for
landslide susceptibility analysis within the
Bukit Antarabangsa, Kuala Lumpur, by
using image processing and multivariate
statistical tools
Iqbal Quraishi
1*, Abul Hasnat
2and J. Paul Choudhury
1Abstract
Landslides are considered as one of the natural hazards responsible for casualties, damage of assets, and infrastructures. In many situations, collection of field data from remote places is difficult due to inaccessibility of landslide area. This paper examines landslide susceptibility in the Bukit Antarabangsa, Kuala Lumpur, to ease geographical studies, using image processing and multivariate statistical tools by reviewing the digital images using remote-sensing technique without any physical survey. We considered different pixel resolutions and report the effectiveness of using factor analysis, principal component analysis, linear discriminant analysis, and their hybridization. Eight types of databases for heavy, medium, and no landslide were created. The modeling works were carried out at 2 × 2, 4 × 4, 8 × 8, 16 × 16, 32 × 32, 64 × 64, 128 × 128, and 256 × 256 pixel resolutions. Results indicate 2 × 2 was optimal in both heavy and medium while 8 × 8 found to be ideal for no landslide region. Performance at different pixel resolutions was compared using receiver operating characteristic (ROC) curves, and average success of 87.36% was found. This simple yet robust system holds great potential for saving lives.
Keywords:Landslide, Image processing, Factor analysis, Principal component analysis, Linear discriminant analysis, Residual analysis, Multivariate statistical tools
1 Introduction
Landslide is an extreme natural phenomenon that takes a heavy toll on human life and property leaving far-reaching consequence not only on economy but also nature and ecosystem of the affected region. Flash flood, long and terrible monsoon, earthquake rock sliding or toppling, soil cave-in, and sudden profusion of snow melting are some of the elementals that precede land-slide in a particular area. Again, soil condition alters after earthquake or any other natural transformation in a region and its neighborhood making it more vulner-able to landslide. Landslide susceptibility analysis can be helpful in such case as certain preventive measures can
be taken in time to minimize future threat to human life in the best possible way. Tarantino et al. [1] had applied change detection techniques for monitoring landslides in southern Italy. Saha et al. [2] had utilized geographic information system (GIS)-based statistical approach for landslide susceptibility in the Himalayas. Liang et al. [3] had used multi-satellite images and GIS data for statis-tical analysis of landslide in Taiwan Island. Rau et al. [4] had applied time series satellite images for monitoring and assessment of landslide. Voigt et al. [5] had shown the efficient use of image analysis based on satellite images for landslide mapping. Joyce et al. [6] had also used image processing techniques with manual inter-pretation for predicting landslide proneness. Rainfall recording data had been taken by Martelloni et al. [7] for the prediction of landslide in a local territory of Emilia Romagna, Italy. Kanungo and Sharma [8] had * Correspondence:[email protected]
1Department of Information Technology, Kalyani Government Engineering College, Kalyani, Nadia, West Bengal, India
Full list of author information is available at the end of the article
obtained rainfall threshold values for landslides in and around Chamoli, Joshimath region of the Garhwal Himalayas, India. Cultivated, fallow, and wood land data had been investigated by Biro et al. [9] for landslide assessment. Topological, geological, and environmental parameters are used as parameters for landslide assess-ment by Akgun [10]. Aerial photographs and field sur-veys of Cameron Highlands, Malaysia, had been utilized by Pradhan et al. [11] to analyze landslide hazards, and accuracy of 83.45% was established. Pradhan et al. [12] have also used spatial-based statistical models for land-slide hazard analysis. Pradhan et al. [13] developed a neuro-fuzzy model using remote-sensing data and GIS in a part of the Cameron Highland areas in Malaysia. GIS and remote-sensing data were used by Lee et al. [14, 15] for the assessment of landslide. Historical data of rainfall and earthquake was taken by Muthu et al. [16] for land-slide analysis. Assessment of landland-slide using lithology, rock weathering, geomorphology, soil type, and depth had been conducted by Champatiray et al. [17]. It is observed that most of the authors have used field data like
geological and topological parameters, rainfall, and their likes in addition to the satellite image information of that place for the assessment of landslide susceptibility.
The objective of our research work is to analyze and asses the landslide susceptibility based on the examin-ation of the satellite images of a particular region. It must be borne in mind the image feature values of a landslide-affected area are different from those of the Fig. 1Block diagram of the proposed system
Table 1Pixel resolution and their dimensions
Databases Pixel resolution Width in pixels Height in pixels Total number of pixels
Images for database I 2 × 2 2 2 4
Images for database II 4 × 4 4 4 16
Images for database III 8 × 8 8 8 64
Images for database IV 16 × 16 16 16 256
Images for database V 32 × 32 32 32 1024
Images for database VI 64 × 64 64 64 4096
Images for database VII 128 × 128 128 128 16,384
Images for database VIII 256 × 256 256 256 65,536
Table 2Image features and their description
Feature No. of
Features Details
Fractal dimension 3 Mean of fractal dimension, standard deviation of fractal dimension, lacunarity
Ripplet coefficient 2 Mean of ripplet coefficient, standard deviation of ripplet coefficient
Autocorrelation coefficient
2 Mean of autocorrelation coefficient, standard deviation of autocorrelation coefficient
Gray level co-occurrence matrix
16 Four set of data values; each set consist of the contrast, homogeneity, energy, and correlation
Gray level run length matrix
44 Short run emphasis, long run emphasis, gray level non-uniformity, run length non-uniformity, run percentage, low gray level run emphasis, high gray level run emphasis, short run low gray level emphasis, short run high gray level emphasis, long run low gray level emphasis, long run high gray level emphasis. Each of the above was calculated for 0, 45, 90, and 135
Gabor coefficient 60 Mean and standard deviation of Gabor coefficients for 0, 15, 30, 45, 60, 75
Moments 4 First moment, second moment,
third moment, and fourth moment
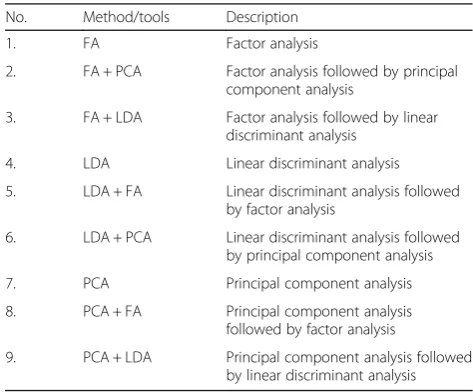
Table 3Multivariate statistical tools and their hybridized variants
No. Method/tools Description
1. FA Factor analysis
2. FA + PCA Factor analysis followed by principal
component analysis
3. FA + LDA Factor analysis followed by linear
discriminant analysis
4. LDA Linear discriminant analysis
5. LDA + FA Linear discriminant analysis followed
by factor analysis
6. LDA + PCA Linear discriminant analysis followed
by principal component analysis
7. PCA Principal component analysis
8. PCA + FA Principal component analysis
followed by factor analysis
9. PCA + LDA Principal component analysis followed
normal one. Examination of these changes in such parameters using image processing and multivariate stat-istical tools may hold the key. The main task in our re-search work constitutes the collection of image features; selection of principal features out of 131 image features; formation of eight databases with varying pixel reso-lution for heavy, medium, and no landslide-affected regions; selection of optimal pixel resolution out of 2 × 2, 4 × 4, 8 × 8, 16 × 16, 32 × 32, 64 × 64, 128 × 128, and 256 × 256 for heavy, medium, and no landslide-affected regions, respectively, based on residual analysis, multi-variate statistical tools, and their hybridized ones. Finally, analysis of performance, testing, and validation of the experimental work is carried out.
2 Methods
2.1 Data collection and database creation
A sequence of main processing phases proposed is furn-ished in Fig. 1. Eight types of databases are created for
heavy, medium, and no landsliaffected regions, de-pending on the condition of soil. Each database consists of 450 images of pixel resolution 2 × 2, 4 × 4, 8 × 8, 16 × 16, 32 × 32, 64 × 64, 128 × 128, and 256 × 256 respect-ively. The pixel resolution 2 × 2 indicates the length and breadth of the image is 2 pixels. The detailed description of image databases with varying pixel resolution is presented in Table 1.
Different pixel resolutions are considered for feature ex-traction. Li et al. [18] had estimated fractal dimension (FD) using box-counting approach as an important feature for texture description in an image. Whereas Hawlick et al. [19] reported a survey for various statistical and structural features for image texture classification like autocorrelation function, optical transform, digital transform, textural edge-ness, run length, gray tone co-occurrence, structural elem-ent, and autoregressive models. Thangavel and Manavalan [20] applied gray level co-occurrence matrix (GLCM) features for image classification of prostate cancer. Vari-ance, kurtosis, skewness, and geometric mean are used as features for fault diagnosis of ball bearing by Vakharia et al. [21]. Fernandez-Lozano et al. [22] used statistical and run length features for texture classification. Mercimek et al. [23] proposed moments as invariant global features of images in pattern recognition. Filho et al. [24] measured lacunarity using Gliding-Box and Differential Box-Counting Table 4Confusion matrix
Landslide occurrence
Occurred (yes) Occurred (no) Landslide
prediction
Predicted (yes) True positive (TP) False positive (FP)
Predicted (no) False negative (FN) True negative (FN)
algorithms to classify textures of urban regions. Fernando et al. [25] suggested a scheme for mining mid-level features based on Frequent Local Histograms for image classifica-tion. Lowe [26] used fast nearest-neighbor algorithm followed by a Hough transform for feature extraction. In this study, various statistical characteristics of images, viz., mean of fractal dimension, standard deviation of fractal dimension, lacunarity, mean of ripplet coeffi-cient, standard deviation of ripplet coefficoeffi-cient, mean of autocorrelation coefficient, and standard deviation of autocorrelation coefficient, are used for feature ex-traction of each image in eight databases. A total of 131 feature values are calculated. The details of fea-tures are presented in Table 2.
Out of 450 images taken into consideration for each database, 360 images are used to create the training
dataset and the remaining 90 images are used for test purpose.
2.2 Application of multivariate statistical tools and hybridization
Multivariate statistical tools, viz., factor analysis, princi-pal component analysis, and linear discriminant analysis are briefly discussed below.
2.2.1 Factor analysis (FA)
highest eigenvalues is the major component of the dataset [27, 28]. Then the lower important dimen-sions contributing less than 2.5% are discarded. The square root of the corresponding eigenvalues are taken and multiplied with the square of the eigen-vector to get the column-wise contributor for each of the major contributing component. At the last step, the ranges of cumulative values for each data-base are calculated.
2.2.2 Principal component analysis (PCA)
PCA [29] is used to recognize patterns in data of high dimension. At first, the mean of the dataset is calculated and subtracted from each of the data di-mensions. Then, the covariance matrix, eigenvectors, and eigenvalues are calculated. The lower important dimensions contributing less than 2.5% are discarded. The corresponding eigenvalues are multiplied with
the square of the eigenvector to get the column-wise contributor for each of the major contributing com-ponents. The ranges of cumulative values for each database are calculated.
2.2.3 Linear discriminant analysis (LDA)
create the modified matrix. Next, contributions of ei-genvectors among all the eigenvalues are calculated. The lower important dimensions contributing less than 2.5% are discarded. The corresponding eigen-values are taken and multiplied with the square of
the eigenvectors to get the column-wise contributor for each of the major contributing component. The range of cumulative values for each database is calcu-lated. The hybridized variant of FA, PCA, and LDA are applied also as shown in Table 3.
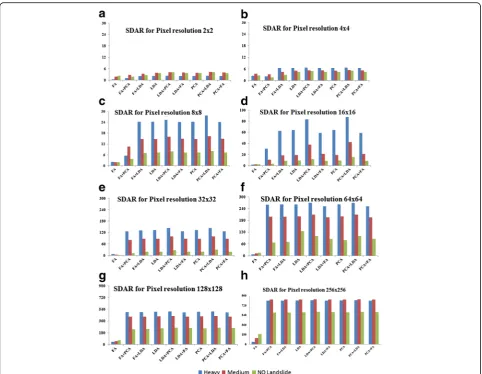
Fig. 5Variation of values of SDAR (Y-axis) against different multivariate statistical tools (X-axis). (a) 2 × 2, (b) 4 × 4, (c) 8 × 8, (d) 16 × 16, (e) 32 × 32, (f) 64 × 64, (g) 128 × 128, (h) 256 × 256 pixel resolutions. Blue, red and green colors represent heavy, medium and no landslide respectively
Table 5Values of MAR, MMRE, and SDAR for heavy landslide prone regions using FA
Pixel resolution MAR MMRE SDAR
2 × 2 0.206782785 0.252547158 0.442549705
4 × 4 1.662994379 0.263329912 2.50564727
8 × 8 1.047158087 0.211043584 2.19255461
16 × 16 1.847208125 0.237919993 2.054714319
32 × 32 6.70861389 0.293023533 7.852577432
64 × 64 5.748555656 0.168775894 7.863123912
128 × 128 23.5687214 0.190467907 41.43065804
256 × 256 24.55296951 0.122525748 46.07557327
Table 6Values of MAR, MMRE, and SDAR for medium landslide prone regions using FA
Pixel resolution MAR MMRE SDAR
2 × 2 0.761354656 0.197167578 1.933125496
4 × 4 2.140939402 0.336082884 3.581477082
8 × 8 0.899307899 0.12736707 2.001307805
16 × 16 1.49834217 0.131642179 2.627122352
32 × 32 3.260209915 0.155194255 3.835789063
64 × 64 8.523614596 0.191849412 12.44882429
128 × 128 27.65028247 0.208976205 52.43451591
2.3 Residual analysis
Residual analysis is done to assess the performance of the multivariate statistical tools and their hybridized variants while applied on all the databases. The parame-ters used in this study for performance evaluation are absolute residual (AR), mean of absolute residual (MAR),
standard deviation of absolute residual (SDAR), mean residual error (MRE), and mean of mean residual error (MMRE) [31, 32]. The smaller value of these parameters of residual analysis indicates better model. The different parameters are defined using Eqs. 1–5.
Absolute Residual;ARð Þ ¼i;j jactualð Þi;j −apprð Þi;j j ð1Þ
Mean of Absolute Residual MARð Þ ¼
Xm i¼1
Xn j¼1ARð Þi;j mn
ð2Þ
Standard Deviation of Absolute Residual SDARð Þ
¼
ffiffiffiffiffiffiffiffiffiffiffiffiffiffiffiffiffiffiffiffiffiffiffiffiffiffiffiffiffiffiffiffiffiffiffiffiffiffiffiffiffiffiffiffiffiffiffiffiffiffiffiffiffiffiffiffiffiffiffi
Xm
i¼1
Xn
j¼1ðARð Þi;j −MARÞ 2
mn s
ð3Þ
Mean of Residual Error;MREð Þ ¼i;j jactualð Þi;j−apprð Þi;j
actualð Þi;j
ð4Þ
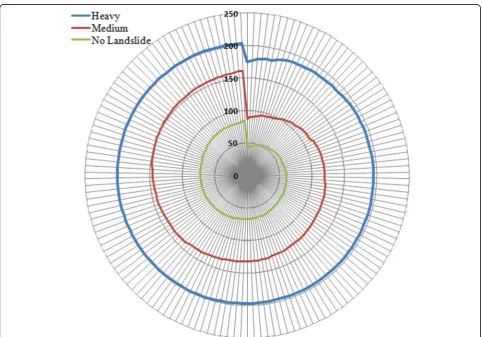
Fig. 6Variation of cumulative values (Y-axis) against 2 × 2 pixel resolution image samples (X-axis) after application of FA. Blue, red, and green colors represent heavy, medium, and no landslide respectively
Table 7Values of MAR, MMRE, and SDAR for no landslide prone regions using FA
Pixel resolution MAR MMRE SDAR
2 × 2 0.861486797 0.185372755 2.256215954
4 × 4 1.48792689 2.143451896 2.723227198
8 × 8 0.895715057 0.111072934 2.036777743
16 × 16 1.258698993 0.128076209 2.60819919
32 × 32 1.248390761 0.126545613 2.529666286
64 × 64 8.832916851 0.195855956 14.89904491
128 × 128 33.91913036 0.188469583 64.86457402
Mean of MRE MMREð Þ ¼
Xm
i¼1
Xn
j¼1MREð Þi;j
mn ð5Þ
Where actual(i,j) and appr(i,j) are (i,j)th element in the true value matrix and observed value matrix having mrows andncolumns respectively.
2.4 Validation statistics
True positive (TP) values are the incidents where models have correctly predicted landslide. False positive (FP) or false alarms are the situation where the models predicted landslide but, actually, landslide has not occurred. False negative (FN) or missed alarms are the instances where the models predicted no landslide but, actually, landslide has occurred. True negative (TN) values are the inci-dents where the model has correctly predicted no land-slide. Correct prediction (true positive and true negative) and errors (false negative and false positive) are calcu-lated. These terms are defined by a confusion matrix as given in Table 4.
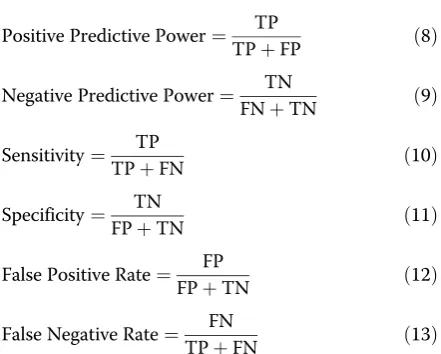
The validation statistics, viz., efficiency, misclassifica-tion rate, positive predictive power, negative predictive power, sensitivity, specificity, false positive rate, and false negative rate, are defined using Eqs. 6–13.
Efficiency ¼ TPþTN
TPþTNþFPþFN ð6Þ
Misclassification Rate¼ FPþFN TPþTNþFPþFN
ð Þ ð7Þ
Positive Predictive Power¼ TP
TPþFP ð8Þ
Negative Predictive Power¼ TN
FNþTN ð9Þ
Sensitivity¼ TP
TPþFN ð10Þ
Specificity¼ TN
FPþTN ð11Þ
False Positive Rate¼ FP
FPþTN ð12Þ
False Negative Rate¼ FN
TPþFN ð13Þ
Sensitivity, specificity, and receiver operating charac-teristic (ROC) are used to measure the superiority and trustworthiness of an assessment. Sensitivity assesses the superiority of the assessment by identifying positive landslide. Whereas specificity calculates approximately the possibility of a region without landslide would be ac-ceptably discarded. ROC curve is a graphic arrangement to display the relationship between sensitivity and speci-ficity, and it assists for best model selection by deciding the optimal threshold for the landslide assessment. Posi-tive predicPosi-tive power is the percentage of regions with a positive assessment which actually have the landslide. Negative predictive power is the percentage of regions with a negative assessment which do not have the land-slide. Positive and negative predictive powers are directly related to the prevalence of the landslide in the regions.
3 Results and discussions
3.1 Data collection
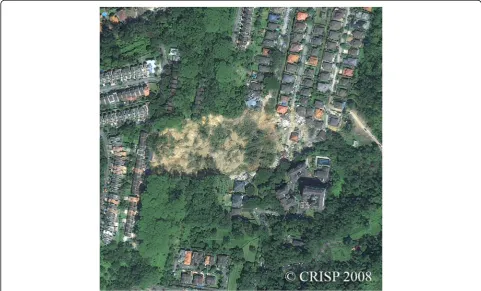
A landslide took place at Taman Bukit Mewah, Bukit Antarabangsa, Hulu Kelang, Selangor, Kuala Lumpur, Malaysia, at 3:30 a.m. measuring 109 m in width, 120 m in length, and 15 m in depth. About 101,500 m3of ground had moved. It had totally obstructed the only communi-cating road, Jalan Bukit Antarabangsa, with neighborhood. The satellite images after landslide of Bukit Antarabangsa were collected from Ikonos Satellite Image ©Centre for Remote Imaging, Sensing and Processing, National University of Singapore via http://www.crisp.nus.edu.sg [33]. Figure 2 shows the place at Bukit Antarabangsa on the north-eastern side of Kuala Lumpur collected on 9 December 2008, after landslide. It is situated at latitude 3° 9'58.94"Nand longitude 101∘45'33.392"E. The image shows the source, track, and expanded toe of the landslide. The lower part of the landslide buried a number of houses, damaged other objects, and carried parts of buildings with down slope. Low et al. [34] carried out detailed analysis of Bukit Antarabangsa landslide and concluded prolonged rainfall as the main causal factor.
Table 9Matching and alarm statistics
Exp no. Pixel resolution TP TN FP FN
H M N H M N H M N H M N
1 2 × 2 15 8 7 20 11 22 1 1 2 1 1 1
2 4 × 4 17 5 13 22 10 13 1 2 1 2 2 2
3 8 × 8 10 7 8 19 9 26 3 1 2 1 2 2
4 16 × 16 16 8 12 18 9 15 4 3 2 1 1 1
5 32 × 32 12 8 12 17 15 13 1 1 2 3 2 4
6 64 × 64 9 7 10 13 13 23 3 2 2 3 1 4
7 128 × 128 11 7 12 12 10 26 2 4 2 1 1 2
8 256 × 256 13 8 17 15 12 14 3 1 2 1 2 2
Note: H, M, and N represents heavy, medium, and no landslide cases respectively
Table 8Range of cumulative values for different types of2× 2 pixel resolution images using FA
Image type Minimum cumulative value Maximum cumulative value
Heavy 174.3266 203.1112
Medium 87.3197 161.3021
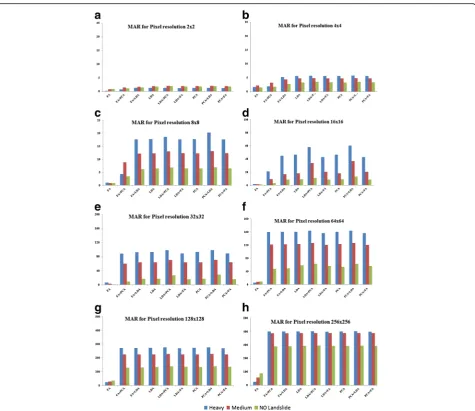
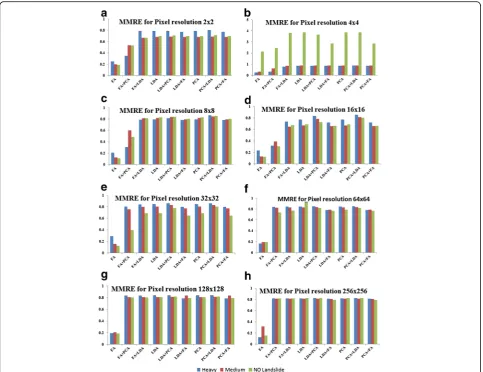
3.1.1 Residual analysis
The values of MAR, MMRE, and SDAR for the three types of images of heavy landslide prone region, medium landslide prone region, or no landslide prone region are calculated and shown in Figs. 3a–h, 4a–h, and 5(a–h) re-spectively. It is observed that in all the three cases, the values obtained using factor analysis is better than that of the other multivariate statistical tools or their hybridized variants. So, all the experimental results shown here are calculated using factor analysis only. Best pixel resolution among 2 × 2–256 × 256, the values of MAR is selected, and MMRE and SDAR are calculated using factor analysis only (Tables 5, 6 and 7) for three types of images. In the case of heavy landslide prone region, it is found (Table 5) that out of three parameters of residual analysis, pixel resolution of 2 × 2 gives better result in terms of MAR and SDAR, while pixel resolution of 256 × 256 gives better result in terms of MMRE. Therefore, pixel resolution of 2 × 2 becomes ideal for heavy landslide prone region. In the case of medium landslide prone region (Table 6), pixel resolution of 2 × 2 gives better result in terms of MAR and SDAR, while pixel resolution of 8 × 8 gives better re-sult in terms of MMRE. Therefore, pixel resolution of 2 × 2 is ideal for medium landslide prone region also.
In the case of no landslide prone region (Table 7), the pixel resolution of 8 × 8 gives better result in terms of MMRE and SDAR, while pixel resolution of 2 × 2 gives bet-ter result in bet-terms of MAR. Therefore, pixel resolution of 8 × 8 becomes ideal for no landslide prone region. The pixel resolution of 2 × 2 is suitable in heavy and medium land-slide prone region, while pixel resolution of 8 × 8 is suitable for no landslide prone region. So, pixel resolution of 2 × 2 can be considered ideal for landslide images (heavy and medium). The variation of cumulative values of 2 × 2 pixel resolution images of heavy, medium, and no landslide af-fection after application of FA is shown in Fig. 6. It is found that the range of cumulative values for heavy, medium, and no landslide affection are well separated.
The blue and red colors show the cumulative values for landslide affected images (heavy and medium), whereas green color shows no landslide affected images. The ranges of cumulative values after application of FA for dif-ferent types of images with 2 × 2 pixel resolution are shown in Table 8. It is observed from the experimental re-sults that the cumulative values for no landslide regions lies between 43 and 85, whereas the cumulative values for heavy landslide region lies between 174 and 203. It is also found that the cumulative values for medium landslide re-gions lie between 87 and 161.
3.1.2 Validation
In the validation step, 90 landslide images for each pixel resolution 2 × 2–256 × 256 are taken and evaluated in terms of true positive (TP), true negative (TN), false posi-tive (FP), and false negaposi-tive (FN) values (Tables 9 and 10). From Table 11, it is found that the lowest and the highest accuracies are 92.2 and 83.3% respectively. For performance evaluation, sensitivity, specificity, accuracy, and the area under the receiver operator curve (ROC) metric are used. Table 10Validation results
SN S No.
Attributes 2 × 2 4 × 4 8 × 8 16 × 16 32 × 32 64 × 64 128 × 128 256 × 256 Average
1 TP 30 35 25 36 32 26 30 38 30.75
2 TN 53 45 54 42 45 49 48 41 47.13
3 FP 4 4 6 9 4 7 8 6 6.25
4 FN 3 6 5 3 9 8 4 5 5.87
Table 11Prediction accuracy Attributes 2 ×
2 4 × 4 8 × 8 16 × 16 32 × 32 64 × 64 128 × 128 256 × 256 Average
Samples 90 90 90 90 90 90 90 90 90
Correct prediction
83 80 79 78 77 75 78 79 78.62
Accuracy 92.2 88.8 87.7 83.3 85.5 83.3 86.6 87.7 87.36
Fig. 7Relative performance measure for different pixel resolutions
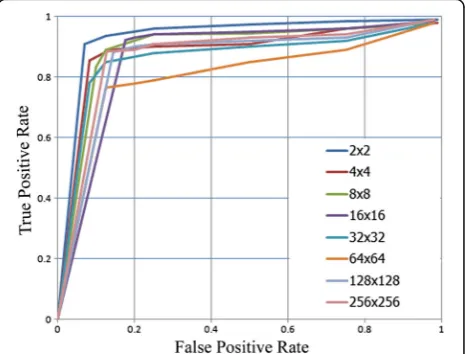
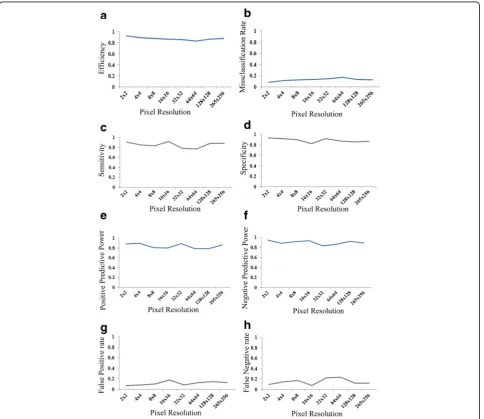
A comparison between accuracy, sensitivity, and specificity is given. The results are plotted in Fig. 7 which depict higher value of accuracy, sensitivity, and specificity. Figure 7 shows better performance of the present study. The per-formance of the system at different pixel resolutions is eval-uated using receiver operating characteristic (ROC) curves [35, 36] as shown in Fig. 8. The highest area under the curve (93%) (Fig. 8) is obtained for 2 × 2 pixel resolution. Validation statistics, viz., efficiency, misclassification rate, positive predictive power, negative predictive power, sensi-tivity, specificity, false positive rate, and false negative rate, are calculated and plotted as shown in Fig. 9. The optimal efficiency (92.22%), misclassification rate (7.77%), negative predictive power (94.64%), specificity (92.98%), and false positive rate (7%) are found in the case of 2 × 2 pixel
resolution in this study. Optimal value of sensitivity (92.30%) and false negative rate (7.69%) are considered in the case of 16 × 16 pixel resolution.
From the experimental results, it may be concluded that FA performs better compared to the multivariate statistical tools (PCA or LDA) and their hybridized variants. Accord-ing to Kim [37], PCA or LDA analyzes all of the variance of the set of variables (common variance and unique vari-ance), whereas FA analyzes only common variance (correl-ation) of the set of variables. The use of PCA and LDA are data reduction by summarizing many variables into a smaller number of components. On the other hand, FA finds a factor model that can reproduce observed correl-ation; thus, it aimed at explaining the correlation between variables. In hybridized variants of multivariate statistical
tools, values arising from PCA or LDA overpower the effect of values arising from FA. So, more deviation of output values is found in hybridized variants of multivariate statis-tical tools than that of FA.
4 Conclusions
In this paper, multivariate statistical tools were used for re-ducing number of features in order to boost performance of the system with regard to landslide susceptibility ana-lysis. Eight databases were created, and residual analysis was used to decide the best multivariate statistical tools and their hybridized variants. Factor analysis was per-formed and found to be superior to others and applied thereby. The performance of the system was evaluated using various statistical parameters such as sensitivity, specificity, accuracy, and ROC. The experimental results revealed that the pixel resolution 2 × 2 based on factor analysis performs best for heavy and medium landslide images, whereas pixel resolution 8 × 8 based on factor analysis came out as optimal for no landslide images. In terms of accuracy also, 2 × 2 pixel resolutions show outstanding performance. The developed system can be effectively used for landslide susceptibility analysis for different landslide-affected regions with only satellite im-ages in hand without any physical survey. The validation statistics also prove the robustness of the system can en-able analysis of landslide susceptibility of remote locations and holds great prospect for saving lives of human being under the threat of disaster.
Abbreviations
AR:Absolute residual; FA: Factor analysis; FD: Fractal dimension; FN: False negative; FP: False positive; GIS: Geographic information system; GLCM: Gray level co-occurrence matrix; LDA: Linear discriminant analysis; MAR: Mean of absolute residual; MMRE: Mean of mean residual error; MRE: Mean residual error; PCA: Principal component analysis; ROC: Receiver operating characteristic; SDAR: Standard deviation of absolute residual; TN: True negative; TP: True positive
Acknowledgements
We acknowledge Ikonos Satellite Image, Centre for Remote Imaging, Sensing and Processing, National University of Singapore, for providing satellite images after the landslide of Bukit Antarabangsa via http:// www.crisp.nus.edu.sg.
Funding
We acknowledge TEQIP-II, Government College of Engineering and Textile Technology, Berhampore, West Bengal, India, for providing financial support.
Authors’contributions
MIQ designed and tested the proposed algorithm and drafted the manuscript. AH tested the algorithm. MIQ carried out the database creation, application of multivariate statistical tools, and their hybridizations along with in-depth residual analysis. JPC participated in the algorithm design. MIQ performed the performance and statistical analysis. All authors read and approved the final manuscript.
Competing interests
The authors declare that they have no competing interests.
Author details
1Department of Information Technology, Kalyani Government Engineering College, Kalyani, Nadia, West Bengal, India.2Department of Computer Science & Engineering, Govt. College of Engineering and Textile Technology, Berhampore, Murshidabad, West Bengal, India.
Received: 3 September 2016 Accepted: 15 February 2017
References
1. C Tarantino, P Blonda, G Pasquariello, Application of change detection techniques for monitoring man-induced landslide causal factors, IEEE.2, pp 1103-1106 (2004). 0-7803-8742-2/04.
2. AK Saha, RP Gupta, I Sarkar, MK Arora, E Csaplovics, An approach for GIS-based statistical landslide susceptibility zonation—with a case study in the Himalayas. Landslides.2, 61–69 (2005). doi:10.1007/s10346-004-0039-8 3. L Liang, K Chen, U Chang, J Lien, Monitoring and statistical analysis of
landslides in Taiwan Island using multi satellite images and GIS Data, IEEE.2, pp 1231-1234 (2007). 1-4244-1212-9/07.
4. J Rau, L Chen, J Liu, T Wu, Dynamic monitoring and disaster assessment for watershed management using time-series satellite images, IEEE.45(6), 0196-2892 (2007).
5. S Voigt, T Kemper, T Riedlinger, R Kiefl, K Scholte, H Mehl, Satellite image analysis for disaster and crisis-management support, IEEE.45(6), 0196-2892 (2007). 6. KE Joyce, GD Dellow, PJ Glassey, Assessing image processing techniques for
mapping landslides, IGARSS, IEEE.2, pp 1231-1234 (2008). 978-1-4244-2808-3/08. 7. G Martelloni, S Segoni, R Fanti, F Catani, Rainfall thresholds for the
forecasting of landslide occurrence at regional scale. Landslides.9, 485–495 (2012). doi:10.1007/a10346-011-0308-2
8. DP Kanungo, S Sharma, Rainfall thresholds for prediction of shallow landslides around Chamoli-Joshimath region, Garhwal Himalayas, India. Landslides.11, 629–638 (2014). doi:10.1007/s10346-013-0438-9 9. K Biro, B Pradhan, M Buchroithner, F Makeschin, Landuse/Land cover
change analysis and its impact on soil Properties in the northern part of gadarif region, Sudan, Land Degradation & Development Wiley online library. (2011). doi: 10.1002/ldr.1116.
10. A Akgun, EA Sezer, HA Nefeslioglu, C Gokceoglu, B Pradhan, An easy-to-use MATLAB program (MamLand) for the assessment of landslide susceptibility using a Mamdani fuzzy algorithm.Computers & Geosciences. (2011). doi:10.1016/j.cageo.2011.04.012.
11. B Pradhan, S Lee, MF Buchroithner, Use of geospatial data for the development of fuzzy algebraic operators to landslide hazard mapping: a case study in Malaysia. Appl. Geomatic.1, 3–15 (2009)
12. B Pradhan, AM Youssef, Manifestation of remote sensing data and GIS on landslide hazard analysis using spatial-based statistical models, Arabian. J. Geosciences. (2009). doi:10.1007/s12517-009-0089-2
13. B Pradhan, S Lee, Landslide susceptibility assessment and factor effect analysis: back propagation artificial neural networks and comparison with frequency ratio and bivariate logistic regression modeling. Environ. Model. Softw.25, 747–759 (2010)
14. S Lee, DG Evangelista, Earthquake induced landslide susceptibility mapping using an artificial neural network. Nat. Hazards. Earth. Syst. Sci.6, 687–695 (2006) 15. S Lee, Application and verification of fuzzy algebraic operators to landslide
susceptibility mapping. Environ. Geol.52, 615–623 (2007)
16. K Muthu, M Petrou, C Tarantino, P Blonda, Landslide possibility mapping using fuzzy approaches. IEEE. Trans. Geosci. Remote. Sens.46(4), 1253–1265 (2008). doi:10.1109/tgrs.2007.912441
17. PK Champatiray, S Dimri, RC Lakhera, S Santosh, Fuzzy-based method for landslide hazard assessment in active seismic zone of Himalaya. Landslides. 4, 101–111 (2007)
18. J Li, Q Du, C Sun, An improved box-counting method for image fractal dimension estimation. Pattern. Recogn.422, 460–2469 (2009). doi:10.1016/j.patcog
19. RM Hawlick, Statistical and structural approaches to texture. Proc. IEEE.67(5), 786–804 (1979)
20. R Thangavel, R Manavalan, Soft computing models based feature selection for TRUS prostate cancer image classification. Soft. Comput.18, 1165–1176 (2014). doi:10.1007/s00500-013-1135-2
22. C Fernandez-Lozano, JA Seoane, M Gestal, TR Gaunt, J Dorado, C Campbell, Texture classification using feature selection and kernel based technique. Soft. Comput.19, 2469–2480 (2015). doi:10.1007/s00500-014-1573-5 23. M Mercimek, K Gulez, TV Mumcu, Real object recognition using moment
invariants. Sadhan.30(6), 765–775 (2005)
24. MNB Filho, FJA Sobreira, Accuracy of lacunarity algorithms in texture classification of high spatial resolution images from urban areas, The International Archives of the Photogrammetry. Remote Sensing and Spatial Information Sciences.vxxxvii(b3b), pp 417-422 (2008).
25. B Fernando, E Fromont, T Tuytelaars, Mining mid-level features for image classification. Int. J. Comput. Vis.108, 186–203 (2014). doi:10.1007/s11263-014-0700-1
26. DG Lowe, Distinctive image features from scale-invariant keypoints. Int. J. Comput. Vis.60(2), 91–110 (2004)
27. AC Rencher,Methods of Multivariate Analysis, 2nd Edn. (John Willey, USA, 2002), pp 102-105.
28. R Doerffer, D Murphy, Factor analysis and classification of remotely sensed data for monitoring tidal flats. Helgolander. Meeresunters.43, 275–293 (1989) 29. C Rodarmel, J Shan, Principal component analysis for hyperspectral image
classification. Surveying. Land. Inf. Syst.62(2), 115–123 (2002)
30. RA Johnson, DW Wichern,Applied Multivariate analysis, 6th Edn. (Pearson Prentice Hall, New Jersey, 2007), pp 102-110.
31. C Yan, Y Zhang, J Xu, F Dai, J Zhang, Q Dai, F Wu, Efficient parallel framework for HEVC motion estimation on many-core processors. IEEE. Trans. Circuits. Syst. Video. Technol.24(12), 2077–2089 (2014)
32. C Yan, Y Zhang, J Xu, F Dai, L Li, Q Dai, F Wu, A highly parallel framework for HEVC coding unit partitioning tree decision on many-core processors. IEEE. Signal. Process. Lett.21(5), 573–576 (2014)
33. Ikonos Satellite Image, Centre for Remote Imaging, Sensing and Processing, National University of Singapore. http://www.crisp.nus.edu.sg. Accessed 20 Mar 2016.
34. TH Low,Area based landslide hazard assessment for hillside development, (Ph. D thesis, University of Malaya, 2011)
35. E Yesilnacar, T Topal, Landslide susceptibility mapping: a comparison of logistic regression and neural networks methods in medium scale study, Hendek region, Turkey. Eng. Geol.79, 251–266 (2005). doi:10.1016/j.enggeo. 2005.02.002
36. JA Swets, Measuring the accuracy of the diagnostic systems. Science.240, 1285–1293 (1988). doi:10.1126/science.3287615.
37. HJ Kim, Common factor analysis vs principal component analysis: choice for symptom cluster research. Asian. Nurs. Res.2(1), 17–24 (2008)
Submit your manuscript to a
journal and benefi t from:
7Convenient online submission 7Rigorous peer review
7Immediate publication on acceptance 7Open access: articles freely available online 7High visibility within the fi eld
7Retaining the copyright to your article